

Briefly: in our opinion, small (50% of the regular size of the position) speculative long position in gold, silver, and mining stocks are justified from the risk/reward point of view at the moment of publishing this Alert. In other words, we are (likely temporarily) closing our short position (this particular short position was opened about a month ago) and we are taking profits off the table. At the same time we are opening a small long position.
Yes, you read that right. Despite all the bearish developments that we described in the previous analyses, and despite myriads of bearish factors that remain in place for the following months, it seems that the white metal is about to rally. Gold, and mining stocks could move higher as well, and we'll move to that shortly. For now, let's talk silver.
(click the above chart to enlarge it)
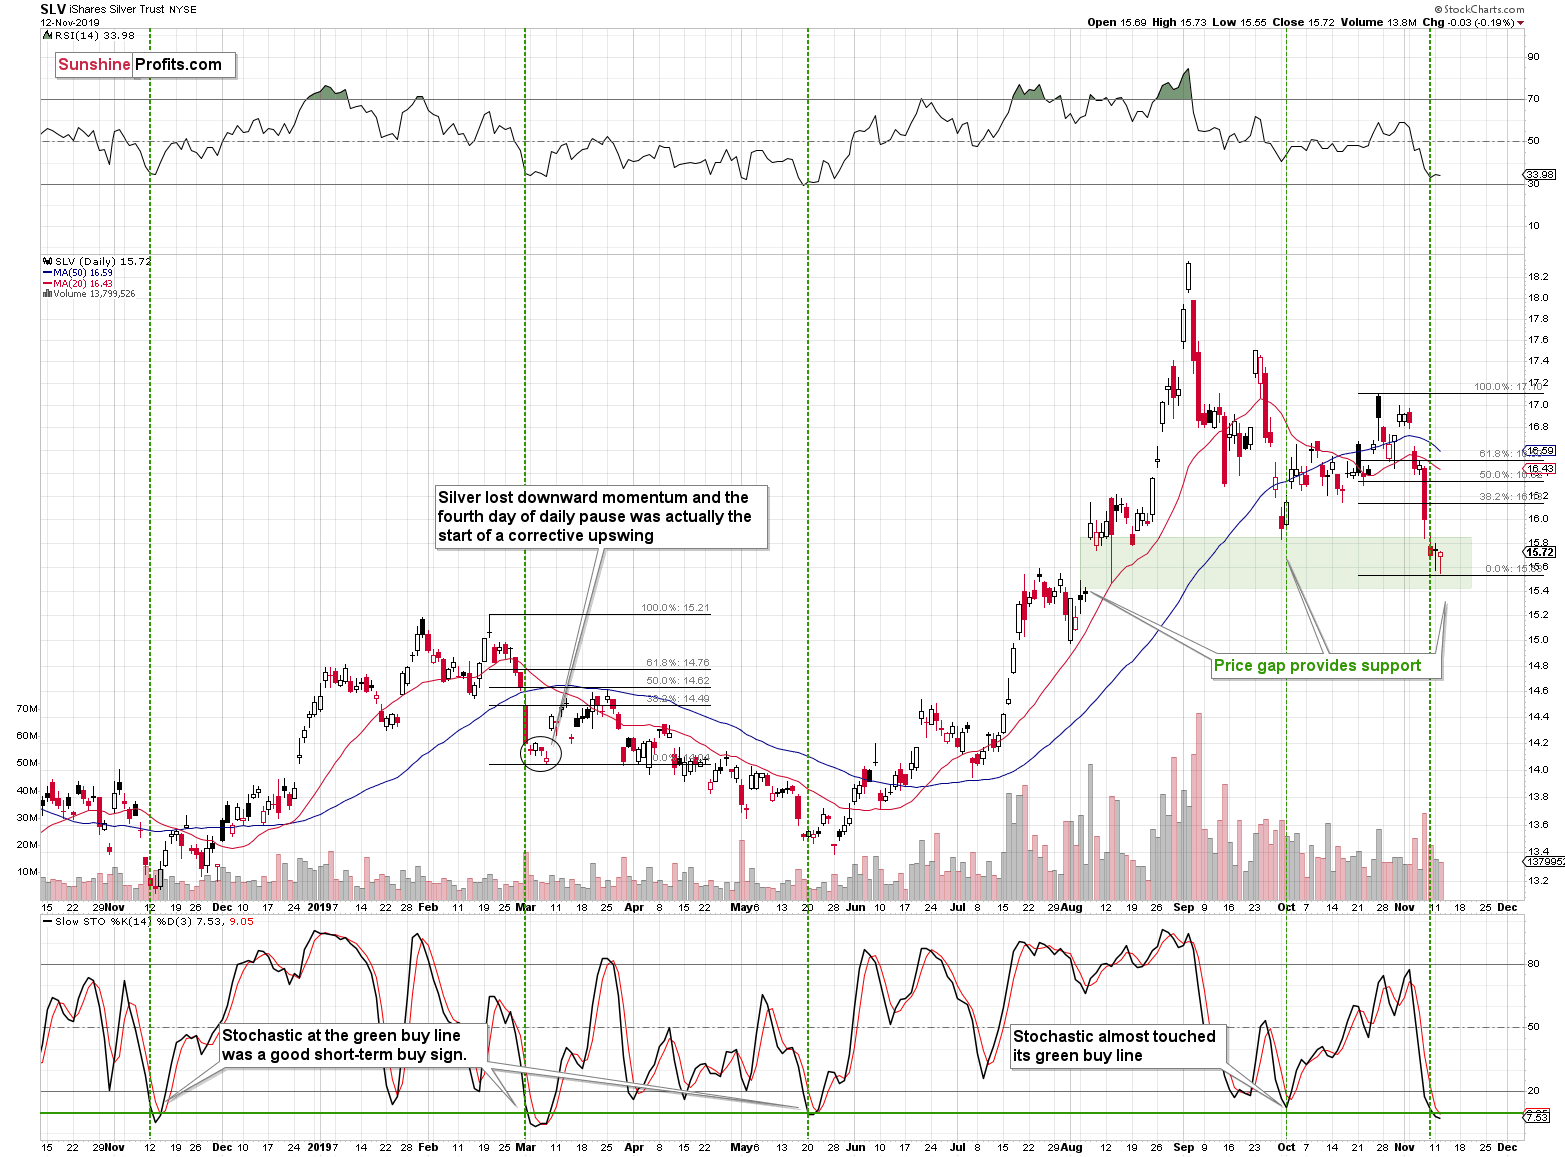
In particular, we're going to discuss the SLV ETF. This ETF has one big advantage over silver futures chart that we feature regularly. It puts emphasis on price gaps and shows only that trading which took place when the U.S. market was open. This distinction can be helpful in determining support and resistance levels as price gaps tend to provide such. In fact, the late-September bottom formed once silver touched the upper border of its price gap.
The SLV was attempting to break below the lower border of the gap and it has failed to do so three times. This serves as an indication that the white metal is not yet ready to break lower. The price gap on its own would not be strong enough to make the short-term silver outlook bullish all by itself, but that's not the only thing that's pointing to higher silver prices in the near term.
The RSI indicator (upper part of the chart) is close to 30, and that's when silver's short-term rallies used to start.
More interestingly, the Stochastic indicator just moved to levels that are low enough to indicate a short-term buying opportunity on their own. This simple technique worked very well in the previous 12 months. Almost exactly 1 year ago it confirmed a medium-term bottom, in early March it indicated a short-term buying opportunity, and in mid-May it was very close to pinpointing the exact bottom before the mid-year rally. We saw Stochastic close to the buy line also at the end of September, which doesn't really count as a true bullish signal, but silver moved higher nonetheless. So, we have three out of three efficiency with a little bonus confirmation from about 1.5 months ago. While this doesn't make a short-term rally inevitable, it does make it quite likely.
And now for the final silver sign - the time. Silver tends to move in a very specific way. It moves very fast for a few days, only to act very calm in the next several days. Some might say that it's similar to how spiders move in terms of seconds. Personally, we find the silver view much more appealing... What does this have to do with the chance for a short-term upswing in silver? Quite a lot.
Silver already lost its downward momentum as its been calm for a few days now. This characteristic pattern is what we saw also when silver completed a broad top (just as it did recently) earlier this year. In early March, the fourth day of the calm after the storm, was actually a local bottom that was followed by a rally to the 50% Fibonacci retracement. Not a ground-breaking rally, but definitely something one would prefer to ride on the long side of the market rather than being short.
Just as one swallow doesn't make a summer, one analogy to the previous decline isn't necessary meaningful. But that was not the only case. Silver declined in a very similar manner after the 2016 rally.
(click on the chart to enlarge it)
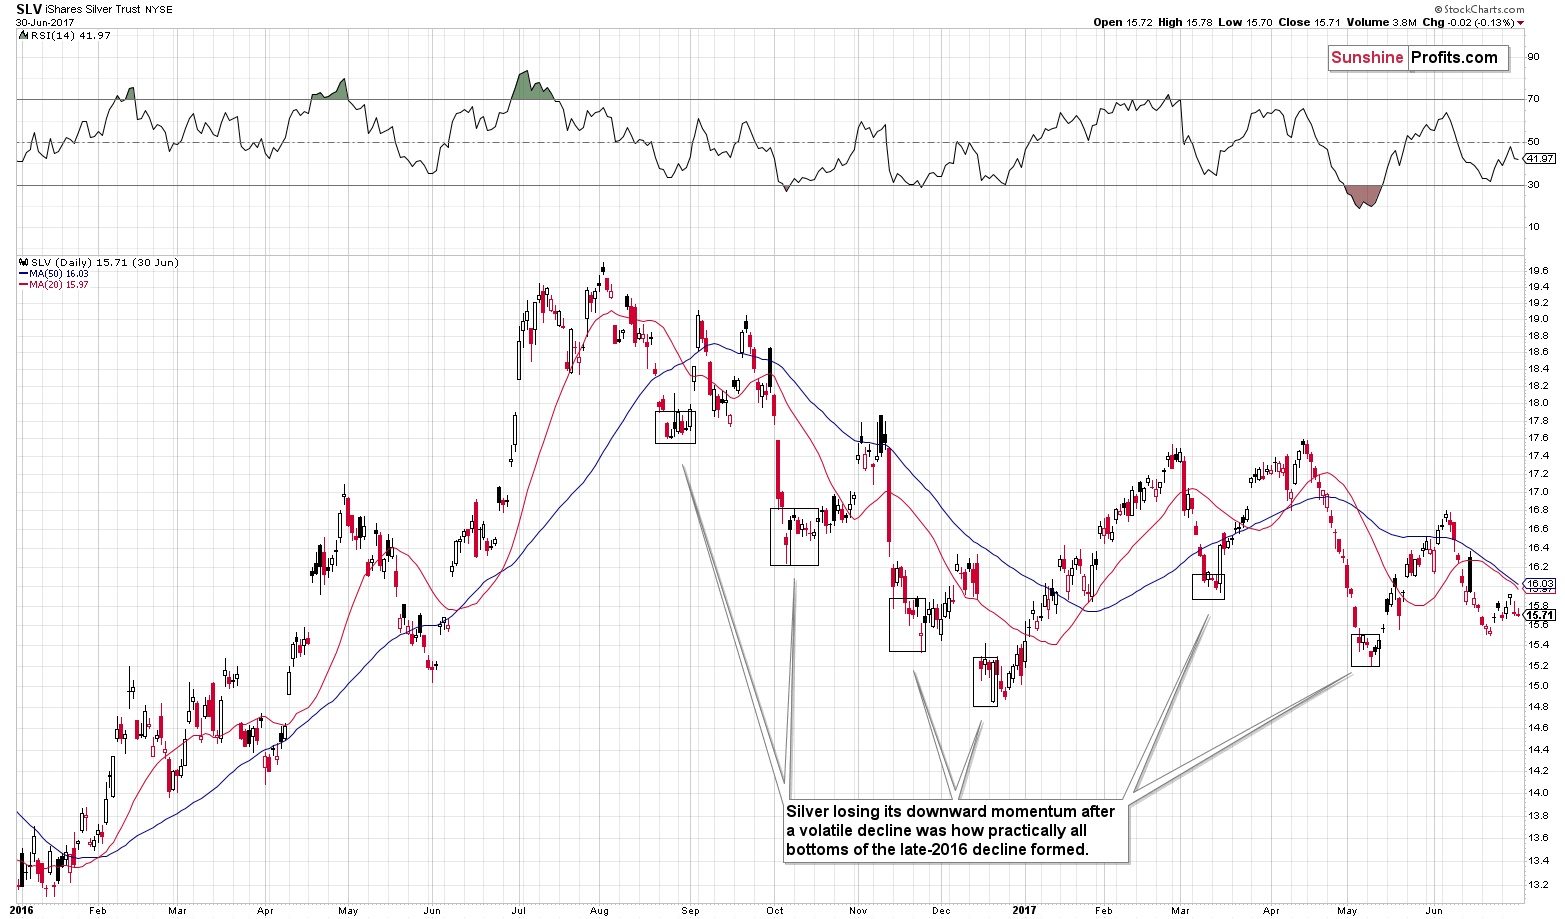
As you can see, silver losing its downward momentum after a volatile decline was how practically all bottoms of the late-2016 decline formed. We saw the same thing in case of the first two important bottoms of 2017.
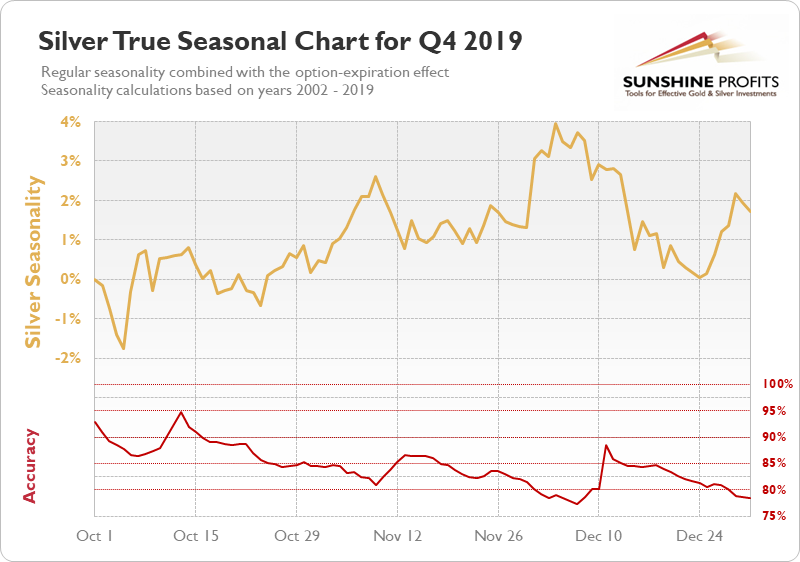
The silver seasonality also suggests that the short-term decline in the white metal might be over or close to being over as local bottoms tend to form close to the middle of November.
What does it all come to? It means that - as far as the next week or two are concerned - the outlook for silver just became bullish. In fact, we just wrote to our subscribers that we're taking profits off the table in case of the short positions and in today's Gold & Silver Trading Alert, we clearly outlined the details of making money on the upcoming upswing. These details cover positions in gold, silver, UGLD, USLV, GDX, NUGT, and JNUG. And they can all be yours for just $9 as that's how little it takes to subscribe for the first 3 weeks. Subscribe and grab this opportunity while you can.
And what about gold and mining stocks?
The Rest of the PMs Sector
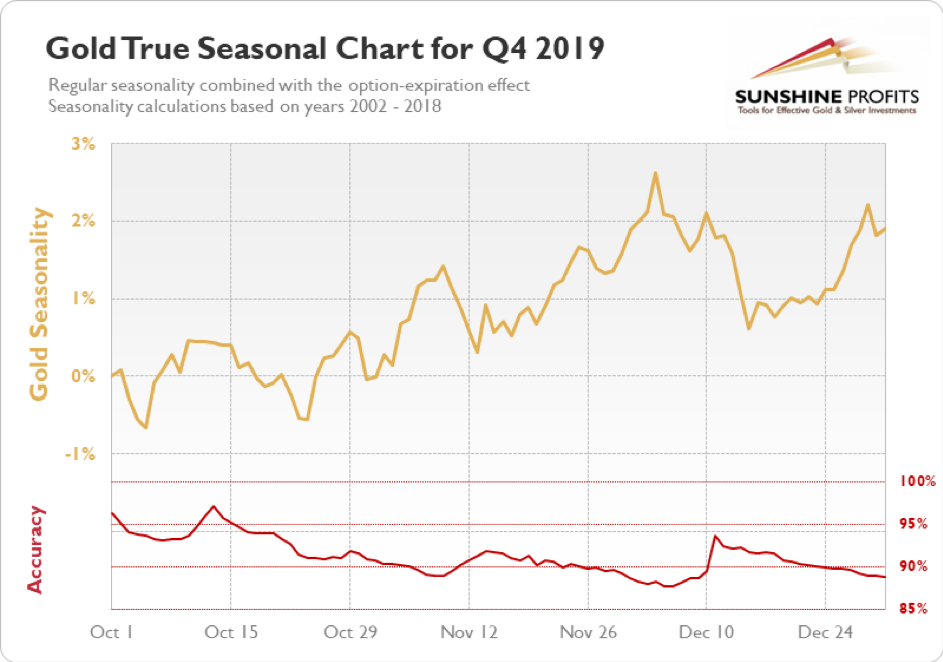
Gold's seasonal patterns confirm what we see on the silver seasonal chart - the part of the month that supported lower silver prices, has just ended.
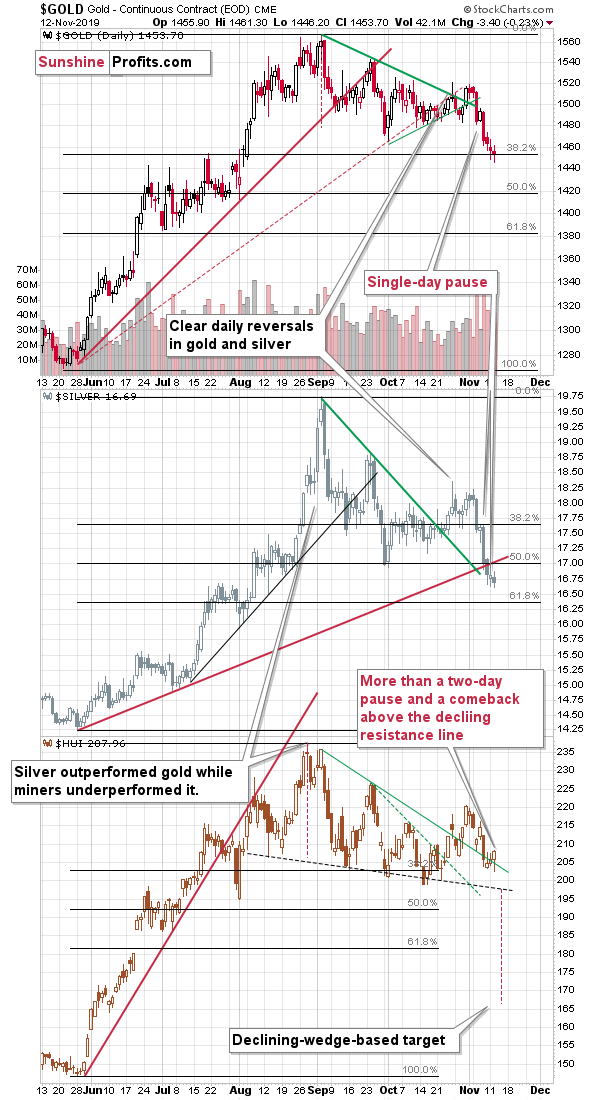
Gold confirmed the breakdown below the September lows, which is a very bearish sign for the following weeks and months. On a short-term note, however, we also need to take into account the fact that gold failed to break below the 38.2% Fibonacci retracement level and the July high. This support might be what triggers a very short-term reversal, even though the $1,415 level seemed more likely to do so before yesterday's price movements.
Please note that a rebound from here would be in tune with what we saw in 2011 and 2012 - we discussed it more thoroughly earlier this month, so we don't want to get into details once again today - if you joined us recently, we strongly encourage you to click the above link for details.
The final confirmation of the bullish outlook for the short term came from the mining stocks. Gold miners were supposed to decline based on the analogy to how they paused (for two days) earlier this month. Nothing like that happened and instead, the HUI Index moved higher after attempting to decline. That's bullish on its own even without discussing the level at which it closed. And it closed back above the declining green resistance line. This breakout is unlikely to change the medium-term outlook (which remains bearish), but it might be enough to trigger a short-term upswing.
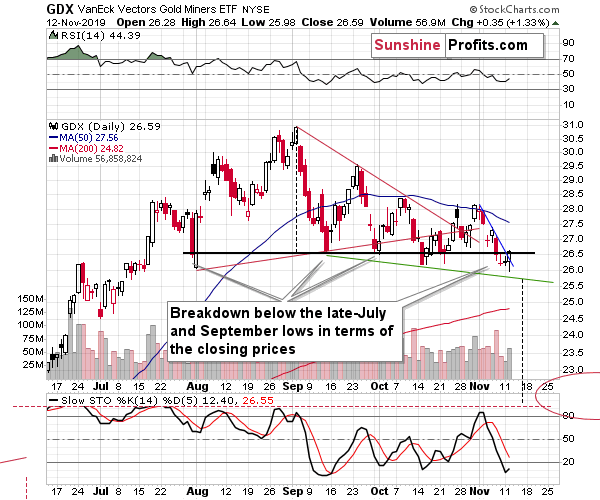
The GDX ETF - another proxy for the mining stocks - just broke above its very short-term declining resistance line. This doesn't change anything with regard to the medium term, but it is a bullish sign for the short term.
To be clear, if the mining stocks' strength was the only bullish thing that we see right now, it would probably not change much (perhaps we would just limit the size of the short position). However, there are bullish signs coming from gold and silver as well.
Besides, the USD Index appears that it needs a breather as well.
The Pausing USD Index
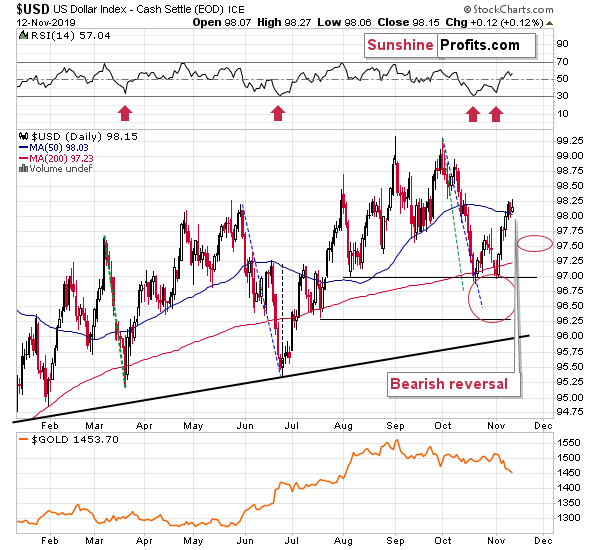
Why? Because it just formed a bearish shooting star candlestick - one of the common reversal patterns. The green and blue dashed lines represent declines that are similar to the October decline. The rallies that followed them were quite sharp, but they too had smaller pauses within them. Both: March-April, and July rallies consolidated after the USDX moved above its 50-day moving average. This happened recently and the reversal shooing star suggests that the time for the corrective downswing is here.
At the same time, it seems that we are seeing a quick shift in the gold-USD dynamics. Gold recently managed to decline regardless of USD's daily show of strength or weakness, but this seems to be changing today. The USDX is up by less than 0.1%, which should theoretically make gold drop at least somewhat. Instead, gold is more than 0.5% higher so far today.
Both: USD's possible short-term decline, and the temporary change in the gold-USD link point to higher gold prices in the near term (perhaps until the end of the month or so).
Naturally, the key bearish factors for the medium term remain intact - the outlook became bullish only for the short term.
Key Factors to Keep in Mind
Critical factors:
- The USD Index broke above the very long-term resistance line and verified the breakout above it. Its huge upswing is already underway.
- The USD's long-term upswing is an extremely important and bearish factor for gold. There were only two similar cases in the past few decades, when USD Index was starting profound, long-term bull markets, and they were both accompanied by huge declines in gold and the rest of the precious metals market
- Out of these two similar cases, only one is very similar - the case when gold topped in February 1996. The similarity extends beyond gold's about a yearly delay in reaction to the USD's rally. Also the shape of gold price moves prior to the 1996 high and what we saw in the last couple of years is very similar, which confirm the analysis of the gold-USD link and the above-mentioned implications of USD Index's long-term breakout.
- The similarity between now and 1996 extends to silver and mining stocks - in other words, it goes beyond USD, gold-USD link, and gold itself. The white metal and its miners appear to be in a similar position as well, and the implications are particularly bearish for the miners. After their 1996 top, they erased more than 2/3rds of their prices.
- Many investors got excited by the gold-is-soaring theme in the last few months, but looking beyond the short-term moves, reveals that most of the precious metals sector didn't show substantial strength that would be really visible from the long-term perspective. Gold doesn't appear to be starting a new bull market here, but rather to be an exception from the rule.
- Gold stocks appear to be repeating their performance from 20 years ago, which means that a bottom in the entire precious metals sector is quite likely to form at much lower prices, in about a year
Very important, but not as critical factors:
- Long-term technical signs for silver, i.a. the analogy in terms of price to what we saw in 2008, shows that silver could slide even below $10.
- Silver's very long-term cycles point to a major reversal taking place right now and since the most recent move was up, the implications are bearish (this is also silver's technical sign, but it's so important that it deserves its own point)
- Long-term technical signs for gold stocks point to this not being a new gold bull market beginning. Among others, it's their long-term underperformance relative to gold that hint this is rather a corrective upswing within a bear market that is not over yet.
- Record-breaking weekly volume in gold is a strong sign pointing to lower gold prices
Important factors:
- Extreme volume reading in the SIL ETF (proxy for silver stocks) is an effective indication that lower values of silver miners are to be expected
- Silver's short-term outperformance of gold, and gold stocks' short-term underperformance of gold both confirm that the precious metals sector is topping here
- Gold topped almost right at its cyclical turning point, which makes the trend reversal more likely
- Copper broke below its head-and-shoulders pattern and confirmed the breakdown. The last time we saw something similar was in April 2013, when the entire precious metals sector was on the verge of plunging lower.
Moreover, please note that while there may be a recession threat, it doesn't mean that gold has to rally immediately. Both: recession and gold's multi-year rally could be many months away - comparing what happened to bond yields in the 90s confirms that.
Summary
Summing up, the outlook for the precious metals sector remains very bearish for the following months, but it seems that we will first see a short-term upswing before the decline continues.
We previously wrote that it seemed that the next opportunity to take profits from the short positions and perhaps enter long ones, will take place next month, quite likely close to $1,400 in gold. However, we also stated that if we saw a good chance for a quick and sizable rebound even before that, we might adjust our trading positions accordingly. That's exactly what happened. We expect to close the current long position relatively soon and open another short position at that time - so that we're once again positioned to gain from the main trend, which remains down.
As always, we'll keep you - our subscribers - informed.
To summarize:
Trading capital (supplementary part of the portfolio; our opinion): Small speculative long position (50% of the full position) in gold, silver, and mining stocks is justified from the risk/reward perspective with the following stop-loss orders and binding exit profit-take price levels:
- Gold: profit-take exit price: $1,489.80; stop-loss: $1,437; initial target price for the UGLD ETN: $135.88; stop-loss for the UGLD ETN: $122.10
- Silver: profit-take exit price: $17.47; stop-loss: $16.27; initial target price for the USLV ETN: $89.33; stop-loss for the USLV ETN: $72.44
- Mining stocks (price levels for the GDX ETF): profit-take exit price: $27.88; stop-loss: $25.47; initial target price for the NUGT ETF: $30.27; stop-loss for the NUGT ETF $23.08
In case one wants to bet on junior mining stocks' prices, here are the stop-loss details and target prices:
- GDXJ ETF: profit-take exit price: $39.27; stop-loss: $35.38
- JNUG ETF: profit-take exit price: $67.97; stop-loss: $49.83
Long-term capital (core part of the portfolio; our opinion): No positions (in other words: cash)
Insurance capital (core part of the portfolio; our opinion): Full position
Whether you already subscribed or not, we encourage you to find out how to make the most of our alerts and read our replies to the most common alert-and-gold-trading-related-questions.
Please note that the in the trading section we describe the situation for the day that the alert is posted. In other words, it we are writing about a speculative position, it means that it is up-to-date on the day it was posted. We are also featuring the initial target prices, so that you can decide whether keeping a position on a given day is something that is in tune with your approach (some moves are too small for medium-term traders and some might appear too big for day-traders).
Plus, you might want to read why our stop-loss orders are usually relatively far from the current price.
Please note that a full position doesn't mean using all of the capital for a given trade. You will find details on our thoughts on gold portfolio structuring in the Key Insights section on our website.
As a reminder - "initial target price" means exactly that - an "initial" one, it's not a price level at which we suggest closing positions. If this becomes the case (like it did in the previous trade) we will refer to these levels as levels of exit orders (exactly as we've done previously). Stop-loss levels, however, are naturally not "initial", but something that, in our opinion, might be entered as an order.
Since it is impossible to synchronize target prices and stop-loss levels for all the ETFs and ETNs with the main markets that we provide these levels for (gold, silver and mining stocks - the GDX ETF), the stop-loss levels and target prices for other ETNs and ETF (among other: UGLD, DGLD, USLV, DSLV, NUGT, DUST, JNUG, JDST) are provided as supplementary, and not as "final". This means that if a stop-loss or a target level is reached for any of the "additional instruments" (DGLD for instance), but not for the "main instrument" (gold in this case), we will view positions in both gold and DGLD as still open and the stop-loss for DGLD would have to be moved lower. On the other hand, if gold moves to a stop-loss level but DGLD doesn't, then we will view both positions (in gold and DGLD) as closed. In other words, since it's not possible to be 100% certain that each related instrument moves to a given level when the underlying instrument does, we can't provide levels that would be binding. The levels that we do provide are our best estimate of the levels that will correspond to the levels in the underlying assets, but it will be the underlying assets that one will need to focus on regarding the signs pointing to closing a given position or keeping it open. We might adjust the levels in the "additional instruments" without adjusting the levels in the "main instruments", which will simply mean that we have improved our estimation of these levels, not that we changed our outlook on the markets. We are already working on a tool that would update these levels on a daily basis for the most popular ETFs, ETNs and individual mining stocks.
Our preferred ways to invest in and to trade gold along with the reasoning can be found in the how to buy gold section. Additionally, our preferred ETFs and ETNs can be found in our Gold & Silver ETF Ranking.
As a reminder, Gold & Silver Trading Alerts are posted before or on each trading day (we usually post them before the opening bell, but we don't promise doing that each day). If there's anything urgent, we will send you an additional small alert before posting the main one.
Thank you.
Sincerely,
Przemyslaw Radomski, CFA
Editor-in-chief, Gold & Silver Fund Manager

