

Briefly: in our opinion, full (250% of the regular size of the position) speculative short position in gold, silver, and mining stocks is justified from the risk/reward point of view at the moment of publishing this Alert.
In yesterday's analysis, we discussed gold stocks, and what they tell us about the upcoming year. They disclosed not only what's likely to happen in a year, but also they promised to let us know when there are going to be tradable opportunities suitable for betting on bigger corrections within the decline. Gold stocks are not the only mining stocks that can provide us with valuable info, though. Silver miners, please step forward.
Actually, they are making one major claim, but they justify it twofold.
The claim is that the 2019 upswing was not the beginning of a major rally and the two ways in which it's justified is through comparison to the previous major rallies, and through silver miners' relative performance to silver.
Silver Miners in Focus
Starting with the latter, just like gold stocks tend to indicate where gold is going to move, silver stocks can do the same thing for silver. And since gold and silver are likely to move together anyway, silver stocks might indicate something about gold too.
The link between silver stocks and silver is not as effective as the one between gold stocks and gold, which explains why it's not as popular (and rightfully so). Still, just because it's not as effective as the latter, it doesn't mean it's useless. It can still provide valuable confirmations, especially if a different metric tells the same story.
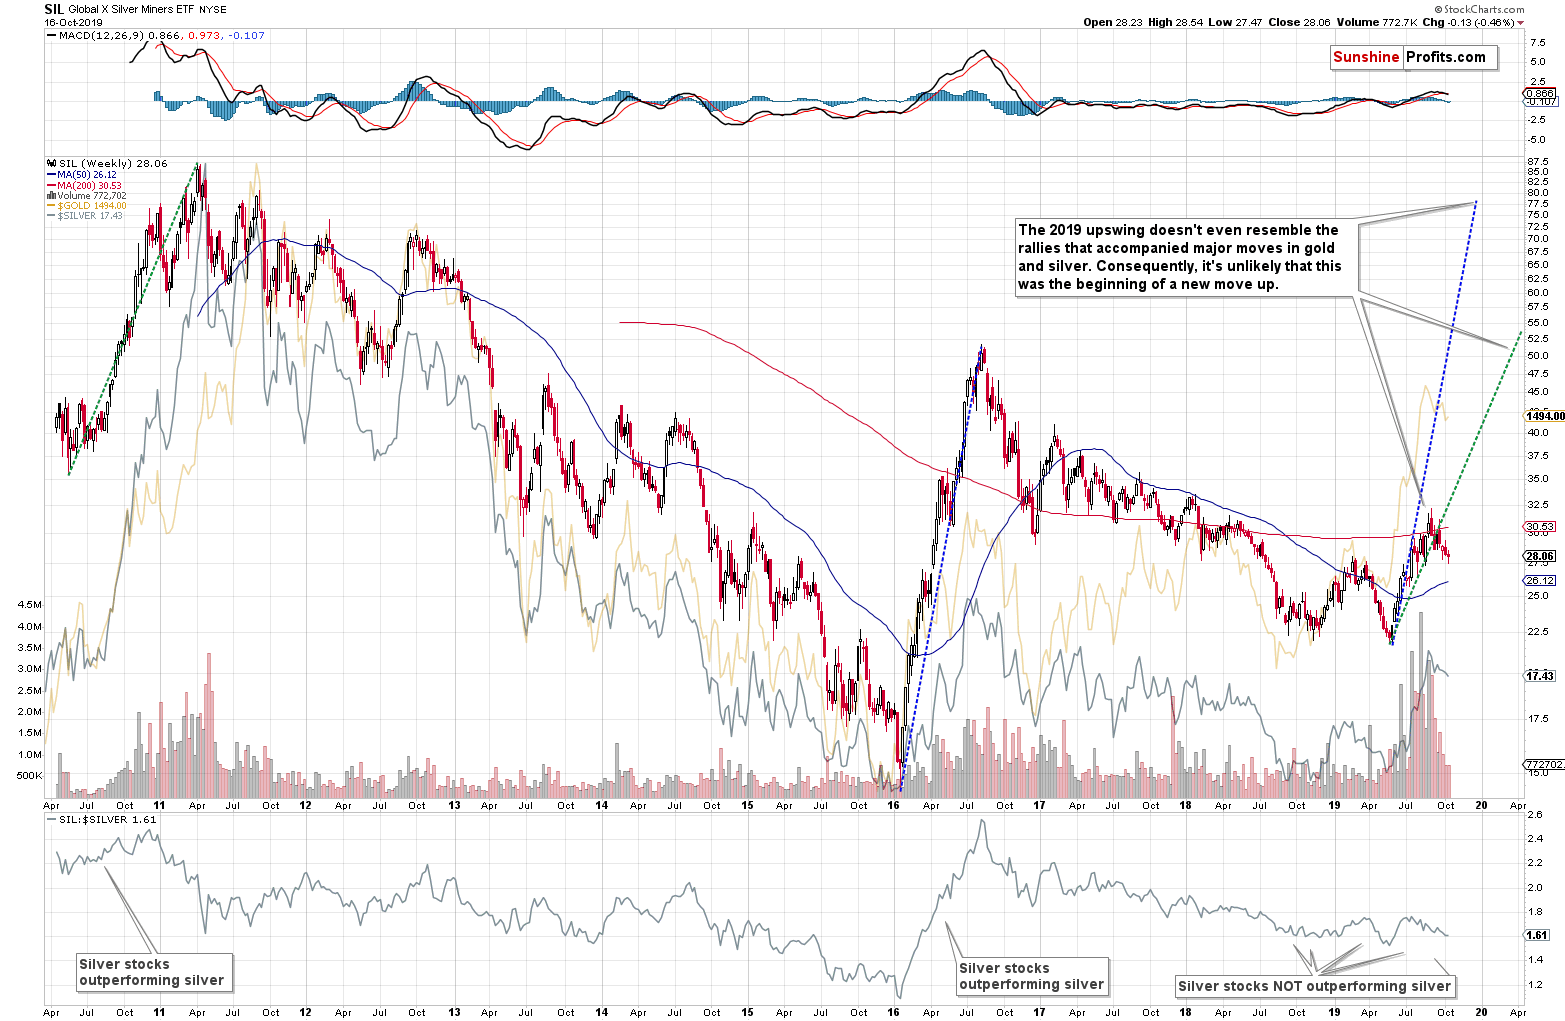
The lower part of the above chart shows the SIL to silver ratio. The SIL ETF is a proxy for the silver mining stocks, so this ratio tells us if silver miners have been outperforming silver (rallying ratio) or underperforming (declining ratio).
There were two major gold and silver rallies in the past several years (not counting this year's rally in gold as that's what we're trying to verify in this analysis). The first took place in 2010 and 2011 and the second one took place in 2016. In both cases, especially in the latter one, we saw a visible rally in the ratio. Silver miners rallied more than silver.
Was this the case since the recent rally in gold and silver started (late 2018)?
No. There was some back and forth movement in the ratio, but overall the ratio is trading at its 2018 lows right now and below what we saw in 2017. What does it mean? It means that what we saw in the previous months has most likely not been the start of a new massive bull market in the precious metals sector, but rather a prolonged (especially in case of gold) corrective upswing.
The confirmation of the above conclusion is even clearer than its indication. Let's take a look at the sizes of rallies in the SIL ETF itself. We marked the 2010 - 2011 rally with green, and we marked the 2016 rally with blue, and we copied these lines to the most recent medium-term bottom. It's obvious that the 2018 - 2019 rally is not even close to being comparable to these moves in terms of size.
Measuring from the bottom to the top, SIL recently gained about 50% (before declining again).
Between the 2010 bottom and the 2011 top, SIL had gained about 150%.
In 2016, SIL had gained about 250%.
One can say that silver had previously rallied more than it did in 2019, and they would be correct. This doesn't invalidate the above comparison or its implications, though. The 2010-2011 rally was the final part of the bull market, and one can expect silver miners to underperform close to its end. The 2016 rally, however, looked to be the start of a major upswing... And it wasn't as a large part of the rally was given away in the following months. What's important for the sake of this comparison, is that silver rallied about 50% in 2016, so SIL gained about 5 times more. This year, silver rallied a bit less than 40%, and SIL didn't even gain twice as much.
The recent developments on the precious metals market may resemble the beginning of a new bull market, especially if one focuses on gold, but the reality is much more complex than that. It is only gold that seems to have rallied and that's not enough of a proof that the bull market in the entire sector has begun.
Isn't it possible that gold is already in a major bull market, but the rest of the precious metals market isn't? Of course, almost everything is possible in the markets (hey, we have negative interest rates in some parts of the world, and who would have thought about this possibility 20 years ago?). It's highly unlikely, though. In today's globalized economy, it's rare that one market can move entirely on its own and given gold's close ties with silver and mining stocks, it doesn't appear to be a good idea to bet on gold's total independence.
Besides, even despite yesterday's daily upswing, gold confirmed its move back below $1,500.
Yesterday's Action in PMs
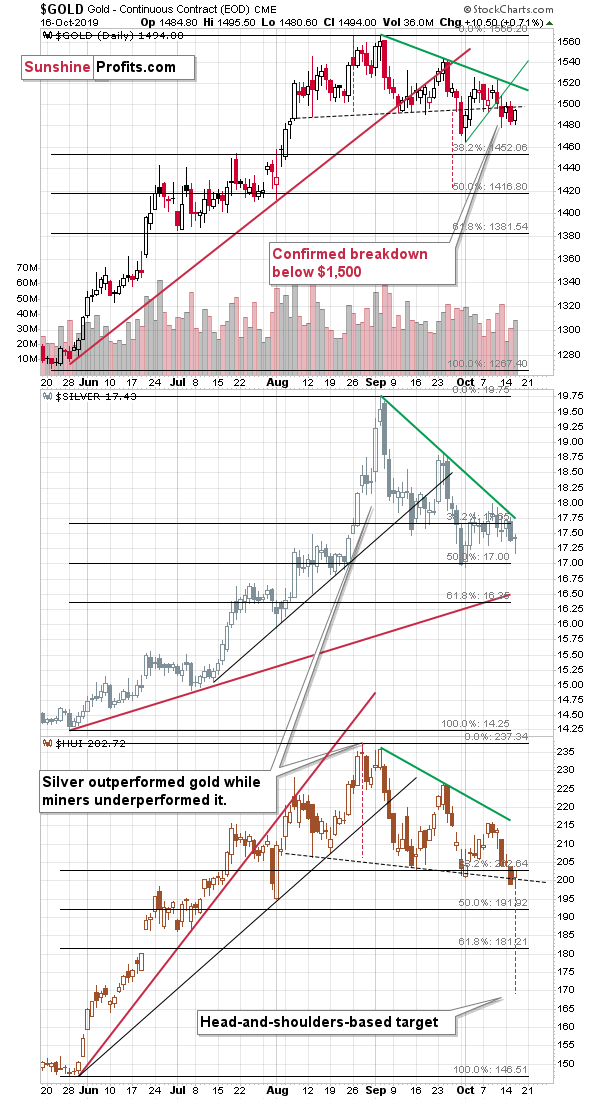
The close below both: $1,500 level and the rising neck" line of the previous head-and-shoulders pattern is a bearish development.
Silver's intraday reversal might appear bullish, and the same goes for the rally in HUI Index - proxy for gold miners. "Might appear" but not necessarily "is" bullish. Despite the reversal, silver didn't end the day visibly higher. While gold stocks closed the day higher, and back above the declining dashed line, they also closed it practically right at the 38.2% Fibonacci retracement level. The breakdown below it was therefore not invalidated.
Overall, yesterday's price action in gold was bearish, but slightly bullish in case of silver and mining stocks. But that was also the day, when the USD Index declined visibly.
The USD Index Takes a Hit
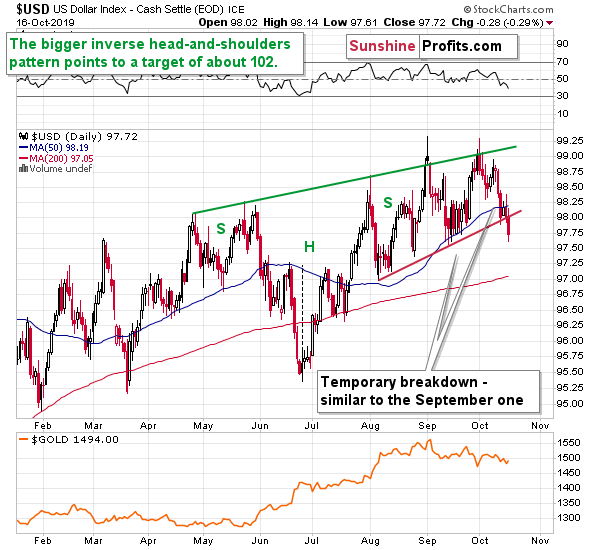
On such a day, the bullish reaction in gold, silver, and miners should have been much more profound. And instead of rallying visibly higher, gold was unable to even get back above $1,500. In light of USD's decline, the rally in miners seems rather insignificant and might be even viewed as bearish instead of being bullish. Silver didn't rally, so it might be also viewed as bearish as it refused to react to a bullish signal.
Consequently, it doesn't seem that anything changed regarding the medium- and short-term outlook. They both remain bearish.
Naturally, the key bearish factors for the medium term remain intact.
Key Factors to Keep in Mind
Critical factors:
- The USD Index broke above the very long-term resistance line and verified the breakout above it. Its huge upswing is already underway.
- The USD's long-term upswing is an extremely important and bearish factor for gold. There were only two similar cases in the past few decades, when USD Index was starting profound, long-term bull markets, and they were both accompanied by huge declines in gold and the rest of the precious metals market
- Out of these two similar cases, only one is very similar - the case when gold topped in February 1996. The similarity extends beyond gold's about a yearly delay in reaction to the USD's rally. Also the shape of gold price moves prior to the 1996 high and what we saw in the last couple of years is very similar, which confirm the analysis of the gold-USD link and the above-mentioned implications of USD Index's long-term breakout.
- The similarity between now and 1996 extends to silver and mining stocks - in other words, it goes beyond USD, gold-USD link, and gold itself. The white metal and its miners appear to be in a similar position as well, and the implications are particularly bearish for the miners. After their 1996 top, they erased more than 2/3rds of their prices.
- Many investors got excited by the gold-is-soaring theme in the last few months, but looking beyond the short-term moves, reveals that most of the precious metals sector didn't show substantial strength that would be really visible from the long-term perspective. Gold doesn't appear to be starting a new bull market here, but rather to be an exception from the rule.
- Gold stocks appear to be repeating their performance from 20 years ago, which means that a bottom in the entire precious metals sector is quite likely to form at much lower prices, in about a year
Very important, but not as critical factors:
- Long-term technical signs for silver, i.a. the analogy in terms of price to what we saw in 2008, shows that silver could slide even below $10.
- Silver's very long-term cycles point to a major reversal taking place right now and since the most recent move was up, the implications are bearish (this is also silver's technical sign, but it's so important that it deserves its own point)
- Long-term technical signs for gold stocks point to this not being a new gold bull market beginning. Among others, it's their long-term underperformance relative to gold that hint this is rather a corrective upswing within a bear market that is not over yet.
- Record-breaking weekly volume in gold is a strong sign pointing to lower gold prices
Important factors:
- Extreme volume reading in the SIL ETF (proxy for silver stocks) is an effective indication that lower values of silver miners are to be expected
- Silver's short-term outperformance of gold, and gold stocks' short-term underperformance of gold both confirm that the precious metals sector is topping here
- Gold topped almost right at its cyclical turning point, which makes the trend reversal more likely
- Copper broke below its head-and-shoulders pattern and confirmed the breakdown. The last time we saw something similar was in April 2013, when the entire precious metals sector was on the verge of plunging lower.
Moreover, please note that while there may be a recession threat, it doesn't mean that gold has to rally immediately. Both: recession and gold's multi-year rally could be many months away - comparing what happened to bond yields in the 90s confirms that.
Copper moved above the neck level of its head-and-shoulders pattern that's based on the intraday lows, but it didn't invalidate the analogous level based on the weekly closing prices, so we don't think it's justified to say that this bearish formation was invalidated at this time.
Summary
Summing up, it seems that the corrective upswing in gold is over and that the yellow metal's big decline is already underway (and that it had started in August as we had written previously). The weak performance of gold miners and silver miners confirms the bearish outlook. The similarity to how gold stocks rallied and then declined about 20 years ago provides us with a specific time target for the decline in the entire precious metals sector - it's likely to take place for about 1 year from now. That's not particularly close, but the road lower that gold, silver, and miners are likely to take is not short either. The profits from the short position in gold, silver and mining stocks are likely to be legendary, but the difficult part is not to miss the decline. Fortunately, the pace of decline that we saw 20 years ago provides suggestions regarding when it might be worth to bet on the corrective upswing with one's trading capital and when it's better to wait it out. Based on the analogy to the above-mentioned decline, the next medium-term bottom might take place in about 2 months, in mid-December.
As always, we'll keep you - our subscribers - informed.
To summarize:
Trading capital (supplementary part of the portfolio; our opinion): Full speculative short position (250% of the full position) in gold, silver, and mining stocks are justified from the risk/reward perspective with the following stop-loss orders and binding exit profit-take price levels:
- Gold: profit-take exit price: $1,391; stop-loss: $1,573; initial target price for the DGLD ETN: $36.37; stop-loss for the DGLD ETN: $25.44
- Silver: profit-take exit price: $15.11; stop-loss: $19.06; initial target price for the DSLV ETN: $24.88; stop-loss for the DSLV ETN: $14.07
- Mining stocks (price levels for the GDX ETF): profit-take exit price: $23.21; stop-loss: $30.11; initial target price for the DUST ETF: $11.69; stop-loss for the DUST ETF $6.08
In case one wants to bet on junior mining stocks' prices, here are the stop-loss details and target prices:
- GDXJ ETF: profit-take exit price: $31.62; stop-loss: $41.22
- JDST ETF: profit-take exit price: $24.88 stop-loss: $12.46
Long-term capital (core part of the portfolio; our opinion): No positions (in other words: cash)
Insurance capital (core part of the portfolio; our opinion): Full position
Whether you already subscribed or not, we encourage you to find out how to make the most of our alerts and read our replies to the most common alert-and-gold-trading-related-questions.
Please note that the in the trading section we describe the situation for the day that the alert is posted. In other words, it we are writing about a speculative position, it means that it is up-to-date on the day it was posted. We are also featuring the initial target prices, so that you can decide whether keeping a position on a given day is something that is in tune with your approach (some moves are too small for medium-term traders and some might appear too big for day-traders).
Plus, you might want to read why our stop-loss orders are usually relatively far from the current price.
Please note that a full position doesn't mean using all of the capital for a given trade. You will find details on our thoughts on gold portfolio structuring in the Key Insights section on our website.
As a reminder - "initial target price" means exactly that - an "initial" one, it's not a price level at which we suggest closing positions. If this becomes the case (like it did in the previous trade) we will refer to these levels as levels of exit orders (exactly as we've done previously). Stop-loss levels, however, are naturally not "initial", but something that, in our opinion, might be entered as an order.
Since it is impossible to synchronize target prices and stop-loss levels for all the ETFs and ETNs with the main markets that we provide these levels for (gold, silver and mining stocks - the GDX ETF), the stop-loss levels and target prices for other ETNs and ETF (among other: UGLD, DGLD, USLV, DSLV, NUGT, DUST, JNUG, JDST) are provided as supplementary, and not as "final". This means that if a stop-loss or a target level is reached for any of the "additional instruments" (DGLD for instance), but not for the "main instrument" (gold in this case), we will view positions in both gold and DGLD as still open and the stop-loss for DGLD would have to be moved lower. On the other hand, if gold moves to a stop-loss level but DGLD doesn't, then we will view both positions (in gold and DGLD) as closed. In other words, since it's not possible to be 100% certain that each related instrument moves to a given level when the underlying instrument does, we can't provide levels that would be binding. The levels that we do provide are our best estimate of the levels that will correspond to the levels in the underlying assets, but it will be the underlying assets that one will need to focus on regarding the signs pointing to closing a given position or keeping it open. We might adjust the levels in the "additional instruments" without adjusting the levels in the "main instruments", which will simply mean that we have improved our estimation of these levels, not that we changed our outlook on the markets. We are already working on a tool that would update these levels on a daily basis for the most popular ETFs, ETNs and individual mining stocks.
Our preferred ways to invest in and to trade gold along with the reasoning can be found in the how to buy gold section. Additionally, our preferred ETFs and ETNs can be found in our Gold & Silver ETF Ranking.
As a reminder, Gold & Silver Trading Alerts are posted before or on each trading day (we usually post them before the opening bell, but we don't promise doing that each day). If there's anything urgent, we will send you an additional small alert before posting the main one.
=====
Latest Free Trading Alerts:
3 percent - that's the new IMF global growth forecast for 2019. It's the lowest one since the Great Financial Crisis. Is the much talked about recession coming? And what about the just reached Brexit deal? Can they both make gold rally?
Will Sputtering Global Growth and the Just-Announced Brexit Deal Support Gold?
=====
Thank you.
Sincerely,
Przemyslaw Radomski, CFA
Editor-in-chief, Gold & Silver Fund Manager

