

Briefly: in our opinion, full (250% of the regular size of the position) speculative short position in gold, silver, and mining stocks is justified from the risk/reward point of view at the moment of publishing this Alert.
Would you like to invest in platinum?
"What? Why platinum?" - you'd probably ask back. And correctly so, this shiny metal has been declining in the previous years and only recently did it show some decent strength. And this may not sound important at all if you're only considering investing in gold, silver, or mining stocks (like most precious metals investors) or are already holding them, but it actually is.
In the interconnected and globalized economy there are very few (if any) assets that can move totally on their own. In particular, we can see similarities in movement of assets from the same sector. Like gold and silver. And - in some cases - platinum.
This means that at times, looking at platinum can tell us something not only about the little silver (that's what platina actually means), but about the rest of the precious metals sector. This appears to be the case right now.
What does the platinum chart say in general?
Platinum in Focus
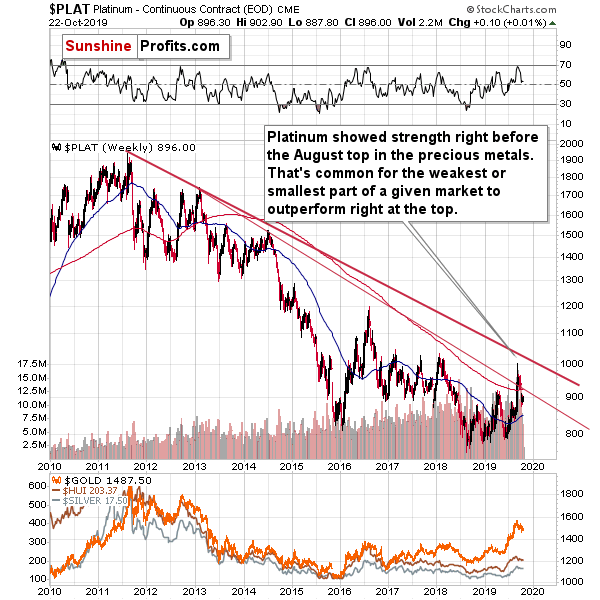
It's emphasizing how strongly platinum rallied in previous months... After being so weak in the previous years. The long-term trend remains down as platinum didn't break above the rising red resistance lines - the attempt to move above the lower one was invalidated. On a short-term basis, the rally was noticeable to say the least. What does it suggest?
It doesn't suggest anything per se, but once we combine it with two details, it becomes important.
The first detail is that any market that is generally weak, but then acts strong at a certain time, might simply be rallying just because everything is rallying as the investment public (that enters the market last and buys close to the top) is buying everything without looking at its potential. And in particular if something looks cheaper than something else (e.g. because it was declining previously or precisely because it has unfavorable fundamentals). This means that just by looking at the performance of the weak parts of a given market one can detect the moment, when the investment public is entering the fray, and thus that the top is being formed.
The second detail is that platinum is currently the weakest part of the precious metals sector and this perfectly fits the above-mentioned type of reaction. The size of the platinum market is also relatively small. The fundamental situation for platinum is rather grim as it's being used as a catalyst for diesel car engines that are no longer as often produced as in the past. Gasoline engines are growing in popularity relative to the former and in their case, palladium is used. Both could be hit when electric cars start to take over the market, but that's something that will take many years. The fundamental outlook is one source of information and the technical situation is another one.
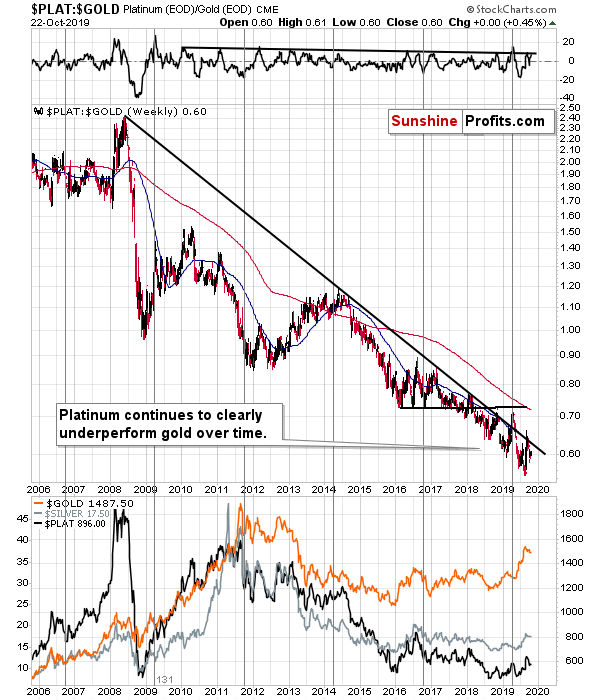
The technicals perfectly confirm the fundamentals. Platinum has been continuously underperforming gold despite local rallies. There were attempts to break above the declining long-term resistance line, but they all failed. The value of the ROC indicator in the upper part of the chart just reached its resistance line, which suggests that another downturn is likely. Simply put, the outlook for the platinum to gold ratio and platinum itself looks very unfavorable.
This, plus the simple fact that platinum seems cheap compared to gold makes it perfectly fit the situation described previously. Platinum is the weakest part of the precious metals sector and it had recently rallied.
This means that the precious metals investment public has likely entered the market in August - when platinum outperformed and topped. And what does it signal for gold and the rest of the PMs? This means that the major top was most likely formed not just in platinum, but in the entire precious metals market, as that's the market most closely related to platinum.
All in all, even if you're not interested in investing in platinum (and likely rightfully so), it's worth paying attention to what this white metal is doing. It recently suggested that a medium-term top formed and that lower prices across the precious metals board are to be expected. This is yet another warning sign for the precious metals bulls. Surely, there will most likely be times when gold and silver are trading well above their 2011 highs, but it's unlikely to take place before we see a big decline first.
As you know, there are myriads of other confirmations - we've been linking to them in the previous weeks and we will link to them also today. There is one more factor that we would like to discuss more thoroughly today. It's silver's monthly volume.
Turning to Silver
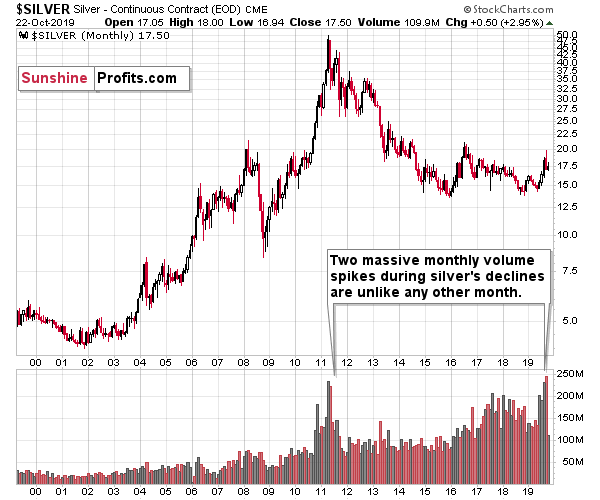
There is an obvious similarity between last month's extreme volume and what we saw in 2011 right after the top. There are no other cases, when silver would decline on such a huge volume. As you know, history tends to repeat itself, so this huge-volume decline and the analogy should not be ignored.
If this single month in 2011 marked the start of a decline that would make silver decline in value more than 3 times, then it's something that one definitely wants to pay attention to. While we're not saying that silver is likely to decline below $7 after topping at about $20, let's keep in mind that a huge decline is likely to take place, anyway. After all, in 2008 silver started from similar levels and it moved below $10 just several months later...
On a very short-term basis, nothing practically changed, so we have very little to say regarding the daily chart of gold, silver, and mining stocks.
Short-Term Check on PMs
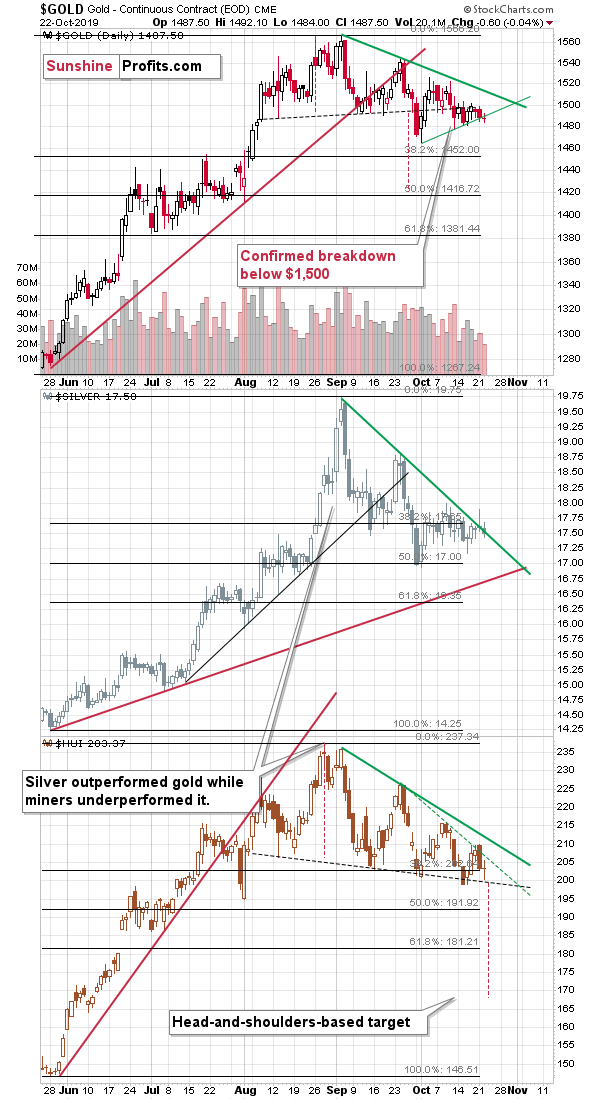
Gold closed a bit below the rising support line, but the size of the breakdown was too small to be viewed as anything significant.
The key thing is that gold remains below $1,500 and no resistance line was broken in any meaningful way. The short-term trend remains down, just as the medium-term trend does.
Naturally, the other key bearish factors for the medium term remain intact.
Key Factors to Keep in Mind
Critical factors:
- The USD Index broke above the very long-term resistance line and verified the breakout above it. Its huge upswing is already underway.
- The USD's long-term upswing is an extremely important and bearish factor for gold. There were only two similar cases in the past few decades, when USD Index was starting profound, long-term bull markets, and they were both accompanied by huge declines in gold and the rest of the precious metals market
- Out of these two similar cases, only one is very similar - the case when gold topped in February 1996. The similarity extends beyond gold's about a yearly delay in reaction to the USD's rally. Also the shape of gold price moves prior to the 1996 high and what we saw in the last couple of years is very similar, which confirm the analysis of the gold-USD link and the above-mentioned implications of USD Index's long-term breakout.
- The similarity between now and 1996 extends to silver and mining stocks - in other words, it goes beyond USD, gold-USD link, and gold itself. The white metal and its miners appear to be in a similar position as well, and the implications are particularly bearish for the miners. After their 1996 top, they erased more than 2/3rds of their prices.
- Many investors got excited by the gold-is-soaring theme in the last few months, but looking beyond the short-term moves, reveals that most of the precious metals sector didn't show substantial strength that would be really visible from the long-term perspective. Gold doesn't appear to be starting a new bull market here, but rather to be an exception from the rule.
- Gold stocks appear to be repeating their performance from 20 years ago, which means that a bottom in the entire precious metals sector is quite likely to form at much lower prices, in about a year
Very important, but not as critical factors:
- Long-term technical signs for silver, i.a. the analogy in terms of price to what we saw in 2008, shows that silver could slide even below $10.
- Silver's very long-term cycles point to a major reversal taking place right now and since the most recent move was up, the implications are bearish (this is also silver's technical sign, but it's so important that it deserves its own point)
- Long-term technical signs for gold stocks point to this not being a new gold bull market beginning. Among others, it's their long-term underperformance relative to gold that hint this is rather a corrective upswing within a bear market that is not over yet.
- Record-breaking weekly volume in gold is a strong sign pointing to lower gold prices
Important factors:
- Extreme volume reading in the SIL ETF (proxy for silver stocks) is an effective indication that lower values of silver miners are to be expected
- Silver's short-term outperformance of gold, and gold stocks' short-term underperformance of gold both confirm that the precious metals sector is topping here
- Gold topped almost right at its cyclical turning point, which makes the trend reversal more likely
- Copper broke below its head-and-shoulders pattern and confirmed the breakdown. The last time we saw something similar was in April 2013, when the entire precious metals sector was on the verge of plunging lower.
Moreover, please note that while there may be a recession threat, it doesn't mean that gold has to rally immediately. Both: recession and gold's multi-year rally could be many months away - comparing what happened to bond yields in the 90s confirms that.
Summary
Summing up, it seems that the corrective upswing in gold is over and that the yellow metal's big decline is already underway (and that it had started in August as we had written previously), resuming shortly. The similarity to how gold stocks rallied and then declined about 20 years ago provides us with a specific time target for the decline in the entire precious metals sector - it's likely to take place for about 1 year from now. That's not particularly close, but the road lower that gold, silver, and miners are likely to take is not short either. The profits from the short position in gold, silver and mining stocks are likely to be legendary, but the difficult part is not to miss the decline. Fortunately, the slide's pace that we saw 20 years ago provides suggestions regarding when it might be worth to bet on the corrective upswing with one's trading capital and when it's better to wait it out. Based on the analogy to the above-mentioned decline, the next medium-term bottom might take place in about 2 months, in mid-December. There are additional indications pointing to a short-term reversal (likely a bottom) in early November.
At this time, it's unclear whether the target prices that we feature below are going to be reached in early November, mid-December or sometime between those dates. It seems much more likely than not that we won't have to wait beyond mid-December for the targets to be reached. The above-mentioned reversal dates are useful guidelines, but they are not clear rules. For instance, the bottom could take place at another date, and the reversal might actually mark the end of the corrective post-local-bottom upswing.
As always, we'll keep you - our subscribers - informed.
To summarize:
Trading capital (supplementary part of the portfolio; our opinion): F speculative short position (250% of the full position) in gold, silver, and mining stocks are justified from the risk/reward perspective with the following stop-loss orders and binding exit profit-take price levels:
- Gold: profit-take exit price: $1,391; stop-loss: $1,573; initial target price for the DGLD ETN: $36.37; stop-loss for the DGLD ETN: $25.44
- Silver: profit-take exit price: $15.11; stop-loss: $19.06; initial target price for the DSLV ETN: $24.88; stop-loss for the DSLV ETN: $14.07
- Mining stocks (price levels for the GDX ETF): profit-take exit price: $23.21; stop-loss: $30.11; initial target price for the DUST ETF: $11.69; stop-loss for the DUST ETF $6.08
In case one wants to bet on junior mining stocks' prices, here are the stop-loss details and target prices:
- GDXJ ETF: profit-take exit price: $31.62; stop-loss: $41.22
- JDST ETF: profit-take exit price: $24.88 stop-loss: $12.46
Long-term capital (core part of the portfolio; our opinion): No positions (in other words: cash)
Insurance capital (core part of the portfolio; our opinion): Full position
Whether you already subscribed or not, we encourage you to find out how to make the most of our alerts and read our replies to the most common alert-and-gold-trading-related-questions.
Please note that the in the trading section we describe the situation for the day that the alert is posted. In other words, it we are writing about a speculative position, it means that it is up-to-date on the day it was posted. We are also featuring the initial target prices, so that you can decide whether keeping a position on a given day is something that is in tune with your approach (some moves are too small for medium-term traders and some might appear too big for day-traders).
Plus, you might want to read why our stop-loss orders are usually relatively far from the current price.
Please note that a full position doesn't mean using all of the capital for a given trade. You will find details on our thoughts on gold portfolio structuring in the Key Insights section on our website.
As a reminder - "initial target price" means exactly that - an "initial" one, it's not a price level at which we suggest closing positions. If this becomes the case (like it did in the previous trade) we will refer to these levels as levels of exit orders (exactly as we've done previously). Stop-loss levels, however, are naturally not "initial", but something that, in our opinion, might be entered as an order.
Since it is impossible to synchronize target prices and stop-loss levels for all the ETFs and ETNs with the main markets that we provide these levels for (gold, silver and mining stocks - the GDX ETF), the stop-loss levels and target prices for other ETNs and ETF (among other: UGLD, DGLD, USLV, DSLV, NUGT, DUST, JNUG, JDST) are provided as supplementary, and not as "final". This means that if a stop-loss or a target level is reached for any of the "additional instruments" (DGLD for instance), but not for the "main instrument" (gold in this case), we will view positions in both gold and DGLD as still open and the stop-loss for DGLD would have to be moved lower. On the other hand, if gold moves to a stop-loss level but DGLD doesn't, then we will view both positions (in gold and DGLD) as closed. In other words, since it's not possible to be 100% certain that each related instrument moves to a given level when the underlying instrument does, we can't provide levels that would be binding. The levels that we do provide are our best estimate of the levels that will correspond to the levels in the underlying assets, but it will be the underlying assets that one will need to focus on regarding the signs pointing to closing a given position or keeping it open. We might adjust the levels in the "additional instruments" without adjusting the levels in the "main instruments", which will simply mean that we have improved our estimation of these levels, not that we changed our outlook on the markets. We are already working on a tool that would update these levels on a daily basis for the most popular ETFs, ETNs and individual mining stocks.
Our preferred ways to invest in and to trade gold along with the reasoning can be found in the how to buy gold section. Additionally, our preferred ETFs and ETNs can be found in our Gold & Silver ETF Ranking.
As a reminder, Gold & Silver Trading Alerts are posted before or on each trading day (we usually post them before the opening bell, but we don't promise doing that each day). If there's anything urgent, we will send you an additional small alert before posting the main one.
=====
Latest Free Trading Alerts:
"What is the best predictor of future behavior? Past behavior." And while this certainly does not always hold, there is a lesson to be learned from this adage for gold investors. Yup, a saying about behavior might be important for the precious metals market. The basic idea is that behavior can be understood as history here. And so, the best predictor of future developments could be past developments. In other words, past developments might hold some indications as to the fluctuations in the market.
Gold's Seasonal Outlook for Q4
=====
Thank you.
Sincerely,
Przemyslaw Radomski, CFA
Editor-in-chief, Gold & Silver Fund Manager

