

Briefly: in our opinion, full (250% of the regular size of the position) speculative short position in gold, silver, and mining stocks is justified from the risk/reward point of view at the moment of publishing this Alert.
Gold price action in November 2019 is likely to take most investors by surprise. There are two ways in which gold is likely to move in the first part of the month. It could slide right away based on the triple triangle-vertex-based reversal patterns that we see in gold, silver, and gold miners. However, there's also the possibility that gold will rally along with the Japanese yen (as it often does) and move close to its late-September high. These two scenarios are interesting, but they are neither the most appealing, nor most important thing that we'll explain today.
In case of technical analysis, it is usually the case that one never asks the W question. There is no WHY in the technical analysis. Or more importantly, they usually don't matter. There are tens, if not hundreds, of news releases each day and markets can rally or decline on all or any of them. It's impossible to pay attention to everything that each market is doing (some analyses can help, though), and it all boils down to whether a given support or resistance was reached, whether the turning point or cycle is nearby, if we see an analogy to the past to any significant extent. In other words, there are multiple tips for trading gold that are not concerned about the WHY.
Today's analysis is different from other ones that we wrote recently. Today, we're going to focus on the why behind the two short-term scenarios from the opening paragraph. The reason is that the implications of the reply to the W question extend way beyond the next several days. These implications made us supplement the target prices for our trading position with additional details, making it much more short-term oriented, but even that's not the most important thing. The key implication is that based on the reply, the likelihood of seeing a major turnaround in October 2020, and its combination with True Seasonal patterns for gold, we adjusted the likely gold price path for the following 12 months.
Let's start with the tip of the analytical iceberg.
The Short-Term in the PMs
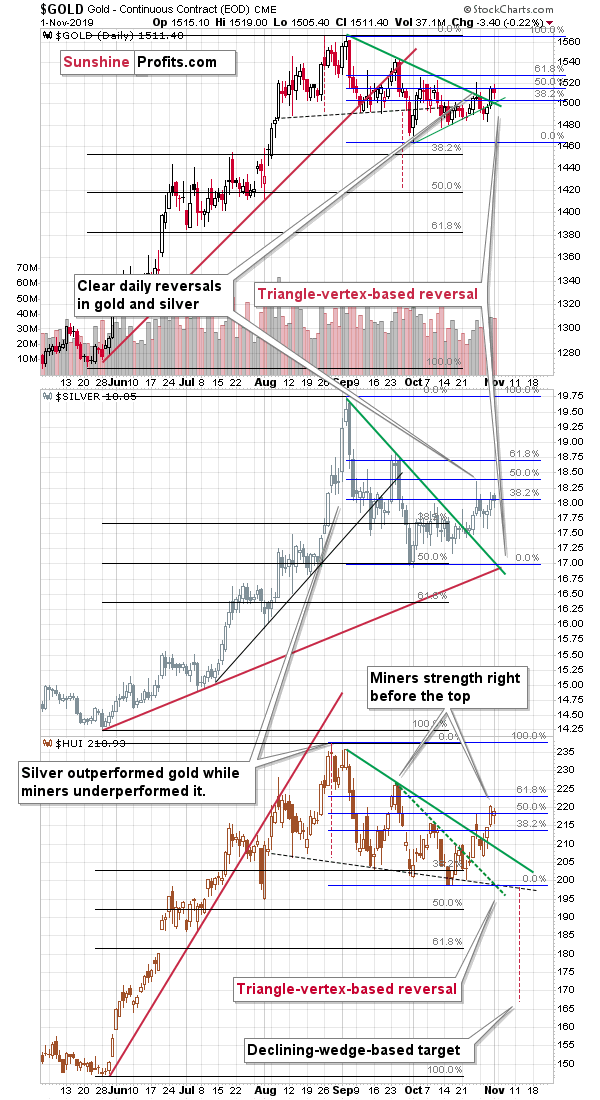
Gold broke above the declining green resistance line and is confirming the breakout right now. Just one more daily close above the green line (currently at about $1,500) will mean that the breakout is verified, making a short-term rally more likely. Gold stocks have already broken above their declining green resistance line and they verified this breakout by closing above the line for three consecutive trading days.
So, did the short-term outlook just become bullish? Not really. The rallies do appear bullish, but the triple triangle-vertex-based reversal means that any rally that took place recently is actually bearish news for the following days. After all, if the price is likely to reverse (again, it's not just one market that points to a reversal, it's all three of them), then it's likely to decline only if it moved higher before. And that's exactly what happened.
Then again, keeping in mind that the reversals can work on a near-to basis, it means that we could first see one or two days of higher prices before the precious metals market slides next.
If gold moves higher instead of declining, then how far can it go? To the next resistance level. Since gold moved above the 50% Fibonacci retracement level on a day-to-day basis, it could move to the 61.8% Fibonacci retracement at about $1,530. Alternatively, gold could move even higher and rally to approximately the late-September high at about $1,540.
Of course, we're writing "gold", but what we really mean is gold futures prices as that's what the above chart is showing. Friday's intraday high was $1,519, so the above means a possibility of moving beyond it by about $10-$20.
That's it? I was expecting to see something groundbreaking here, and the above seems relatively normal...
Don't worry, that was just a warm-up, and something that needed to be covered anyway. What is the most important detail here is the shape of the recent gold price movement. We've already seen it before. In all likelihood, unless you've become interested in gold only recently, you've already seen it before too. It's not that obvious at first sight, because the time scale is different, but... The way gold is topping right now, it's an almost exact copy of how it topped in 2011.
Let's take a look at the above chart one more time, but this time, we will put gold's 2011 performance before it (so that it's easier to compare it with gold that takes the upper part of the triple chart).
The Anatomy of Gold Tops
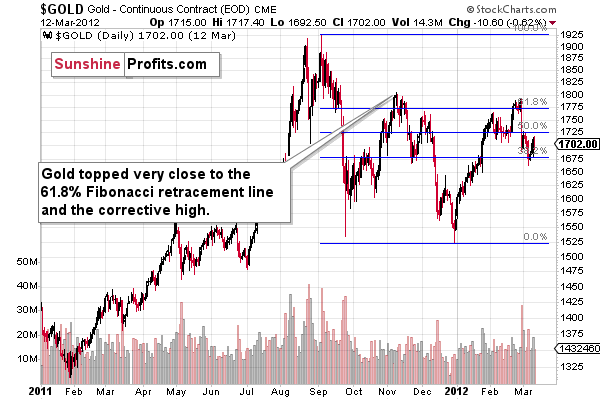
The similarity may not be obvious at first sight thanks to the different time span, but please focus on the following facts:
- Both rallies in gold (2011 and late-2019) had a short-term consolidation in the middle of the rally.
- Both rallies had an initial (early August 2011 and early August 2019) tops, which were followed by a double-top pattern in which the second high was a bit higher.
- The initial declines (late September 2011 and early September 2019) were quickly followed by counter-trend rallies (November 2011 and late September 2019 tops) and then additional declines to new short-term lows (December 2011 and early October bottom).
What followed about 8 years ago was yet another upswing that ended a bit above the 61.8% Fibonacci retracement and very close to the initial high (November 2011). The history has been repeating itself to a considerable degree, which means that gold might rally to $1,530 - $1,540 once again).
It is not carved in stone, though. The history might rhyme instead of being repeated to the letter, which means that this time, the upswing might be smaller (or higher, if gold really wants to trick a lot of people in a late-Halloween fashion).
If the history is indeed repeating here, it's necessary to ask: What happened next?
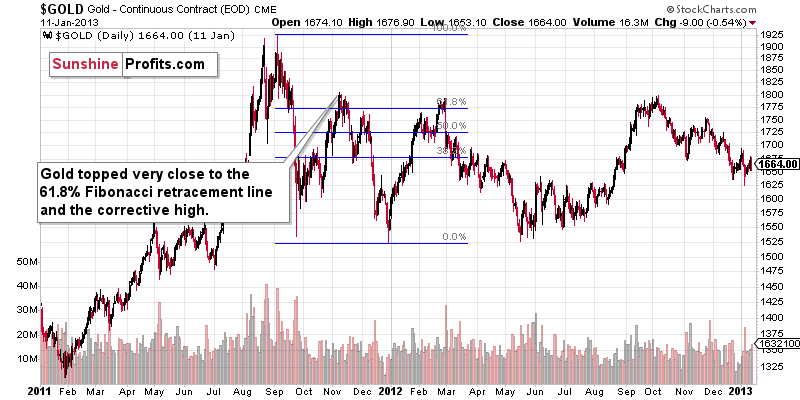
Gold declined to the previous lows once again, and then launched yet another counter-trend upswing from there. The most recent decline ended at about $1,460, so it might be the case that this level will provide gold with strong support once again, and that we'll see yet another counter-trend rally.
And what if gold declines right away from current price levels? Then it changes absolutely nothing with regard to the above. The 2011 topping pattern and what we've seen in the past several months would be similar nonetheless, with the implication that we're likely to see a counter-trend rally once gold moves to about $1,460 anyway.
Hmm, is there any other reason, besides the price shape, that makes this year similar to 2011?
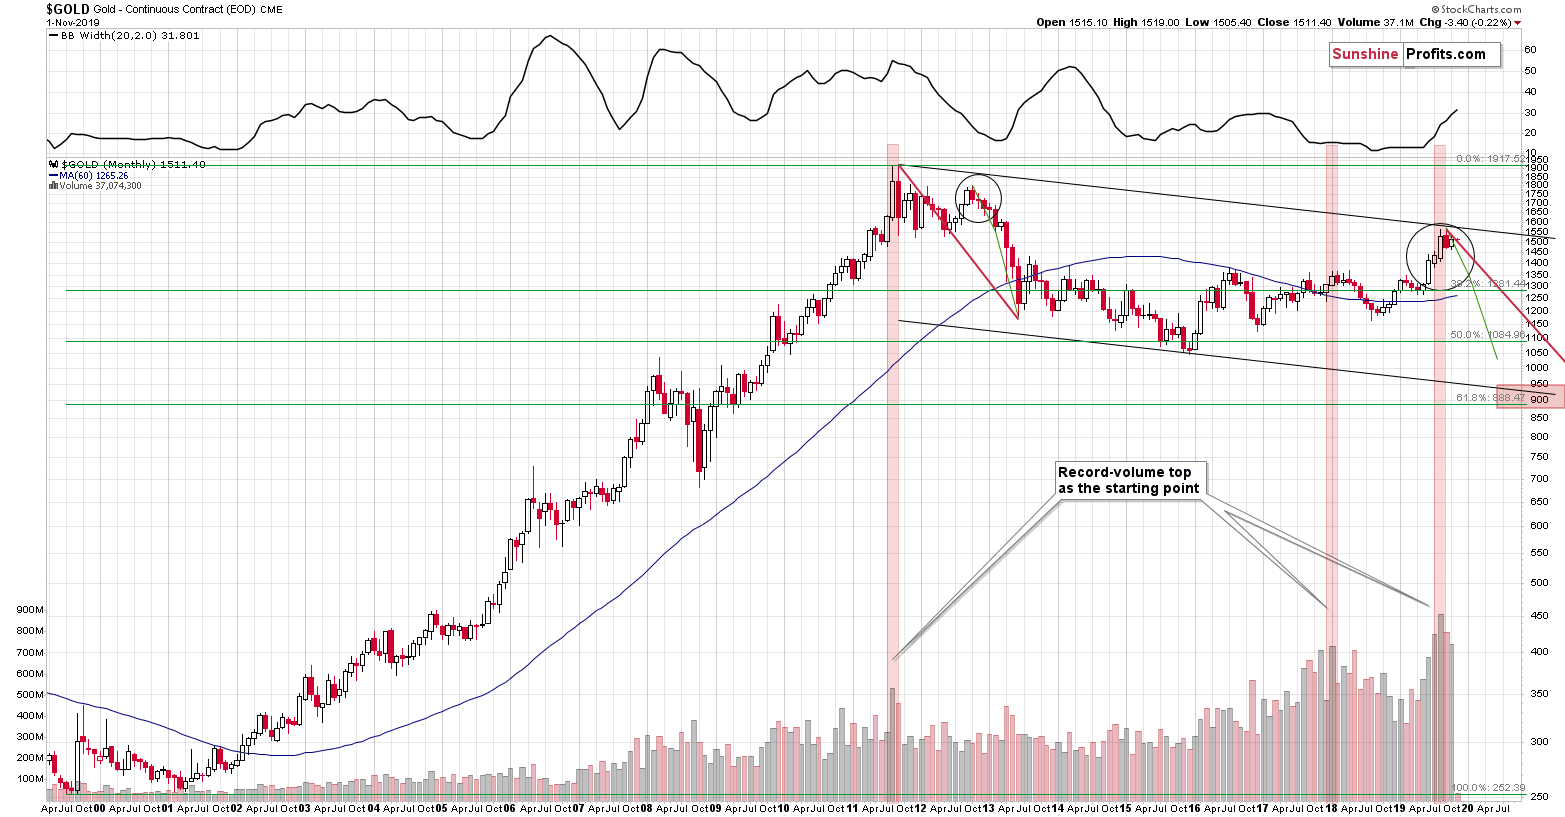
You bet! The most important similarity between the two years is the record-breaking monthly volume that ended both rallies. We saw something similar also in January 2018 (that was the yearly high in terms of the monthly closing prices). The implications of the big volume spike are bearish, as they emphasize the importance of the reversal that took place during a given month. As far as the similarity is concerned, out of these two cases that are similar volume-wise, only the 2011 top was preceded by a rally that was similarly sharp to what we saw in the middle part of this year.
Consequently, it's not just the shape of the price during the 2011 topping process that makes both situations similar - volume readings confirm it too.
All in all, gold's price in November 2019 might move higher initially, only to disappoint shortly thereafter. Gold could move to its recent lows in November, or this short-term decline could end closer to mid-December. The latter seems more likely.
Of course, gold could slide further, if the USD Index soars in the following weeks. It's likely to happen eventually, but it might not happen shortly.
USD Index and Japanese Yen: Implications for Gold
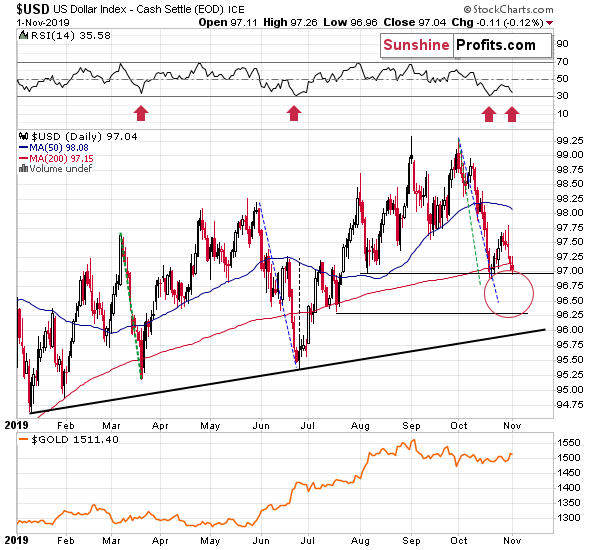
The USD Index is trading at the upper border of our target area, which means that it could slide lower, but it could also be the case that the bottom is already in. The real take-away here is that the downside of the USD currency is limited.
The green and blue dashed lines represent the two biggest declines of this year. If the USD Index matches them, then it could decline by another 0.2 - 0.5. That's not a lot, but it's enough to push gold temporarily higher.
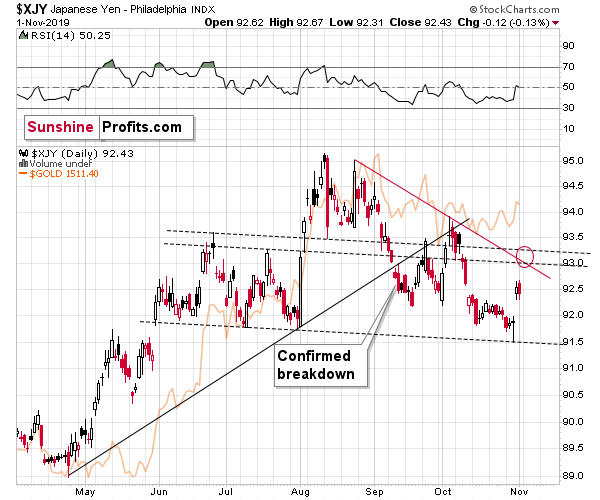
The Japanese yen plays a special part, because it's particularly highly correlated with gold. On a medium-term basis, the yen is after a confirmed breakdown, which points to lower prices in the following months. On a short-term note however, the yen seems to have reversed after which it had rallied sharply. The resistance is not far, but it has not been reached, which means that the next short-term move in the yen is likely to be up (we have an open position based on this likelihood in our Forex Trading Alerts, by the way).
And now, time for the chart you've likely been waiting for after reading the first few paragraphs of today's analysis - the gold price path chart.
Gold Price Path
Before anyone marks us as perma-bears, we would like to emphasize that we're bullish on gold in the long run, but we simply think that it hasn't fallen enough in 2015 and that it needs to fall further in order to start its next real, sustainable bull market. The final part of the chart shows the upswing that we expect to see after the final bottom.
The chart also shows how huge is the price move (in both directions) that one would miss by simply being long here with the aim to wait the decline out, instead of adjusting their capital to profit both from the decline as well as from the following rebound. Of course, this assumes that our views on the market are correct, which may or may not be the case, but given the number of factors that point to lower PM prices, we continue to stand by the bearish outlook in the medium term.
Important note: all targets should be taken on an approximate basis (at least +/- 1 month in terms of time). Moreover, please note that we can't guarantee that gold will indeed move exactly as we outline. It's simply not possible to predict the price path with exact precision and definitely not when it comes to the long-term price moves. Nobody in this, or any other business, can claim to be able to do so, and neither do we. But, does it mean that the chart below is not valuable? Of course not. It shows you more or less what to expect and when certain moves could happen, so that they don't surprise you as they will surprise (and likely cause panic among) beginning investors and traders. It also shows you that big moves are likely relatively close and thanks to comparing them to what already happened a couple of years earlier, you see that expecting these moves is not as unrealistic as it may appear at first sight, especially if one is focused on the most-recent day-to-day trading. It's very easy to get all caught-up in the daily market movement and while gold is rallying, to forget that it declines as well, and while gold keeps on sliding, to forget that gold will also rally (in fact it is likely to rally greatly in the next several years).
So, without further introduction, here's the likely price path for gold for the following months.
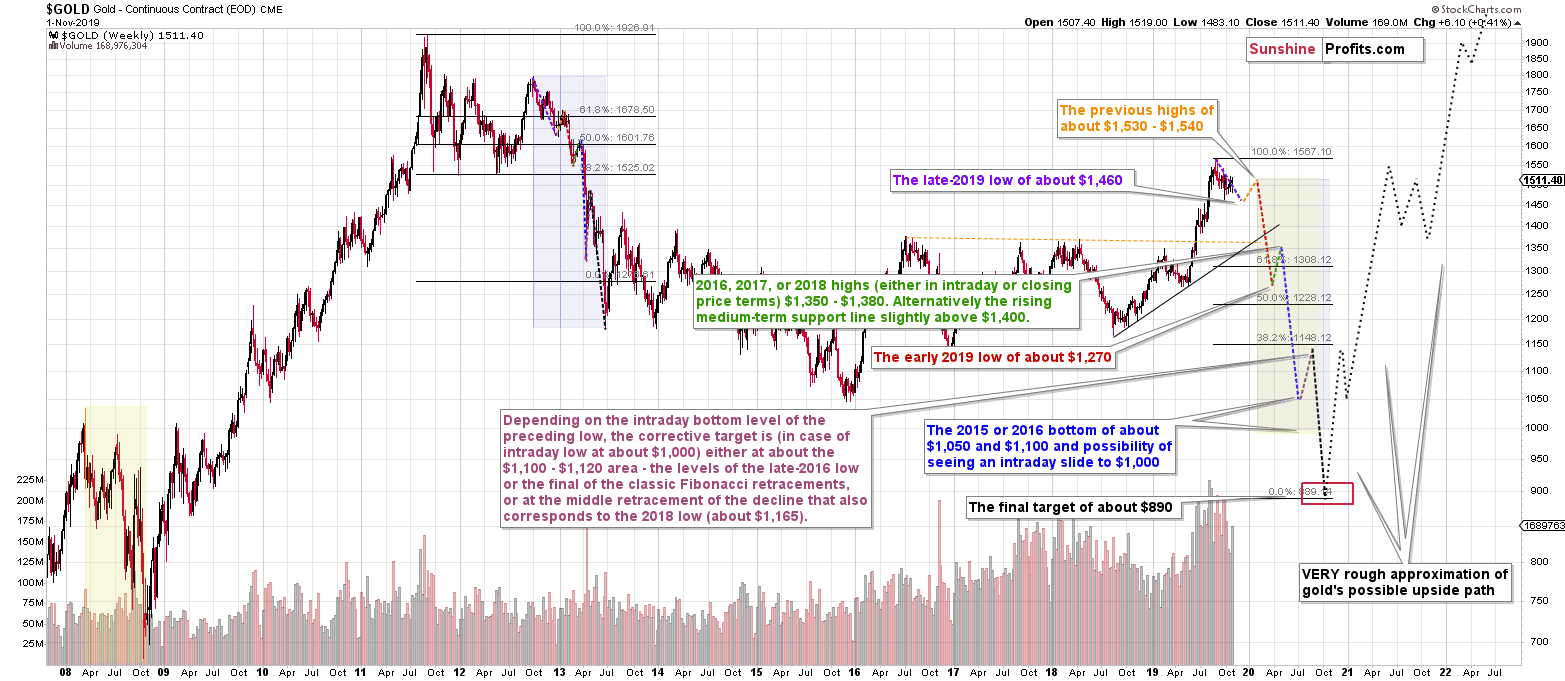
The details are visible directly on the above chart (by the way, you can click it to enlarge it) and the most important takeaways are:
- Gold is still likely to slide below $1,000, most likely to about $890 and it's most likely to take place in the final part of the next year
- The sharp rally that we saw in the previous months is likely to be reversed in a just as sharp manner, but not necessarily right away - based on the above-described analogy to the 2011 top, the initial part of the decline can be relatively mild, just like what we saw in late 2012.
- The decline is likely to accelerate after the early-2020 top (there's a strong seasonal tendency for the precious metals market to perform well between late December and mid-February) and given how long did the previous huge declines last (marked with yellow and blue areas), it seems that the upcoming big decline will end in Q4 2020
- The support levels are provided by the previous lows, Fibonacci retracements (created using the $890 target), and the nearby rising support line
- There's not much clarity regarding the shape of the final part of the decline and the correction that precedes it, just as there was little clarity regarding the initial April 2013 slide. The implication here is not to trust the initial corrective upswing from about $1,050 when almost everyone will be writing about gold having bottomed.
Before summarizing, we would like to quickly show why $890 is such a likely target for the final bottom in gold. Those who have been with us for years know this very well, but since many people joined us recently, we would like to quickly show it once again.
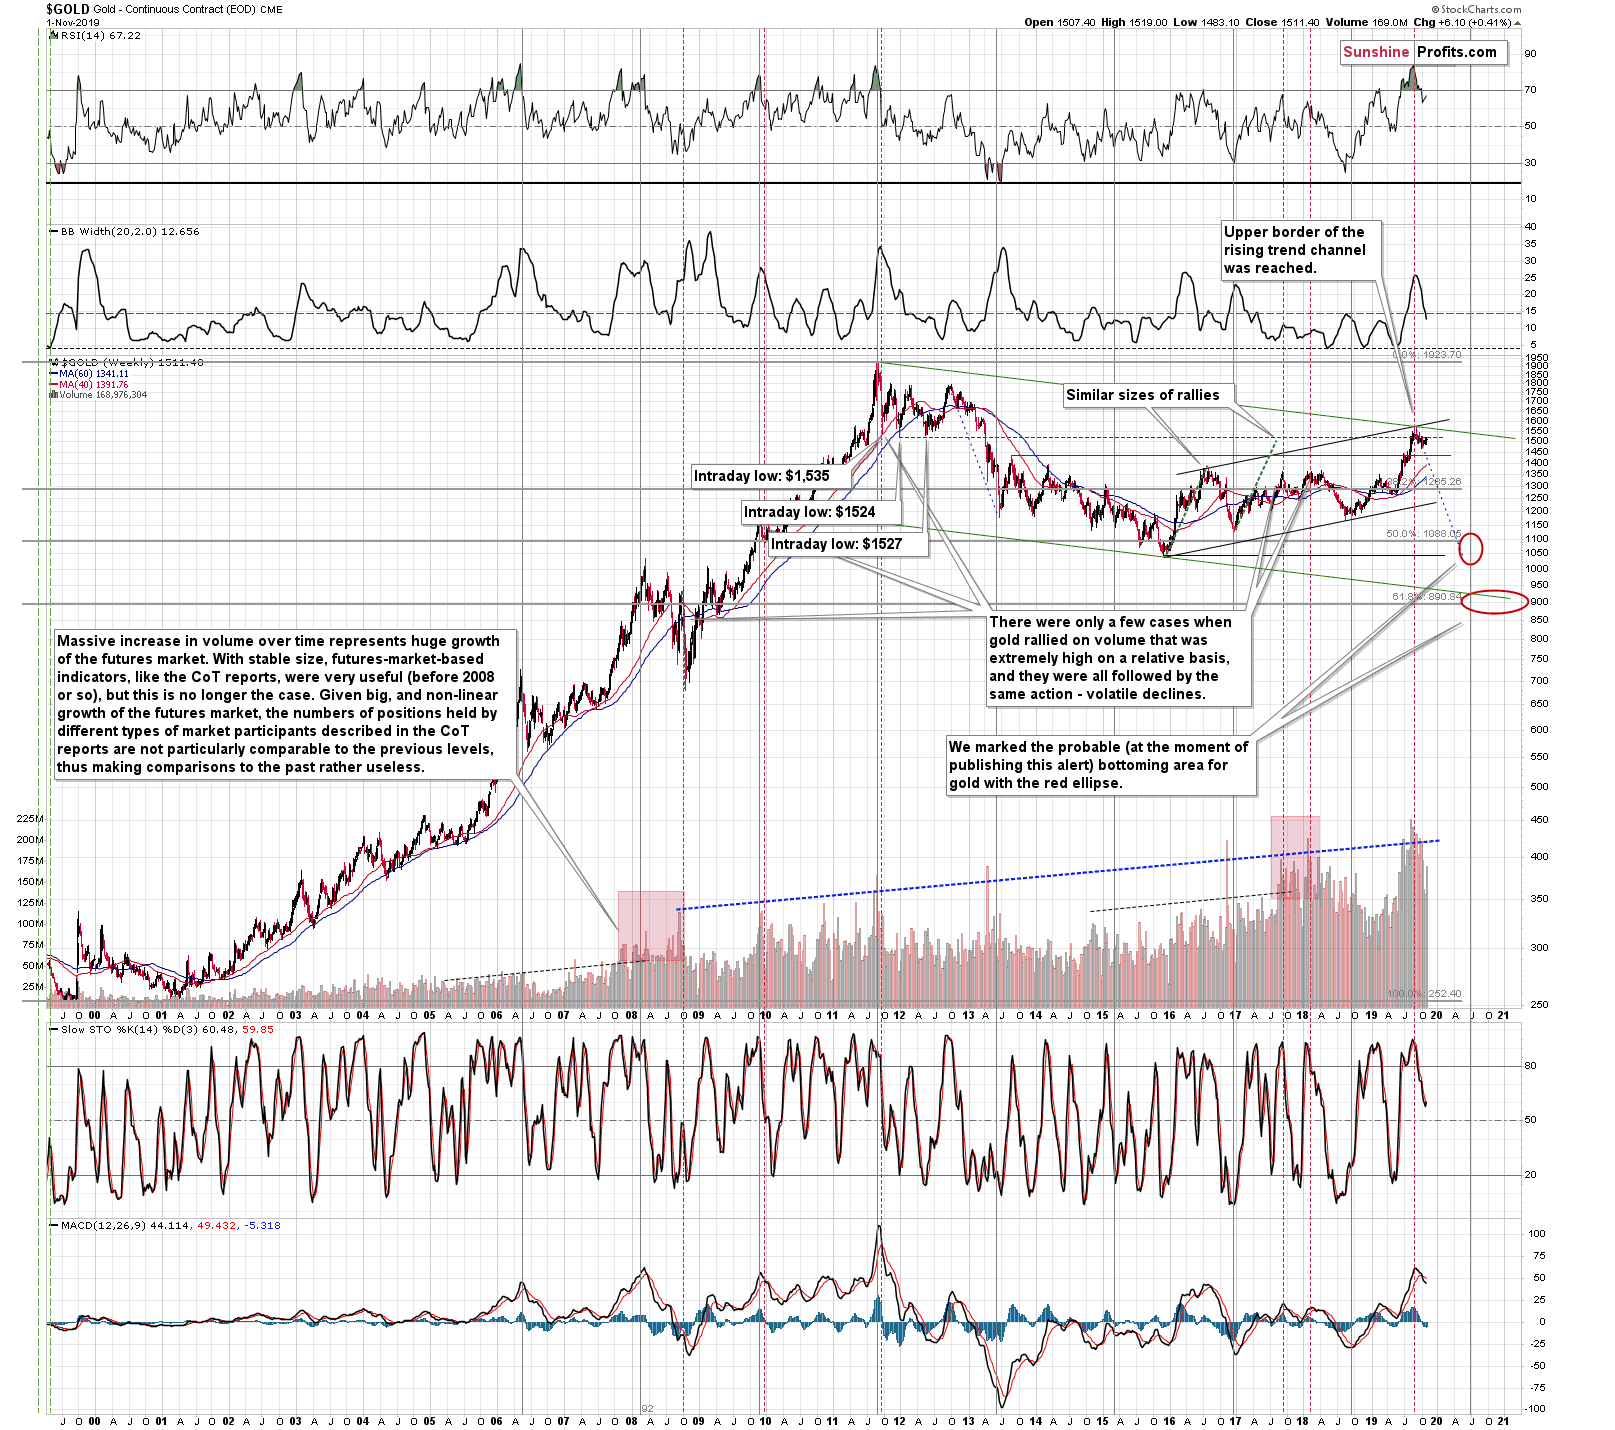
In short, the $890 level is the combination of two critical support levels, and one additional fact. The supports are:
- the 61.8% Fibonacci retracement level (the most classic retracement) based on the entire bull market
- the lower border of the declining trend channel based on the 2011 high, the most recent high and the 2015 low
The 2013 analogy currently suggests a move to the 2015 low, not necessarily to about $890, but the latter is still the most likely target given the above two points and the major fact that we mentioned above. And this fact is that back in 2015 gold was not hated enough for this to be THE bottom. People were relatively optimistic, we saw comments of gold analysts and gold promoters, we saw the outcome of the online polls, we saw our own e-mail inbox. There was neither major panic, nor hate toward gold. Gold was not loathed in the mass media. That's all what we should see at THE bottom and we didn't. Gold simply didn't get low enough. Now, gold breaking below $1,000 (which also means a visible breakdown below the 2015 bottom) is something that should trigger panic selling and make people hate it. That's the environment in which the true bottom is likely to form and the time to back up the truck with the precious metals. For now, in our opinion, the greatest opportunity continues to be in making the most of the upcoming slide.
Naturally, the other key bearish factors for the medium term remain intact.
Key Factors to Keep in Mind
Critical factors:
- The USD Index broke above the very long-term resistance line and verified the breakout above it. Its huge upswing is already underway.
- The USD's long-term upswing is an extremely important and bearish factor for gold. There were only two similar cases in the past few decades, when USD Index was starting profound, long-term bull markets, and they were both accompanied by huge declines in gold and the rest of the precious metals market
- Out of these two similar cases, only one is very similar - the case when gold topped in February 1996. The similarity extends beyond gold's about a yearly delay in reaction to the USD's rally. Also the shape of gold price moves prior to the 1996 high and what we saw in the last couple of years is very similar, which confirm the analysis of the gold-USD link and the above-mentioned implications of USD Index's long-term breakout.
- The similarity between now and 1996 extends to silver and mining stocks - in other words, it goes beyond USD, gold-USD link, and gold itself. The white metal and its miners appear to be in a similar position as well, and the implications are particularly bearish for the miners. After their 1996 top, they erased more than 2/3rds of their prices.
- Many investors got excited by the gold-is-soaring theme in the last few months, but looking beyond the short-term moves, reveals that most of the precious metals sector didn't show substantial strength that would be really visible from the long-term perspective. Gold doesn't appear to be starting a new bull market here, but rather to be an exception from the rule.
- Gold stocks appear to be repeating their performance from 20 years ago, which means that a bottom in the entire precious metals sector is quite likely to form at much lower prices, in about a year
Very important, but not as critical factors:
- Long-term technical signs for silver, i.a. the analogy in terms of price to what we saw in 2008, shows that silver could slide even below $10.
- Silver's very long-term cycles point to a major reversal taking place right now and since the most recent move was up, the implications are bearish (this is also silver's technical sign, but it's so important that it deserves its own point)
- Long-term technical signs for gold stocks point to this not being a new gold bull market beginning. Among others, it's their long-term underperformance relative to gold that hint this is rather a corrective upswing within a bear market that is not over yet.
- Record-breaking weekly volume in gold is a strong sign pointing to lower gold prices
Important factors:
- Extreme volume reading in the SIL ETF (proxy for silver stocks) is an effective indication that lower values of silver miners are to be expected
- Silver's short-term outperformance of gold, and gold stocks' short-term underperformance of gold both confirm that the precious metals sector is topping here
- Gold topped almost right at its cyclical turning point, which makes the trend reversal more likely
- Copper broke below its head-and-shoulders pattern and confirmed the breakdown. The last time we saw something similar was in April 2013, when the entire precious metals sector was on the verge of plunging lower.
Moreover, please note that while there may be a recession threat, it doesn't mean that gold has to rally immediately. Both: recession and gold's multi-year rally could be many months away - comparing what happened to bond yields in the 90s confirms that.
Summary
Summing up, the outlook for the precious metals sector remains very bearish for the following weeks and months and given current triple reversal it might be the case that the counter-trend rally is already over. If, however, the similarity to how gold performed in 2011 remains intact, we might see a quick run-up to about $1530 - $1,540 in gold futures before gold slides once again.
Naturally, one might prefer to take advantage of the above-mentioned bullish possibility, but it seems that given gold's downside potential, the risk to reward ratio continues to favor keeping the current short position intact. Also, given the possibility that gold forms a temporary bottom close to $1,460, we are going to strongly consider closing the current short position or even entering long position once it gets there. However, we are not adjusting the binding exit prices for the current trade, because the $1,460 support is not as strong as the combination of the factors that made us place the target at their current levels.
Time will also be an important factor here. If gold moves close to $1,460 around mid-December, the odds are that it will reverse there. But, if gold quickly slides to e.g. $1,450 before the end of November, while gold miners underperform, then it will serve as a strong indication that gold is likely to fall further before starting a counter-trend rally. In this case, we will not automatically close our positions even though the $1,460 level is (b)reached.
The profits from the short position in gold, silver and mining stocks are likely to be legendary, but the difficult part is not to miss the decline, which is why we're rather reluctant to exit the short position very often.
As always, we'll keep you - our subscribers - informed.
To summarize:
Trading capital (supplementary part of the portfolio; our opinion): Full speculative short position (250% of the full position) in gold, silver, and mining stocks are justified from the risk/reward perspective with the following stop-loss orders and binding exit profit-take price levels:
- Gold: profit-take exit price: $1,391; stop-loss: $1,573; initial target price for the DGLD ETN: $36.37; stop-loss for the DGLD ETN: $25.44
- Silver: profit-take exit price: $15.11; stop-loss: $19.06; initial target price for the DSLV ETN: $24.88; stop-loss for the DSLV ETN: $14.07
- Mining stocks (price levels for the GDX ETF): profit-take exit price: $23.21; stop-loss: $30.11; initial target price for the DUST ETF: $14.69; stop-loss for the DUST ETF $6.08
In case one wants to bet on junior mining stocks' prices, here are the stop-loss details and target prices:
- GDXJ ETF: profit-take exit price: $30.32; stop-loss: $41.22
- JDST ETF: profit-take exit price: $35.88 stop-loss: $12.46
Long-term capital (core part of the portfolio; our opinion): No positions (in other words: cash)
Insurance capital (core part of the portfolio; our opinion): Full position
Whether you already subscribed or not, we encourage you to find out how to make the most of our alerts and read our replies to the most common alert-and-gold-trading-related-questions.
Please note that the in the trading section we describe the situation for the day that the alert is posted. In other words, it we are writing about a speculative position, it means that it is up-to-date on the day it was posted. We are also featuring the initial target prices, so that you can decide whether keeping a position on a given day is something that is in tune with your approach (some moves are too small for medium-term traders and some might appear too big for day-traders).
Plus, you might want to read why our stop-loss orders are usually relatively far from the current price.
Please note that a full position doesn't mean using all of the capital for a given trade. You will find details on our thoughts on gold portfolio structuring in the Key Insights section on our website.
As a reminder - "initial target price" means exactly that - an "initial" one, it's not a price level at which we suggest closing positions. If this becomes the case (like it did in the previous trade) we will refer to these levels as levels of exit orders (exactly as we've done previously). Stop-loss levels, however, are naturally not "initial", but something that, in our opinion, might be entered as an order.
Since it is impossible to synchronize target prices and stop-loss levels for all the ETFs and ETNs with the main markets that we provide these levels for (gold, silver and mining stocks - the GDX ETF), the stop-loss levels and target prices for other ETNs and ETF (among other: UGLD, DGLD, USLV, DSLV, NUGT, DUST, JNUG, JDST) are provided as supplementary, and not as "final". This means that if a stop-loss or a target level is reached for any of the "additional instruments" (DGLD for instance), but not for the "main instrument" (gold in this case), we will view positions in both gold and DGLD as still open and the stop-loss for DGLD would have to be moved lower. On the other hand, if gold moves to a stop-loss level but DGLD doesn't, then we will view both positions (in gold and DGLD) as closed. In other words, since it's not possible to be 100% certain that each related instrument moves to a given level when the underlying instrument does, we can't provide levels that would be binding. The levels that we do provide are our best estimate of the levels that will correspond to the levels in the underlying assets, but it will be the underlying assets that one will need to focus on regarding the signs pointing to closing a given position or keeping it open. We might adjust the levels in the "additional instruments" without adjusting the levels in the "main instruments", which will simply mean that we have improved our estimation of these levels, not that we changed our outlook on the markets. We are already working on a tool that would update these levels on a daily basis for the most popular ETFs, ETNs and individual mining stocks.
Our preferred ways to invest in and to trade gold along with the reasoning can be found in the how to buy gold section. Additionally, our preferred ETFs and ETNs can be found in our Gold & Silver ETF Ranking.
As a reminder, Gold & Silver Trading Alerts are posted before or on each trading day (we usually post them before the opening bell, but we don't promise doing that each day). If there's anything urgent, we will send you an additional small alert before posting the main one.
=====
Latest Free Trading Alerts:
The markets will likely take some breather in the coming week following last week's huge economic data announcements. But that does not mean there won't be trading opportunities coming from the data releases. Last week we asked if quarterly corporate earnings would push stock prices to new record highs, and they did! But will optimism in stocks, gold, oil and the Euro remain after the next set of economic news releases? Let's take a look at this week's schedule.
Important Economic News Calendar: November 4 - November 8, 2019
=====
Thank you.
Sincerely,
Przemyslaw Radomski, CFA
Editor-in-chief, Gold & Silver Fund Manager

