

Briefly: in our opinion, full (250% of the regular size of the position) speculative short position in gold, silver, and mining stocks is justified from the risk/reward point of view at the moment of publishing this Alert.
After over 15 years of being the underdog, palladium is not only outshining gold - it's doing so in an extreme manner. It's no wonder that palladium moved more on a short-term basis than gold did, as the palladium market is relatively small. What is remarkable, however, is that in nominal terms palladium's price exceeded gold's, and - which is even more striking - it managed to hold on to these gains. After consolidating a bit, the gold to palladium ratio is diving decisively below 1. Many may think that given its outperformance, the palladium market is moving into uncharted waters, but that's far from the truth. We've seen the same kind of strength before. What is even more interesting, that the previous breakdown below 1 in the gold to palladium ratio was also followed by a consolidation and then...
Palladium in the Spotlight
(click on the chart to expand it)
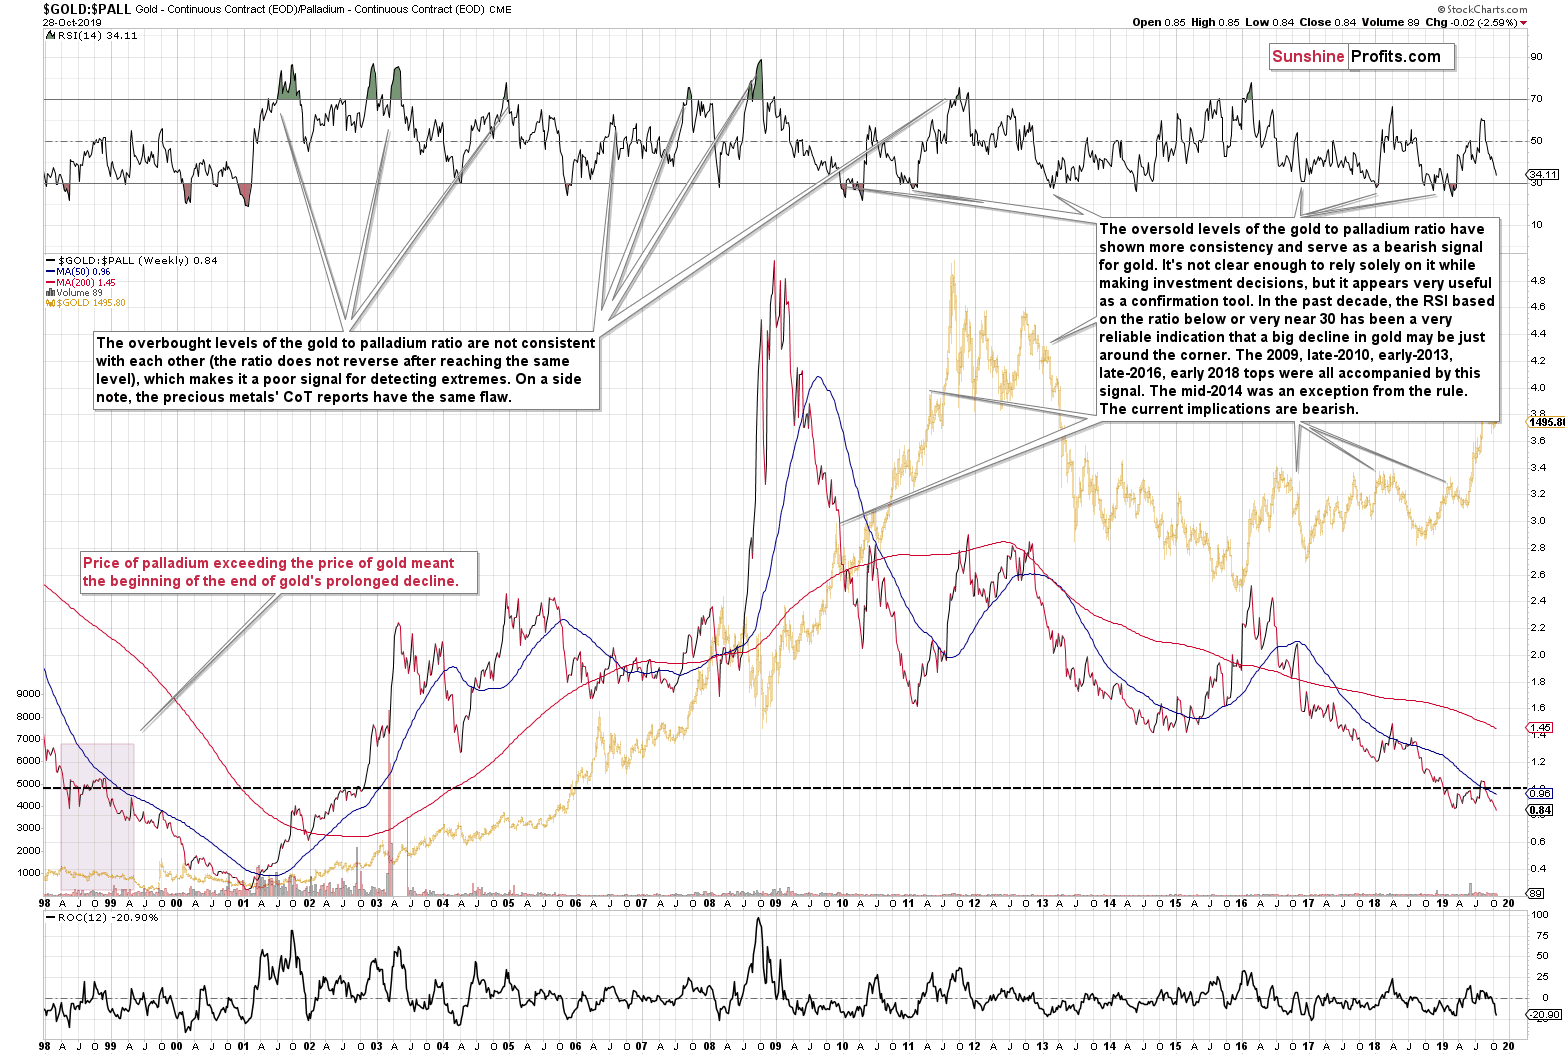
And then the decline in the ratio continued until it moved well below 0.5. In other words, palladium continued to be more and more expensive than gold until it became more than twice as expensive as gold.
That's quite interesting, but what is even more striking is what happened in gold at that time. During the final part of palladium's outperformance, gold declined and then finally reached its true bottom after declining for many years.
The decline accelerated in 1999, which is when the breakdown below the 1 level in the ratio was verified and the consolidation was over. The consolidation appears to be over right now, which does not bode well for the following months.
Looking at the upper part of the chart, we see that the RSI is approaching the 30 level. It's not yet at or below it, which would indicate an oversold territory for the ratio, but it's getting there quite fast.
The RSI indicator usually works in a rather straightforward way: RSI over 70 suggests a looming top, and RSI below 30 suggests a looming bottom. However, before applying any indicator to any market, it's best to check how it worked (one might discover that, for instance, golden cross in gold is not bullish at all). In case of the gold to palladium ratio, the RSI indicator works in a rather specific manner.
The overbought (above 70) levels of the gold to palladium ratio are not consistent with each other (the ratio does not reverse after reaching the same level), which makes it a poor signal for detecting tops. On a side note, the precious metals' CoT reports have the same flaw.
The oversold levels of the gold to palladium ratio have shown more consistency and serve as a bearish signal for gold. It's not clear enough to rely solely on it while making investment decisions, but it appears very useful as a confirmation tool. In the past decade, the RSI based on the ratio below or very near 30 has been a very reliable indication that a big decline in gold may be just around the corner. The 2009, late-2010, early-2013, late-2016, early 2018 tops were all accompanied by this signal. The mid-2014 was an exception from the rule. The current implications are bearish.
Having said that, let's take a look at palladium's sister metal - platinum.
Turning to Platinum Now
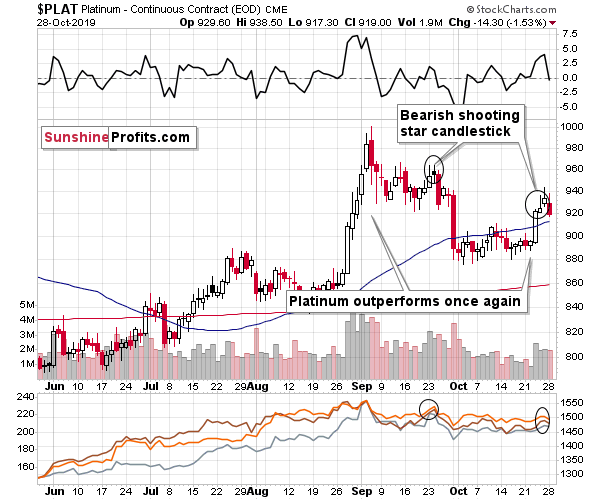
After seeing the first reversal candlestick last week, we commented on the above platinum chart in the following way:
Based on what happened yesterday, it's not just a daily show of strength that makes the outlook bearish. It's also a daily reversal that's similar to the reversal that we saw previously. Shooting star reversal candlesticks are bearish on their own and we saw one yesterday. But, they are even more bearish if they have recently proved to be useful for a given market and that's exactly what happened in case of platinum on September 23rd. It was very close to the top in platinum as well as tops in gold, silver, and mining stocks. While the implications are bearish, it's not necessarily immediately so. There was one additional day of strength (September 24th) before platinum declined, so it might be the case that the decline gets postponed to the next week instead of starting right away.
That's exactly what happened - we saw one additional day of strength, after which platinum reversed and declined. And the key parts of the precious metals sector: gold, silver, and mining stocks declined along with it.
On a side note, have you noticed that the platinum jewelry is much more expensive than palladium jewelry? One reason is that platinum is almost twice as dense as palladium, which means that more of it has to be used to make the same piece of jewelry (e.g. a wedding ring). The other reason is that the marketing side of business is quite slow to reflect the pricing changes in the underlying market dynamics. Another example would be credit cards. Is platinum or gold card better and packed with more features? Exactly - and platinum has been cheaper than gold for almost 5 years now...
All in all, both above-mentioned precious (and industrial) metals, and both perspectives that one can take to examine the palladium market point to lower gold prices in the following months. If you're thinking about when and how to buy gold, it might best to wait with the purchases for lower prices. There will most likely be much better buying opportunities in the following months than the one that we have right now.
Having said that, let's take a look at yesterday's price moves in gold, silver, and mining stocks.
The Short-Term in PMs
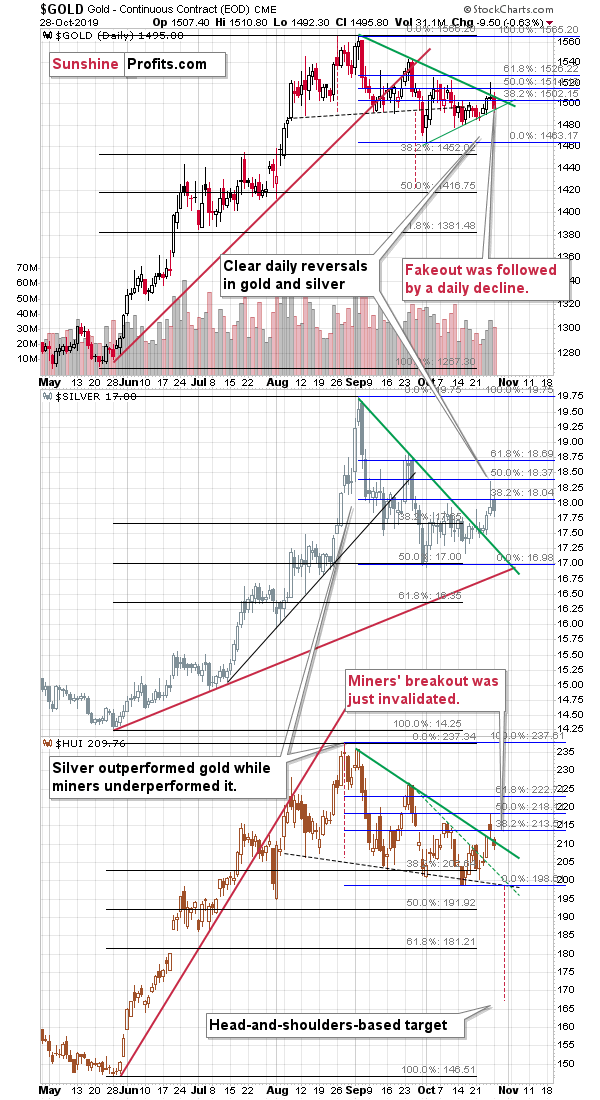
Gold's decline and its implications are rather self-explanatory. After the fake breakout, gold was likely to decline, and it did.
Gold stocks' breakout was more visible, and it was not invalidated on the same day. This might have caused some investors to view the outlook as bullish, but we warned you that this is not the case. In yesterday's analysis, we wrote the following:
Gold stocks didn't erase their entire intraday rally and the HUI Index even moved to new monthly intraday high. Gold didn't, so shouldn't this kind of strength be viewed as bullish? Not necessarily. First of all, this was just a one-day event. Second, another important proxy for the mining stocks - the GDX ETF - doesn't confirm the bullish interpretation.
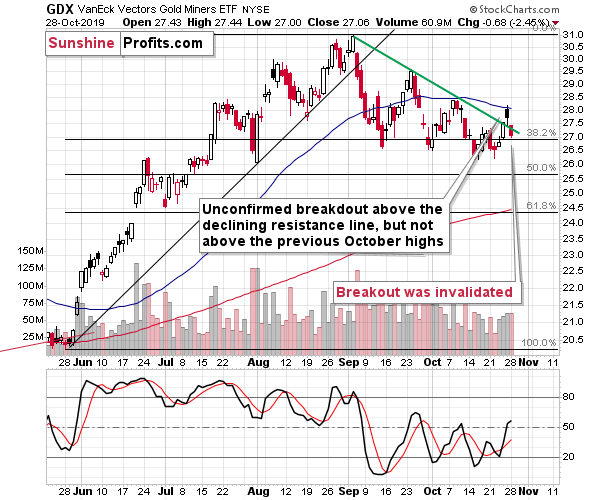
Unlike the HUI Index, the GDX ETF didn't move to new intraday high. Instead it moved to the 50-day moving average and then declined, just as it did earlier this month. Consequently, the indication of relative strength doesn't seem to be worth taking into account.
GDX broke above the declining resistance line, but this move is relatively small and not confirmed. If it closes above the line for two more consecutive days, the implications might be bullish, but they are not bullish at this time.
Instead of a confirmation, we saw invalidation, and it happened simultaneously in both proxies for the miners: the HUI Index and the GDX ETF. Both invalidations are very bearish for the following days. This, combined with multiple signs that point to lower precious metals prices in the following weeks and months, makes the outlook clearly bearish and it makes the short positions very justified from the risk to reward point of view. Naturally, the very bearish implications of silver's powerful reversal that we saw on Friday remain up-to-date, but we discussed it in detail yesterday, so we don't want to repeat yesterday's entire analysis once again.
Naturally, the other key bearish factors for the medium term remain intact.
Key Factors to Keep in Mind
Critical factors:
- The USD Index broke above the very long-term resistance line and verified the breakout above it. Its huge upswing is already underway.
- The USD's long-term upswing is an extremely important and bearish factor for gold. There were only two similar cases in the past few decades, when USD Index was starting profound, long-term bull markets, and they were both accompanied by huge declines in gold and the rest of the precious metals market
- Out of these two similar cases, only one is very similar - the case when gold topped in February 1996. The similarity extends beyond gold's about a yearly delay in reaction to the USD's rally. Also the shape of gold price moves prior to the 1996 high and what we saw in the last couple of years is very similar, which confirm the analysis of the gold-USD link and the above-mentioned implications of USD Index's long-term breakout.
- The similarity between now and 1996 extends to silver and mining stocks - in other words, it goes beyond USD, gold-USD link, and gold itself. The white metal and its miners appear to be in a similar position as well, and the implications are particularly bearish for the miners. After their 1996 top, they erased more than 2/3rds of their prices.
- Many investors got excited by the gold-is-soaring theme in the last few months, but looking beyond the short-term moves, reveals that most of the precious metals sector didn't show substantial strength that would be really visible from the long-term perspective. Gold doesn't appear to be starting a new bull market here, but rather to be an exception from the rule.
- Gold stocks appear to be repeating their performance from 20 years ago, which means that a bottom in the entire precious metals sector is quite likely to form at much lower prices, in about a year
Very important, but not as critical factors:
- Long-term technical signs for silver, i.a. the analogy in terms of price to what we saw in 2008, shows that silver could slide even below $10.
- Silver's very long-term cycles point to a major reversal taking place right now and since the most recent move was up, the implications are bearish (this is also silver's technical sign, but it's so important that it deserves its own point)
- Long-term technical signs for gold stocks point to this not being a new gold bull market beginning. Among others, it's their long-term underperformance relative to gold that hint this is rather a corrective upswing within a bear market that is not over yet.
- Record-breaking weekly volume in gold is a strong sign pointing to lower gold prices
Important factors:
- Extreme volume reading in the SIL ETF (proxy for silver stocks) is an effective indication that lower values of silver miners are to be expected
- Silver's short-term outperformance of gold, and gold stocks' short-term underperformance of gold both confirm that the precious metals sector is topping here
- Gold topped almost right at its cyclical turning point, which makes the trend reversal more likely
- Copper broke below its head-and-shoulders pattern and confirmed the breakdown. The last time we saw something similar was in April 2013, when the entire precious metals sector was on the verge of plunging lower.
Moreover, please note that while there may be a recession threat, it doesn't mean that gold has to rally immediately. Both: recession and gold's multi-year rally could be many months away - comparing what happened to bond yields in the 90s confirms that.
Summary
Summing up, the outlook for the precious metals sector remains very bearish for the following weeks and months and given the recent invalidations of short-term breakouts, the short-term outlook is bearish as well. Based on the triple triangle-vertex-based reversals (visible on today's third chart), we might see a counter-trend move that starts in early November, but based on the recent invalidations of breakouts, this counter-trend move might actually be a small rally after a bigger decline.
The similarity to how gold stocks rallied and then declined about 20 years ago provides us with a specific time target for the decline in the entire precious metals sector - it's likely to take place for about 1 year from now. That's not particularly close, but the road lower that gold, silver, and miners are likely to take is not short either. The profits from the short position in gold, silver and mining stocks are likely to be legendary, but the difficult part is not to miss the decline. Fortunately, the slide's pace that we saw 20 years ago provides suggestions regarding when it might be worth to bet on the corrective upswing with one's trading capital and when it's better to wait it out. Based on the analogy to the above-mentioned decline, the next medium-term bottom might take place in mid-December.
As always, we'll keep you - our subscribers - informed.
To summarize:
Trading capital (supplementary part of the portfolio; our opinion): F speculative short position (250% of the full position) in gold, silver, and mining stocks are justified from the risk/reward perspective with the following stop-loss orders and binding exit profit-take price levels:
- Gold: profit-take exit price: $1,391; stop-loss: $1,573; initial target price for the DGLD ETN: $36.37; stop-loss for the DGLD ETN: $25.44
- Silver: profit-take exit price: $15.11; stop-loss: $19.06; initial target price for the DSLV ETN: $24.88; stop-loss for the DSLV ETN: $14.07
- Mining stocks (price levels for the GDX ETF): profit-take exit price: $23.21; stop-loss: $30.11; initial target price for the DUST ETF: $14.69; stop-loss for the DUST ETF $6.08
In case one wants to bet on junior mining stocks' prices, here are the stop-loss details and target prices:
- GDXJ ETF: profit-take exit price: $30.32; stop-loss: $41.22
- JDST ETF: profit-take exit price: $35.88 stop-loss: $12.46
Long-term capital (core part of the portfolio; our opinion): No positions (in other words: cash)
Insurance capital (core part of the portfolio; our opinion): Full position
Whether you already subscribed or not, we encourage you to find out how to make the most of our alerts and read our replies to the most common alert-and-gold-trading-related-questions.
Please note that the in the trading section we describe the situation for the day that the alert is posted. In other words, it we are writing about a speculative position, it means that it is up-to-date on the day it was posted. We are also featuring the initial target prices, so that you can decide whether keeping a position on a given day is something that is in tune with your approach (some moves are too small for medium-term traders and some might appear too big for day-traders).
Plus, you might want to read why our stop-loss orders are usually relatively far from the current price.
Please note that a full position doesn't mean using all of the capital for a given trade. You will find details on our thoughts on gold portfolio structuring in the Key Insights section on our website.
As a reminder - "initial target price" means exactly that - an "initial" one, it's not a price level at which we suggest closing positions. If this becomes the case (like it did in the previous trade) we will refer to these levels as levels of exit orders (exactly as we've done previously). Stop-loss levels, however, are naturally not "initial", but something that, in our opinion, might be entered as an order.
Since it is impossible to synchronize target prices and stop-loss levels for all the ETFs and ETNs with the main markets that we provide these levels for (gold, silver and mining stocks - the GDX ETF), the stop-loss levels and target prices for other ETNs and ETF (among other: UGLD, DGLD, USLV, DSLV, NUGT, DUST, JNUG, JDST) are provided as supplementary, and not as "final". This means that if a stop-loss or a target level is reached for any of the "additional instruments" (DGLD for instance), but not for the "main instrument" (gold in this case), we will view positions in both gold and DGLD as still open and the stop-loss for DGLD would have to be moved lower. On the other hand, if gold moves to a stop-loss level but DGLD doesn't, then we will view both positions (in gold and DGLD) as closed. In other words, since it's not possible to be 100% certain that each related instrument moves to a given level when the underlying instrument does, we can't provide levels that would be binding. The levels that we do provide are our best estimate of the levels that will correspond to the levels in the underlying assets, but it will be the underlying assets that one will need to focus on regarding the signs pointing to closing a given position or keeping it open. We might adjust the levels in the "additional instruments" without adjusting the levels in the "main instruments", which will simply mean that we have improved our estimation of these levels, not that we changed our outlook on the markets. We are already working on a tool that would update these levels on a daily basis for the most popular ETFs, ETNs and individual mining stocks.
Our preferred ways to invest in and to trade gold along with the reasoning can be found in the how to buy gold section. Additionally, our preferred ETFs and ETNs can be found in our Gold & Silver ETF Ranking.
As a reminder, Gold & Silver Trading Alerts are posted before or on each trading day (we usually post them before the opening bell, but we don't promise doing that each day). If there's anything urgent, we will send you an additional small alert before posting the main one.
Thank you.
Sincerely,
Przemyslaw Radomski, CFA
Editor-in-chief, Gold & Silver Fund Manager

