
tools spotlight

-
The FED Holds the Market. How Long Will It Last?
June 11, 2021, 9:28 AMWith investors discrediting fundamentals to follow the FED’s instruction, it seems everything relies now on a few people’s say-so.
It's a Bird, It's a Plane, It's the FED
With Jerome Powell, Chairman of the U.S. Federal Reserve (FED), donning his cape like Superman and his monetary crew akin to The Avengers, investors’ faith in the FED was on full display on Jun. 10. Case in point: with the headline Consumer Price Index (CPI) surging by 4.93% year-over-year (YoY) – the highest YoY percentage increase since 2008 – the bond, stock and currency markets barely flinched.
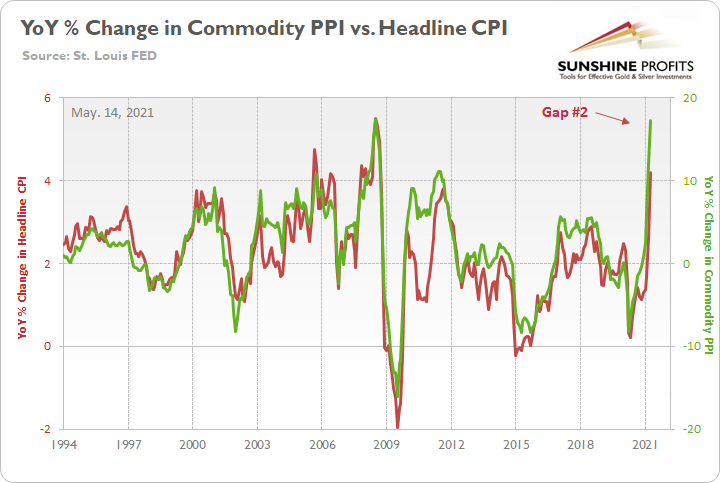
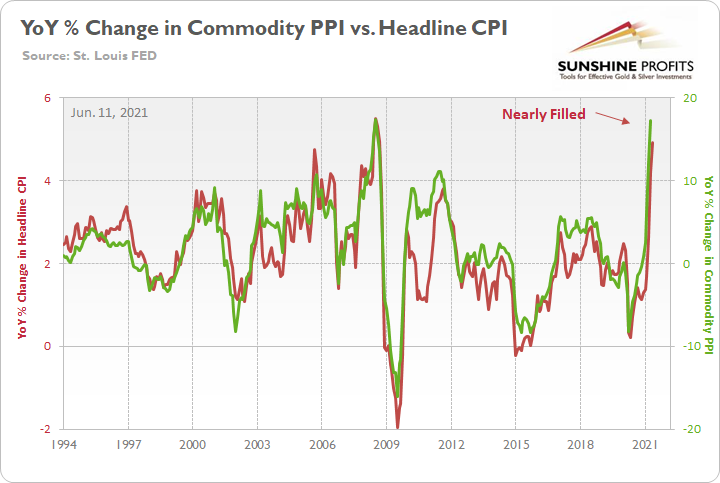
The commodity PPI surged by 17.25% YoY in April. And if you exclude the 17.36% YoY jump in July 2008, it was the largest YoY percentage increase since December 1974. For context, the commodity PPI often leads the headline CPI and that’s why tracking the former’s movement is so important. Moreover, reconnecting with the green line implies a ~5.50% YoY percentage increase in the headline CPI.
Please see below:
And with the indicator proving quite prescient once again, the gap on the right side of the chart was nearly filled on Jun. 10.
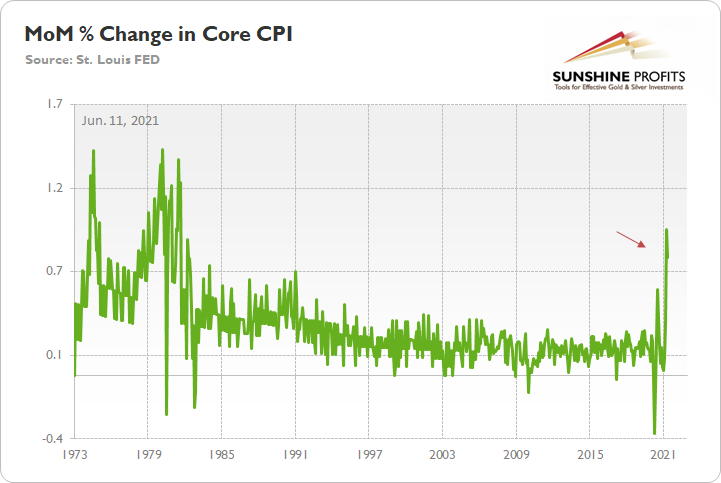
Furthermore, while investors continue to see the world through the FED’s X-Ray Vision, “base effects” are now the primary defense among the superhero’s supporters. However, as I’ve mentioned on several occasions, it’s important to remember that the core CPI increased by 0.74% month-over-month (MoM). And if you exclude April’s rise of 0.92% (which was only one month ago), it was the highest MoM percentage increase since 1982.
Please see below:
The FED Has Become Independent Thought’s Kryptonite
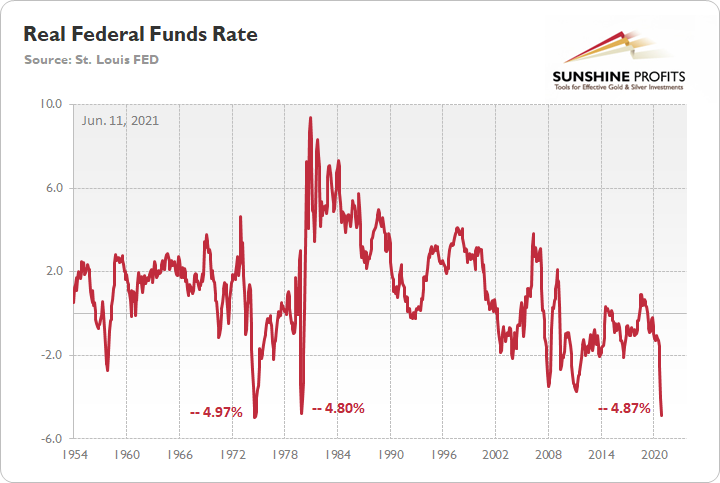
On top of that, with the YoY percentage change in the headline CPI running extremely hot, the real federal funds rate is now at its second-lowest level ever. For context, the federal funds rate is the overnight lending rate set by the FOMC, while the real federal funds rate is adjusted for inflation by subtracting the YoY percentage change in the headline CPI.
Please see below:
So how can we explain investors’ lack of prudence?
Well, as Bloomberg eloquently put it on Jun. 10…
 Source: Bloomberg
Thus, with the FED mesmerizing investors and keeping them under its spell, market participants have determined that it’s easier to follow the FED rather than fight it. However, when screaming fundamentals are dismissed as irrelevant, it often ends badly for those who fail to heed the warnings. To that point, while the Producer Price Index (PPI) – which will be released on Jun. 15 – will provide important clues on the inflationary trajectory, Nordea’s trend model signals that YoY CPI prints still have plenty of room to run.
Please see below:
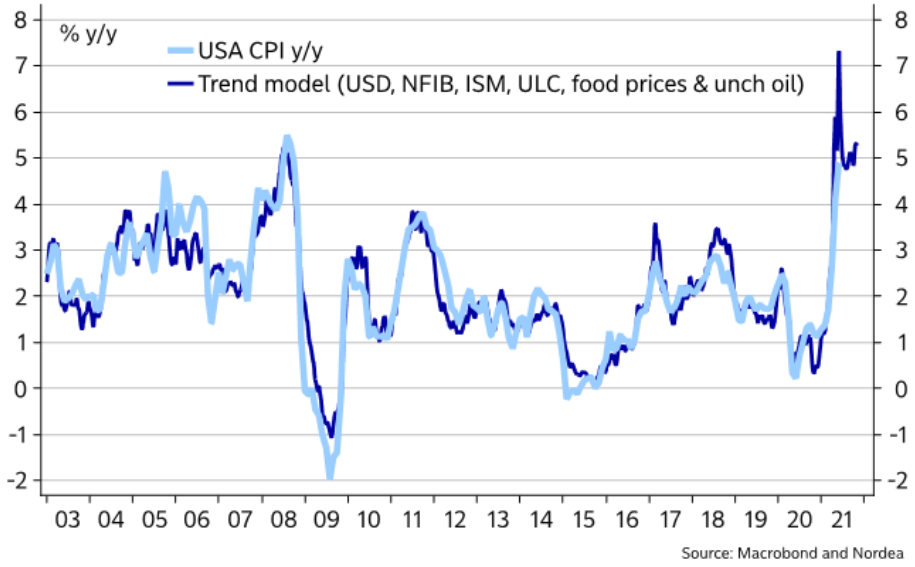
To explain, the light blue line above tracks the YoY percentage change in the headline CPI, while the dark blue line above tracks the projected YoY percentage change in Nordea’s trend model. If you analyze the right side of the chart, you can see that April and May’s prints were accurately forecasted. More importantly, though, with the dark blue line signaling that the headline CPI should rise by more than 7% YoY in the coming months, investors’ faith in the FED will be put to the test over the medium term.
Likewise, even though the FED has become independent thought’s kryptonite, if investors dismiss the scorching inflationary summer, they’ll likely incur deeper burns in the fall.
To explain, I wrote on Jun. 10:
With the Jun. 15/16 policy meeting not leaving enough time for FED officials to “communicate very early, very often what we’re going to do” (spoken by Philadelphia FED President Patrick Harker) and the Jul. 27/28 policy meeting excluding a summary of the FED’s economic projections, either the Jackson Hole Economic Symposium (late August) or the Sep. 21/22 policy meeting is when the fireworks will likely begin.
With the U.S. Bureau of Labor Statistics (BLS) revealing on Jun. 8 that U.S. job openings surged to an all-time high of 9.286 million – and came in well above the consensus estimate of 8.300 million – the only thing depressing the U.S. labor market are ill-advised enhanced unemployment benefits.
Please see below:
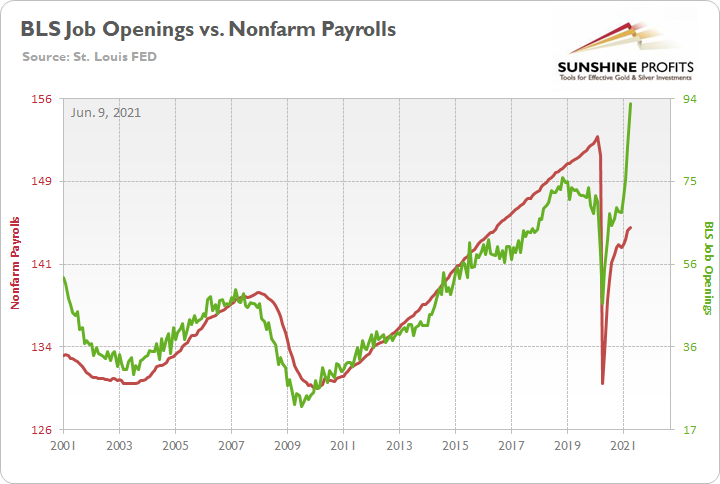
To explain, the red line above tracks U.S. nonfarm payrolls, while the green line above tracks U.S. job openings. If you analyze the relationship, you can see that the latter is often a strong predictor of the former. However, with enhanced unemployment benefits still in effect until mid-to-late June or early July (across ~25 states) – and nationwide until Sep. 6 (expected) – the shift likely won’t occur overnight. But once the benefits expire, U.S. nonfarm payrolls will likely spike in August (reflecting July’s data) and September (reflecting August’s data) and lift the U.S. 10-Year Treasury yield and the USD Index in the process.
The bottom line? With a potential spike in the Shelter CPI likely to coincide with a major resurgence in the U.S. labor force, September has all of the necessary ingredients to force the FED’s hand.
The ECB Is Not Reducing Anything
On top of that, I warned that prophecies of the European Central Bank (ECB) reducing its bond-buying program in June were much more semblance than substance.
I wrote on Apr. 27:
Recent whispers of the ECB tapering its bond-buying program are extremely premature. With the European economy still drastically underperforming the U.S., it’s actually more likely that the ECB increases the pace of its bond-buying program.
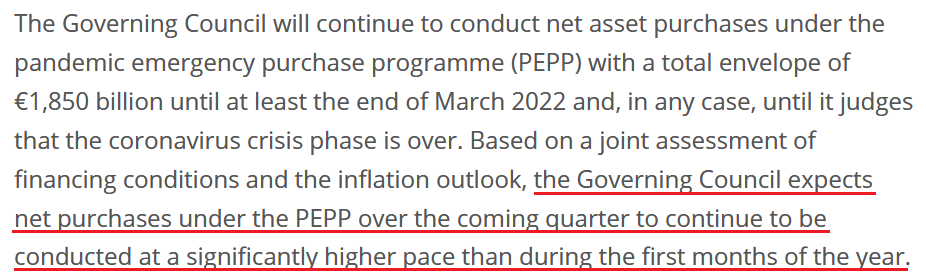
And after the ECB released its monetary policy decision on Jun. 10, what was clear before now is the reality.
Please see below:
 Source: ECB
In addition, ECB President Christine Lagarde said the following during her press conference:
- "The U.S. economic situation and the Euro Area economic situation are very different stories. The two economies are at different points in the recovery cycle. "
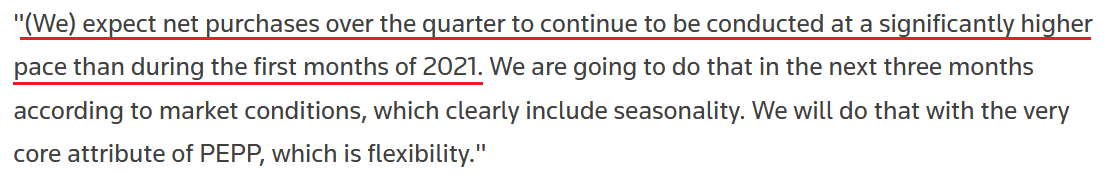
- "Any discussion about exit from the PEPP would be premature, too early, and it will come in due course, but certainly, for the moment it is too early and premature – simple as that."
- "Any kind of transition, exit, whatever you call it, has not been discussed"
And although the ECB increased its Eurozone GDP growth, as well as inflation expectations, and Lagarde even said that “there was [a] debate on the pace of the purchase, on some of the analytical aspects of the use of our instruments,” she reiterated:
 Source: Reuters
The bottom line?
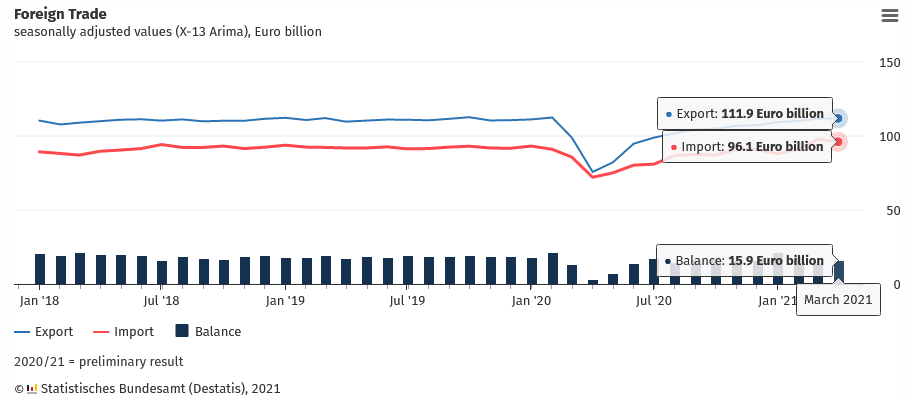
While the EUR/USD remains materially overvalued, the ECB’s policy is not the only fundamental data point that supports this thesis. Case in point: it was a trifecta for Germany (Europe’s largest economy) on Jun. 9, with imports, exports, and consequently the German trade balance, all missing economists’ consensus estimate. To explain, exports rose by 0.30% MoM versus 0.5% expected, imports fell by 1.7% MoM versus a decline of 1.1% expected and the trade balance came in at €15.9 billion versus €16.3 billion expected.
Please see below:
The S&P 500 Is Losing Momentum
Finally, while it may not be visible on the surface, the S&P 500’s momentum continues to decelerate. Even though the U.S. equity benchmark followed the ‘don’t fight the FED’ mantra to another all-time high on Jun. 10, optimism is waning. Case in point: while the YoY percentage change in the FED’s balance sheet (released on Jun. 10) was roughly flat this week, the YoY percentage change in the S&P 500 continues to move lower. And with a summertime soirée likely the last “hurrah!” for the S&P 500 and the FED’s balance sheet – with all signs pointing to the latter tightening in September – a move lower for both variables will likely occur over the medium term.
Please see below:
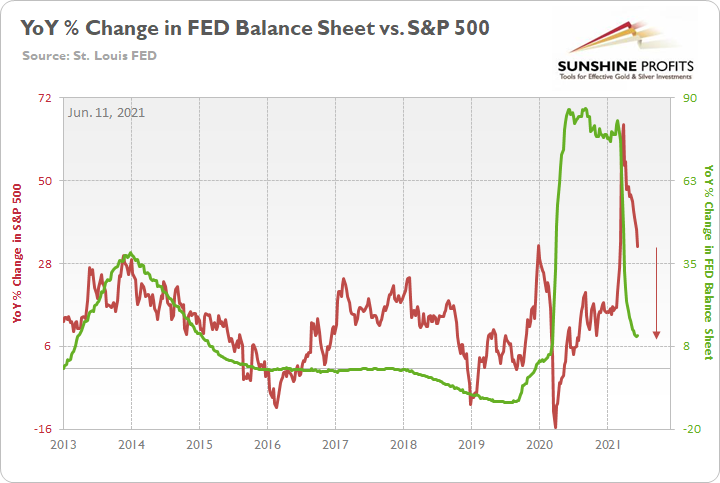
The red line above tracks the YoY percentage change in the S&P 500, while the green line above tracks the YoY percentage change in the FED’s balance sheet. If you analyze the relationship, you can see that investors’ optimism often rises and falls with the pace of the FED’s asset purchases. To that point, the FED’s YoY rate of expansion of its balance sheet peaked (for good) during the third week of February and has been in free fall ever since. Similarly, the S&P 500’s YoY rate of expansion peaked during the third week of March and has declined substantially.
The bottom line? With the weekly metric hitting a 2021 low on Jun. 3 and a reduction of the FED’s bond-buying program poised to push the YoY percentage change into negative territory in the coming months (again, likely in September), the S&P 500 is slowly running out of gas.
In conclusion, the FED has mesmerized the investing public once again, and saving the day doesn’t even require the central bank to do anything anymore. However, with reality undefeated and a major regime shift likely to occur in September, there are only a few hours left until the clock strikes midnight. Moreover, with bond market imbalances at or near their all-time highs, the PMs will likely detest the forthcoming climax. Think about it: if the PMs can only muster tepid rallies when the fundamentals are historically (though synthetically) tilted in their favor, the price action could get ugly once the sanity finally prevails.
Thank you for reading our free analysis today. Please note that the above is just a small fraction of the full analyses that our subscribers enjoy on a regular basis. They include multiple premium details such as the interim targets for gold and mining stocks that could be reached in the next few weeks. We invite you to subscribe now and read today’s issue right away.
Sincerely,
Przemyslaw Radomski, CFA
Founder, Editor-in-chief -
A September to Remember: The FED Won’t Tell Until It’s Done
June 10, 2021, 8:52 AMWith inflation risk growing at an unprecedented pace, the FED already knows it has to put its dovish policy back in Pandora’s box. The question is: when?
A Growing Problem
Another day and another all-time high for the U.S. Federal Reserve’s (FED) daily reverse repurchase agreements. While investors haven’t clued in on the meaningful implications, on May 17 the FED sold $209 billion worth of daily reverse repos. On Jun. 9 that figure ballooned to $503 billion.
Please see below:
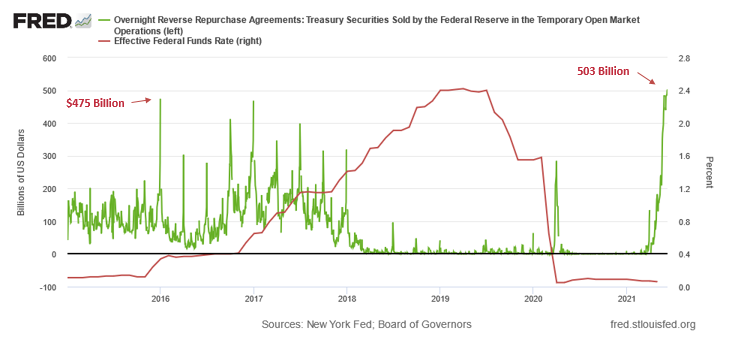
A reverse repurchase agreement (repo) occurs when an institution offloads cash to the FED in exchange for a Treasury security (on an overnight or short-term basis). And with U.S. financial institutions currently flooded with excess liquidity, they’re shipping cash to the FED at an alarming rate.
The green line above tracks the daily reverse repo transactions executed by the FED, while the red line above tracks the U.S. federal funds rate. Moreover, notice what happened the last time reverse repos moved above 400 billion? If you focus your attention on the red line, you can see that after the $400 billion level was breached in December 2015, the FED’s rate-hike cycle began. Thus, with current inflation dwarfing 2015 levels and U.S. banks practically throwing cash at the FED, is this time really different?
Moreover, with market participants eagerly awaiting today’s release of the Consumer Price Index (CPI), the U.S. 10-Year Treasury yield’s recent slide signals that bond investors are all-in on the FED’s “transitory” narrative. However, with historical imbalances (I can’t stress this enough) reaching new heights, investors’ faith in the FED is at extreme levels. For one, with the core Personal Consumption Expenditures (PCE) Index (released on May 28), recording its highest year-over-year (YoY) percentage increase since 1992, the spread between the U.S. 10-Year Treasury yield and the core PCE Index is now at its lowest level since 1975.
Please see below:
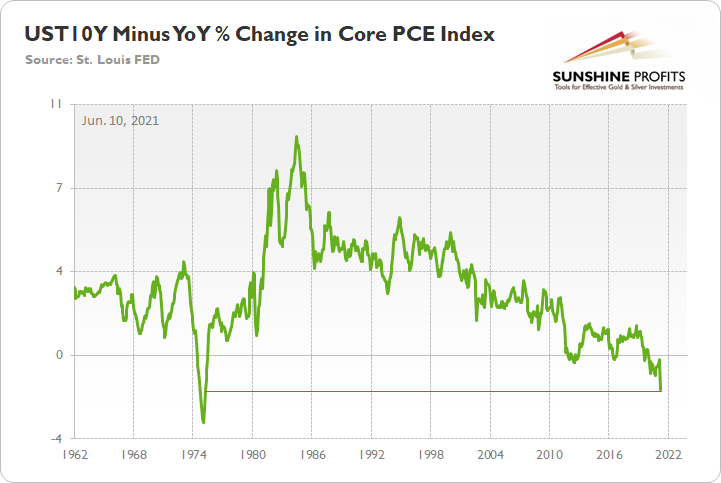
To explain, the green line above subtracts the YoY percentage change in the core PCE Index from the U.S. 10-Year Treasury yield. And because it’s prudent to analyze the latter’s performance relative to realized inflation, the spread reveals that the U.S. 10-Year Treasury yield is pushing the limits of historical precedent.
Furthermore, research from Scotiabank emphasizes that bond market investors’ compliancy is at an all-time high.
Please see below:
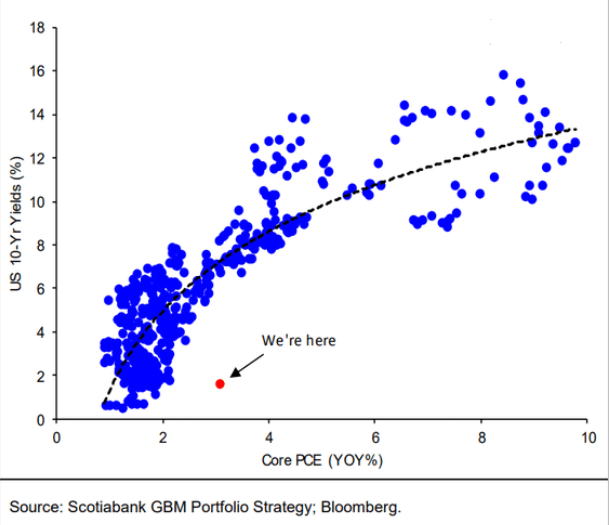
To explain, the blue dots above depict the U.S. 10-Year Treasury yield during various YoY percentage changes in the core PCE Index. If you analyze the relationship, you can see that when the core CPI increases, the U.S. 10-Year Treasury yield often follows suit. However, if you analyze the red dot near the bottom of the chart, you can see that the U.S. 10-Year Treasury yield has completely decoupled from fundamental reality. To that point, since 1978, every time the YoY percentage change in the core PCE Index exceeded 3%, the U.S. 10-Year Treasury yield was north of 6%. Thus, with inflation still surging, a reversion to the mean could light plenty of fireworks across Wall Street.
If that wasn’t enough, not only is the bond market out of touch with reality but also the stock market is blindly following the “transitory” narrative. Case in point: with the core CPI’s 3% rise in April, on a relative basis, the S&P 500’s trailing price-to-earnings (P/E) ratio is currently the second-highest on record.
Please see below:
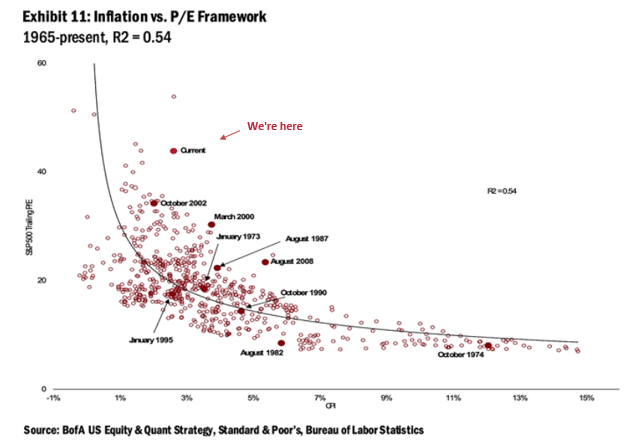
To explain, the red dots above depict the S&P 500’s trailing P/E ratio during various YoY percentage changes in the core CPI. If you analyze the dot labeled “current,” you can see that with the YoY percentage change in the core CPI at 3%, the S&P 500’s trailing P/E ratio has exceeded 40 only one other time in history. As a result, the FED has convinced investors to throw all caution to the wind.
However, with the Commodity Producer Price Index (PPI) signaling further inflationary pressures ahead, I warned on May 14 that the latest print implies another ~5.50% YoY percentage increase in the headline CPI. For context, the consensus estimate is 4.70%.
I wrote:
The commodity PPI surged by 17.25% YoY in April. And if you exclude the 17.36% YoY jump in July 2008, it was the largest YoY percentage increase since December 1974. For context, the commodity PPI often leads the headline CPI and that’s why tracking the former’s movement is so important. Moreover, reconnecting with the green line implies a ~5.50% YoY percentage increase in the headline CPI.
Please see below:
The Tapering Climax Is Near
In addition, while I’ve mentioned on several occasions that FED officials already know they have to taper (they just don’t want to disclose it publicly and cause a sell-off in the stock and bond markets), their divergent messaging is another sign that a climax is approaching.
Please see below:
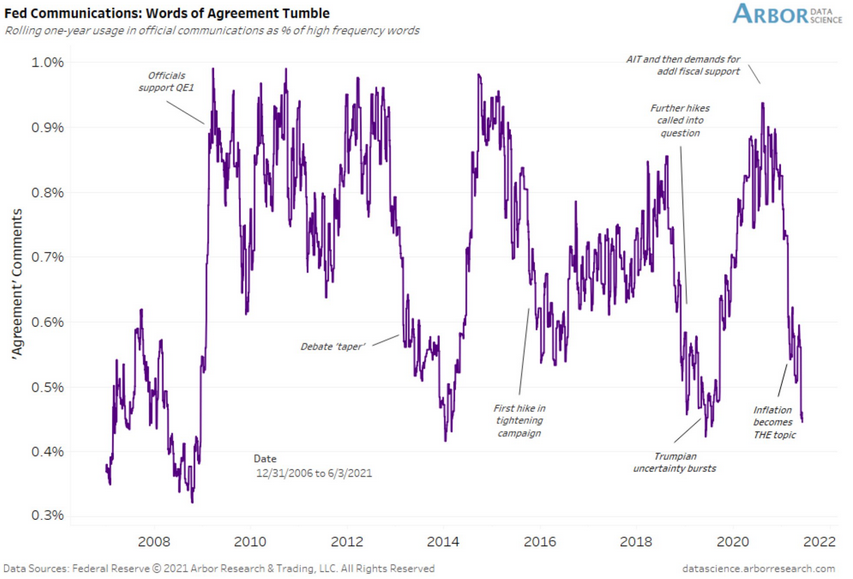
To explain, Arbor Data Science tracked FED officials’ “words of agreement” during various speaking arrangements. When the purple line is rising, it means that FED officials all support the same narrative. Conversely, when the purple line is falling, it means that FED officials are sending conflicting signals. If you focus your attention on the right side of the chart, you can see that divergent rhetoric is now at its highest level since the taper tantrum in 2013 and when the FED reversed course in 2019 following a barrage of interest rate hikes (depicted by the purple lines being extremely low). The bottom line? With the group now splintered, it has become increasingly clear that QE is nearing a meaningful reversal.
But when should we expect an announcement?
Well, with the Jun. 15/16 policy meeting not leaving enough time for FED officials to “communicate very early, very often what we’re going to do” (swords of Philadelphia FED President Patrick Harker) and the Jul. 27/28 policy meeting excluding a summary of the FED’s economic projections either, the Jackson Hole Economic Symposium (late August) or the Sep. 21/22 policy meeting is when the fireworks will likely begin. For a visual representation of the expected timeline, please see below:
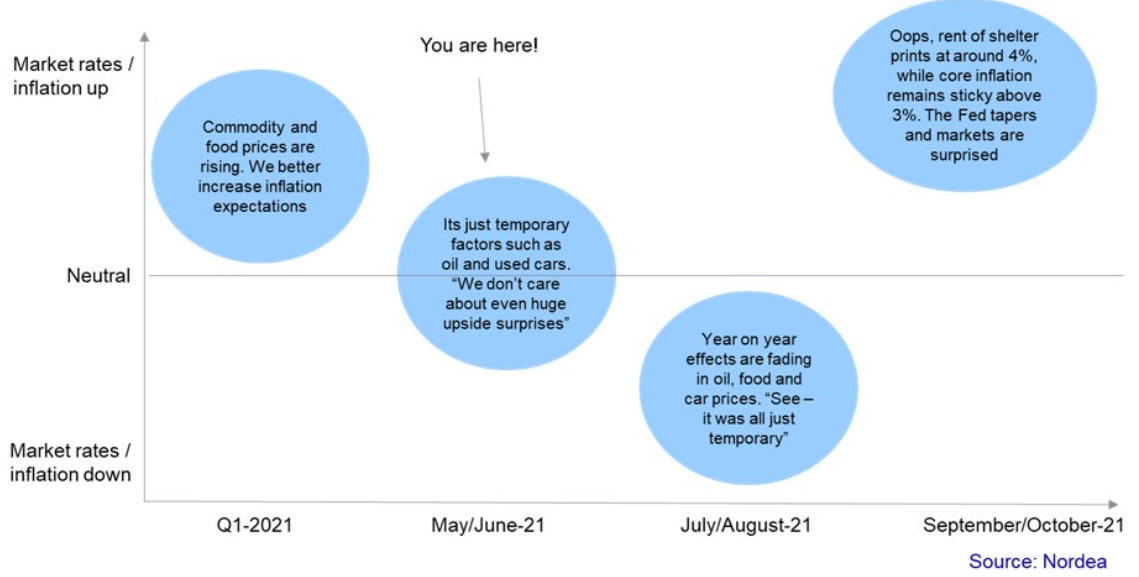
To explain, with market participants still loyal followers, the FED’s omniscience currently reigns supreme. Moreover, with YoY inflation surges likely to decline in July/August, FED officials will cite base effects as reasons for the initial trepidation. For context, though, it’s important to remember that the core PCE Index surged by 0.66% month-over-month (MoM), the highest MoM percentage increase since 1983, while the core CPI surged by 0.92% MoM, the highest MoM percentage increase since 1981. As a result, the concept of base effects is largely a distraction. More importantly, though, with the Shelter CPI accounting for more than 30% of the movement of the headline CPI and often lagging Apartment List data by three months, we could be in for a September to remember.
Further supporting the timeline, with the U.S. Bureau of Labor Statistics (BLS) job openings completely decoupling from U.S. nonfarm payrolls, the FED has a cover until September.
With the U.S. Bureau of Labor Statistics (BLS) revealing on Jun. 8 that U.S. job openings surged to an all-time high of 9.286 million – and came in well above the consensus estimate of 8.300 million – the only thing depressing the U.S. labor market are ill-advised enhanced unemployment benefits.
Please see below:
To explain, the red line above tracks U.S. nonfarm payrolls, while the green line above tracks U.S. job openings. If you analyze the relationship, you can see that the latter is often a strong predictor of the former. However, with enhanced unemployment benefits still in effect until mid-to-late June or early July (across ~25 states) – and nationwide until Sep. 6 (expected) – the shift likely won’t occur overnight. But once the benefits expire, U.S. nonfarm payrolls will likely spike in August (reflecting July’s data) and September (reflecting August’s data) and lift the U.S. 10-Year Treasury yield and the USD Index in the process.
The bottom line? With a potential spike in the Shelter CPI likely to coincide with a major resurgence in the U.S. labor force, September has all of the necessary ingredients to force the FED’s hand.
Forecasts Are Soaring
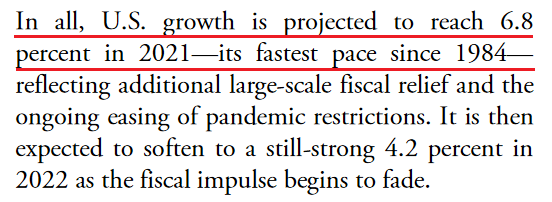
As further evidence, the World Bank released its Global Economic Prospects report on Jun. 8. And with the group increasing its 2021 U.S. real GDP growth forecast from 3.5% (in January) to 6.8%, the FED is already playing with fire.
An excerpt from the report read:
“The U.S. economy is recovering more quickly than its peers from the pandemic shock, supported by greater amounts of fiscal relief. Surging personal income has boosted consumption, which is expected to firm as households reduce their savings rate from historically high levels.”
 Source: the World Bank
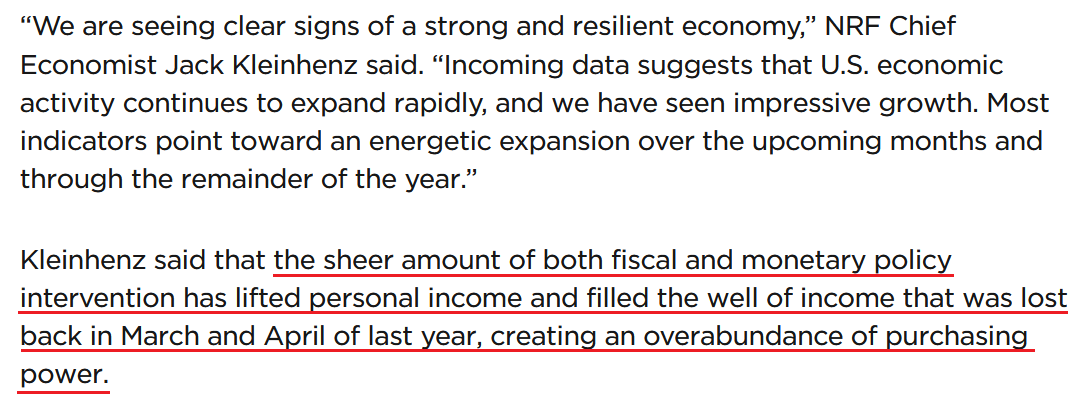
On top of that, The National Retail Federation (NRF) projected on Jun. 9 that “retail sales will now grow between 10.5% and 13.5% ” (an increase from the 6.5% projected previously) and for “full-year GDP growth to approach 7%, compared with the 4.4% and 5% forecasted earlier this year.”
Please see below:
 Source: NRF
More importantly, though, the last time the U.S. economy reached this level of real GDP growth (1984), the USD Index and the U.S. 10-Year Treasury yield hit highs of 151 and 11% respectively. And while that level of strength is unlikely to emerge this time around, it’s simply a reminder of how low the current readings are relative to prospective GDP growth.
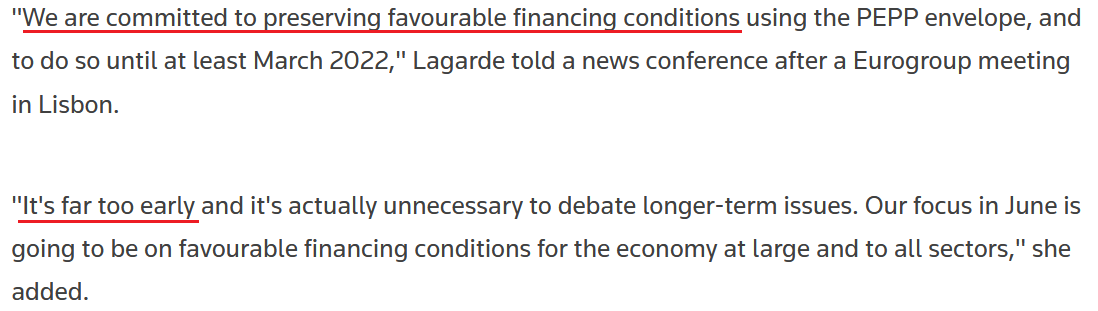
On the opposite end of the spectrum, the European Central Bank (ECB) holds its June policy meeting today. And with both realized inflation and economic growth significantly underperforming the U.S., I wrote on Apr. 27 that hawkish rhetoric is likely more semblance than substance.
Recent whispers of the ECB tapering its bond-buying program are extremely premature. With the European economy still drastically underperforming the U.S., it’s actually more likely that the ECB increases the pace of its bond-buying program.
To that point, ECB President Christine Lagarde said the following on May 21:
 Source: Reuters
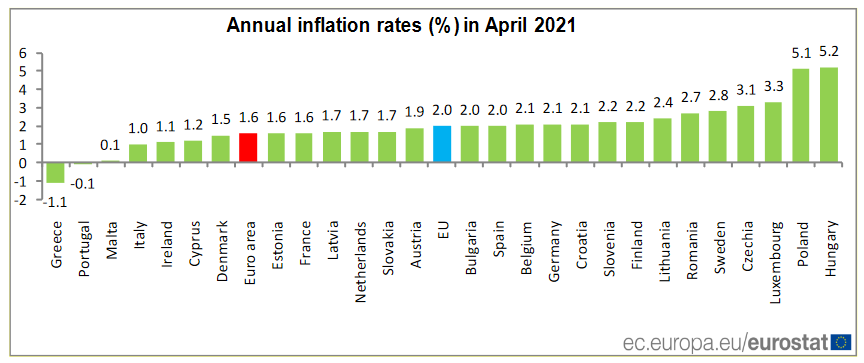
Furthermore, Societe Generale economist Anatoli Annenkov said on Jun. 9 that “Given the markets' nervousness about taper talk and the ECB's firm wish to distance itself from the taper preparations in the U.S. over the summer, the ECB is likely to signal unchanged purchases until September.” However, with Eurozone inflation rising by only 1.60% YoY in April (the red bar below) compared with 4.20% YoY in the U.S., even September seems optimistic.
In conclusion, the FED has opened up Pandora's box, and it could come back to haunt the central bank over the medium term. With inflation surging and pent-up demand yet to be unleashed in a meaningful way, the longer the FED pours on the gasoline, the larger the fire grows. Moreover, with the USD Index and the U.S. 10-Year Treasury yield historically undervalued relative to realized inflation and GDP growth expectations, it’s all just as the former New York FED President William Dudley said in 1999, “too much of a good thing can be a bad thing." The bottom line? With the PMs enjoying a fundamental environment that we may never see again, once sanity prevails, the metals are unlikely to enjoy the dose of reality.
…
Thank you for reading our free analysis today. Please note that the above is just a small fraction of the full analyses that our subscribers enjoy on a regular basis. They include multiple premium details such as the interim targets for gold and mining stocks that could be reached in the next few weeks. We invite you to subscribe now and read today’s issue right away.
Sincerely,
Przemyslaw Radomski, CFA
Founder, Editor-in-chief -
Gold: Do Not Underestimate My… Copper?
June 9, 2021, 9:33 AMCopper is often overlooked when looking for gold price movement clues. But this time, its breakout invalidation may have the high ground.
Do you know what the key commodity in today’s world is? Crude oil. It’s the most commonly used good on the planet. In terms of versatility and number of applications, silver is not far behind, but there is also one more market that definitely comes to one’s mind when one hears “world commodity” – copper. And for a good reason – while it doesn’t have as unique properties as silver or gold, copper is much cheaper and thus more widely available.
Consequently, what’s happening in copper prices might have quite profound effects on the rest of the world, including the precious metals market. And the thing is: something very important happened to the price of copper recently.
The Importance of the Brown Metal
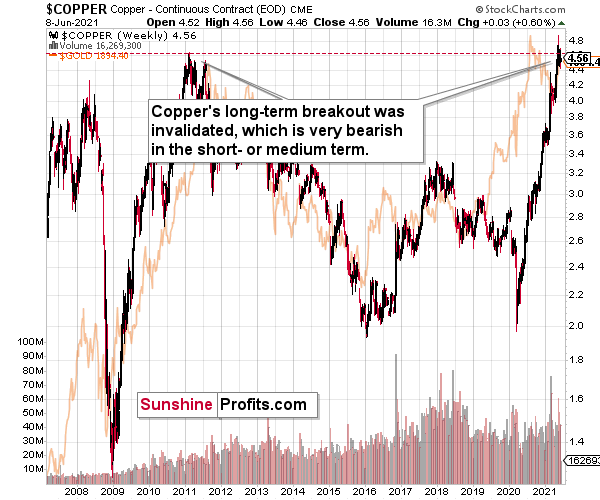
Namely, copper has just invalidated its breakout to new highs, which means that – just like in the case of gold in August 2020 – it wasn’t strong enough to soar higher. Well, it’s not to say that copper is weak, as it has more than doubled its price since the 2020 lows. However, it does mean that it’s likely time for a bigger corrective downswing, especially given that we haven’t seen one in many months. For instance, when gold invalidated its breakout above the 2011 high despite very bullish fundamentals, it meant that forecasting gold at lower levels was very much justified.
Likewise, when copper failed to hold its breakout above the 2008 high back in 2011, it was followed by a multi-year decline. Will the same happen this time? I wouldn’t bet on that given the amount of money being pumped into the system, but even if this is not the case, copper is likely to suffer a significant drawdown on a temporary basis. No market can move up or down in a straight line, and neither copper nor gold nor silver are exceptions to this rule.
Ok, but why is it important for the precious metals investors?
Because of two things:
- Both markets tend to move in a big way at similar times. The more local moves can vary, but the really big price moves are usually aligned. For example, the 2008 – 2011 rally and the fact that they both bottomed in late-2015 / early-2016.
- The copper price is quite closely related to the general stock market and the former’s inability to hold above its previous highs seems to be an indication of a change in the trend in the general stock market as well.
As I wrote before, the general stock market’s decline is not required for the precious metals sector to decline, but it would likely exacerbate the decline, just like it did in 2008 – especially in the case of silver and mining stocks.
And speaking of stocks, let’s check what the S&P 500 is doing.
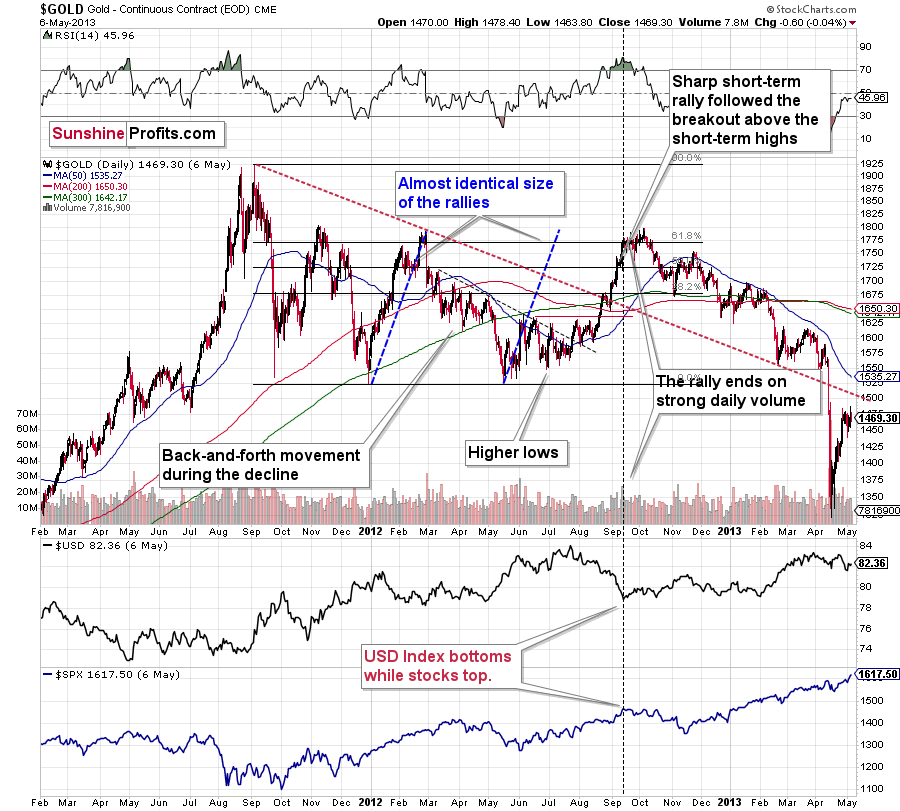
The markets are self-similar (which is another way of saying that they have a fractal nature), which generally means that while the history tends to rhyme, it also tends to rhyme in similar shapes of alike or various sizes.
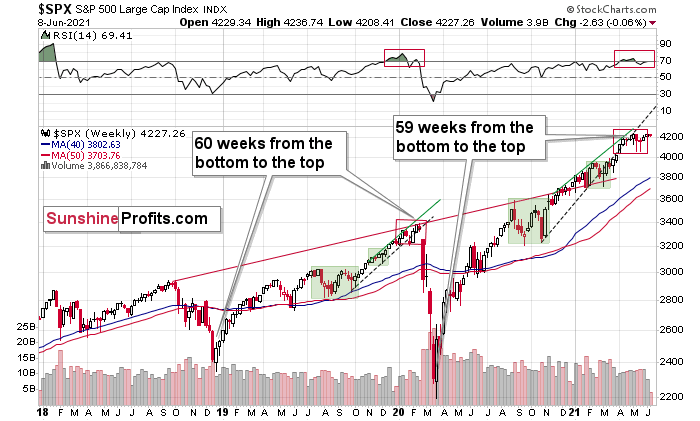
For example, the rally from 2018–2020 seems very similar to the rally from 2020 to the present. Both rallies started after a sharp decline, and the first notable correction took the form of back-and-forth trading around the previous high. I marked those situations with big rectangles.
Then the rally continued with relatively small week-to-week volatility. I created rising support lines based on the final low of the broad short-term consolidation and the first notable short-term bottom.
This line was broken, and some back-and-forth trading followed, but it was only about half of the previous correction in terms of price and time.
Then, we saw a sharp rally that then leveled off. And that was the top. The thing that confirmed the top was the visible breakdown below the rising support line right after stocks invalidated a tiny breakout to new highs. That’s what happened in February 2020, and that’s what seems to be taking place right now.
Back in 2020, the rally ended when the weekly RSI moved above 70 once again and when the S&P moved slightly to its new highs. While the history doesn’t have to repeat itself to the letter, if we see another small move higher – to new highs – that also takes the RSI above 70, please keep in mind that it’s not really a bullish development, but actually history forming its final rhyme. And the implications appear bearish for the precious metals sector, as it’s likely to be hit by the first wave of stock market declines – just like it was the case in 2008, 2020, and… 1929.
Moreover, mining stocks’ performance relative to hold has been heralding the declines across the precious metals market for some time now.
While gold is not doing much today, it’s important to note that yesterday it moved quite close to its previous highs (and visibly above $1,900) before declining. And how did gold miners react?
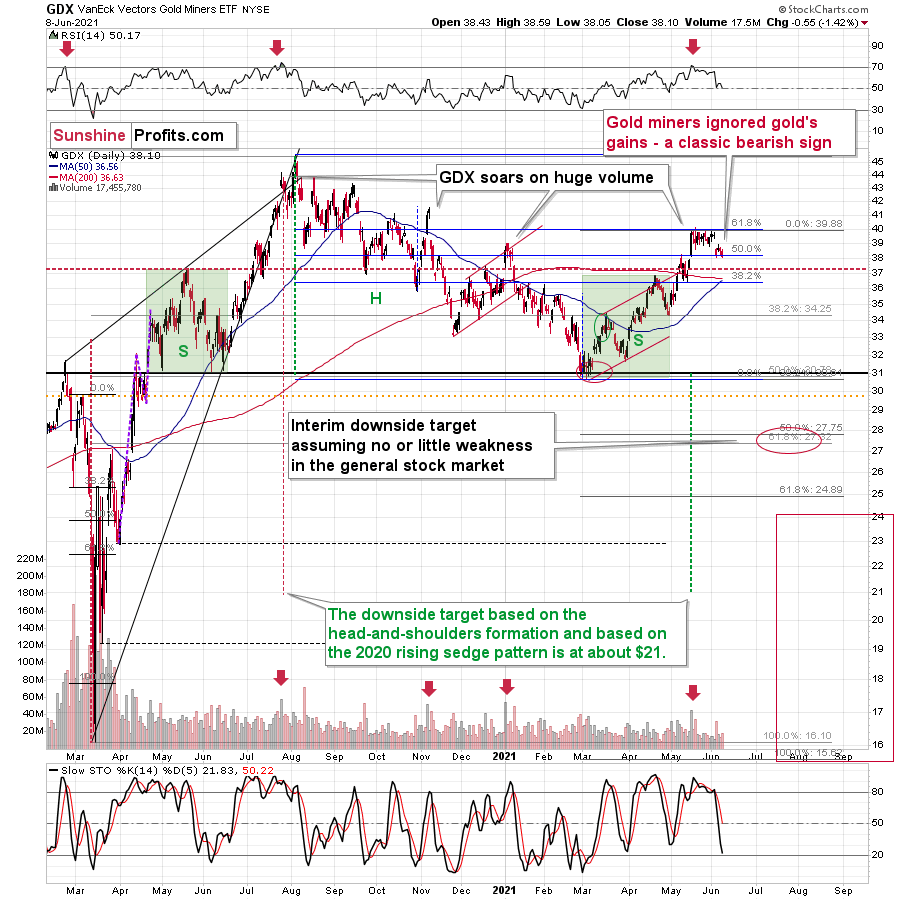
In short, they didn’t. And the GDX ETF has just closed at a new monthly low.
Even without considering the invalidation of the breakout to new highs, the sell signal from the RSI and stochastic indicators, and even without noticing that the GDX corrected to its 61.8% Fibonacci retracement without invalidating it, one can clearly see that gold stocks refused to follow gold higher during the most recent rebound. This is bearish – and quite profoundly so.
Thank you for reading our free analysis today. Please note that the above is just a small fraction of the full analyses that our subscribers enjoy on a regular basis. They include multiple premium details such as the interim targets for gold and mining stocks that could be reached in the next few weeks. We invite you to subscribe now and read today’s issue right away.
Sincerely,
Przemyslaw Radomski, CFA
Founder, Editor-in-chief -
Gold Stocks, Silver: The Fire in the Precious Forest
June 8, 2021, 9:32 AMYou can’t tell if the forest is burning just by touching one tree and not looking around. The gold tree might feel cool now, but what about the rest?
Taking into consideration the recent quick upswing in gold, investors are asking: “Did gold really top on Jun. 1?” And gold stocks are replying: most likely yes.
The above is the essence of what the charts are currently saying, but let’s have look in more detail.
Look at the Bigger Picture
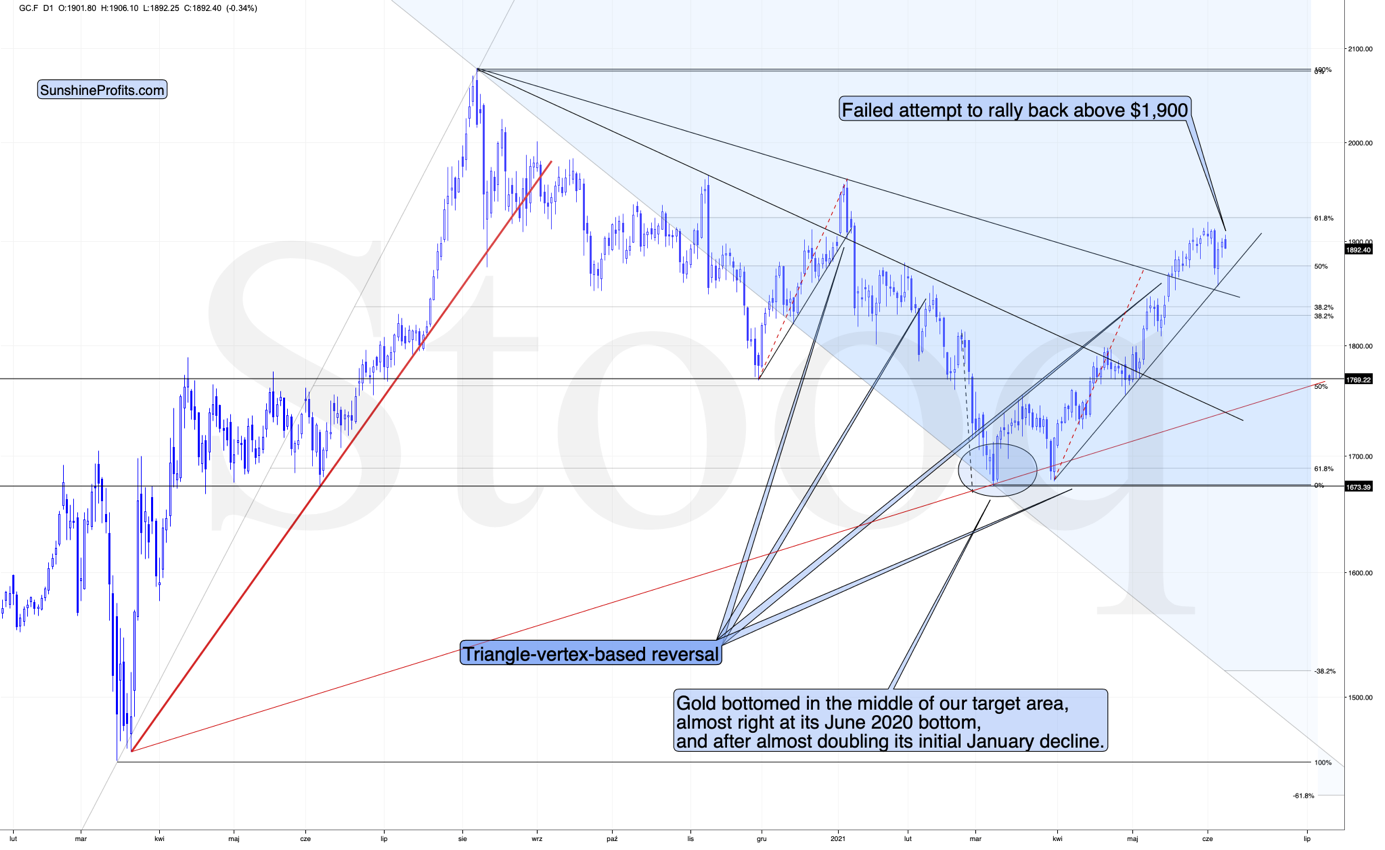
In short, gold recovered right after declining profoundly and reaching its rising support line. At this time – when looking at the above chart alone, and without considering any analogies to 2008 and 2012 – it seems that gold may move either way. Perhaps the next short-term move will be up since the rising short-term support line has held.
But this approach would be similar to saying that there is no fire in the entire forest just because the tree I’m touching right now is of normal temperature. And other key parts of the precious metals sector – gold stocks and silver – are providing us with extra insights, which are making the narrative decisively bearish.
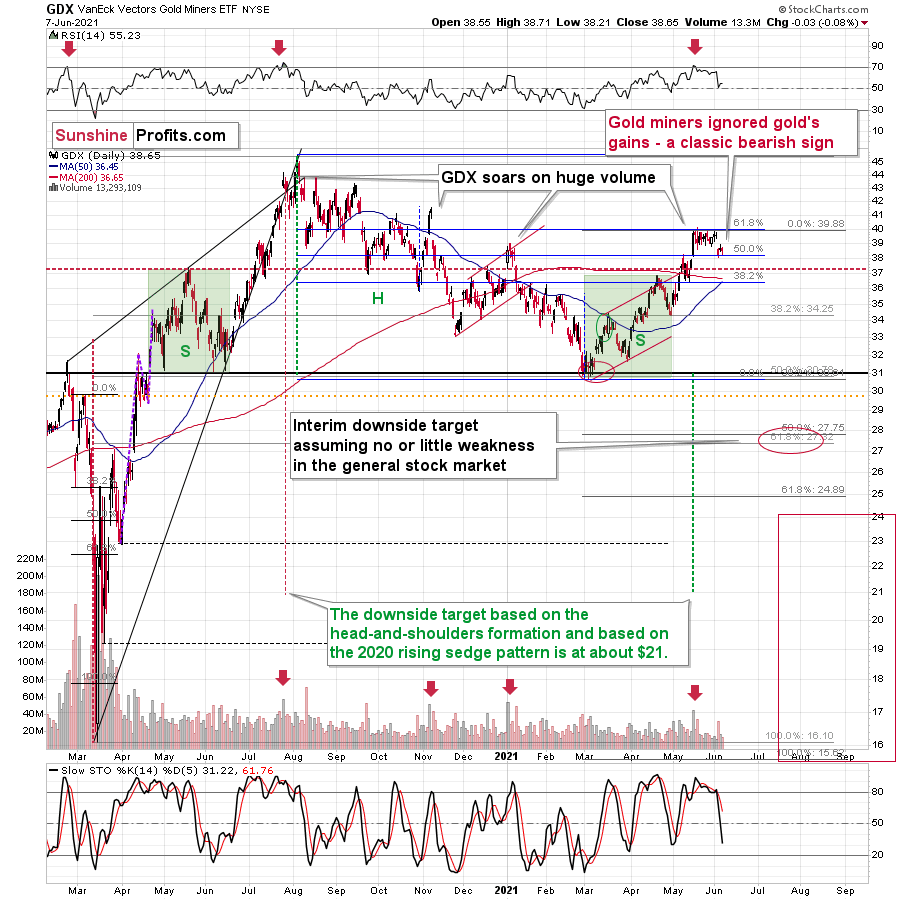
Even without considering the invalidation of the breakout to new highs, the sell signal from the RSI and stochastic indicators, and even without noticing that the GDX corrected to its 61.8% Fibonacci retracement without invalidating it, one can clearly see that gold stocks refused to follow gold higher during the most recent rebound. This is bearish and quite profoundly so.
And silver? Has it maybe indicated something that gold hasn’t?
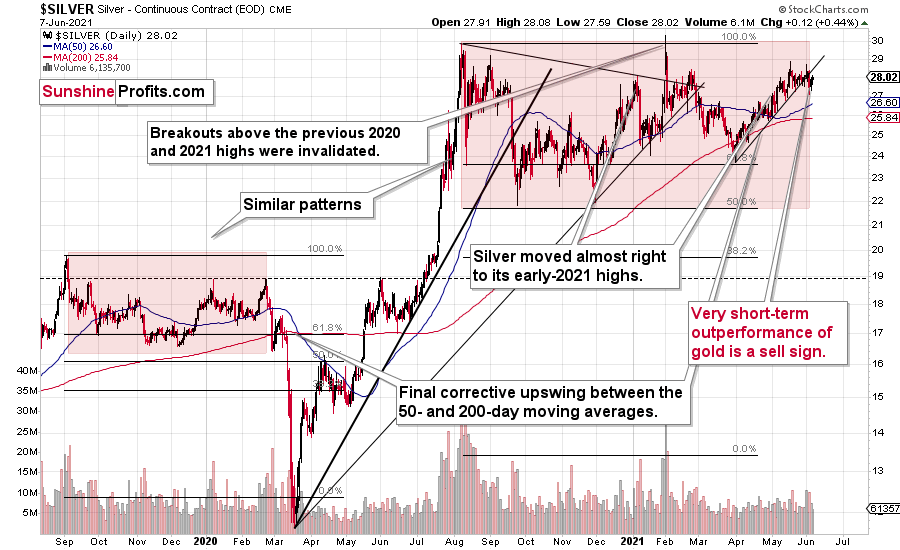
Of course it has. Silver is after a confirmed breakdown below its rising short-term support line, and this breakdown took place right after silver failed – for the fourth time – to break above its early-January high. And, more importantly, it happened shortly after silver outperformed gold on an intraday basis, just like it tends to do right at the tops.
The analogies to 2008 and 2012 in the case of gold are also quite clear:
For more context, I wrote on Jun. 4:
The analogies to how the situation in gold developed in 2008 and 2012, provides us with an extremely bearish price prediction for gold. Many other factors are pointing to these similarities, and two of them are the size of the correction relative to the preceding decline and to the previous rally. In 2012 and 2008, gold corrected to approximately the 61.8% Fibonacci retracement level. Gold was very close to this level this year, and since the history tends to rhyme more than it tends to repeat itself to the letter, it seems that the top might already be in.
In both years, 2008 and 2012, there were three tops. Furthermore, the rallies that took gold to the second and third top were similar. In 2008, the rally preceding the third top was bigger than the rally preceding the second top. In 2012, they were more or less equal. I marked those rallies with blue lines in the above chart – the current situation is very much in between the above-mentioned situations. Also, the current rally is bigger than the one that ended in early January 2021 but not significantly so.
Remember what happened when gold previously attempted to break above major long-term highs? It was in 2008 and gold was breaking above its 1980 high. Gold wasn’t ready to truly continue its bull market without plunging first. This downswing was truly epic, especially in the case of silver and mining stocks; and now even gold’s price patterns are like what we saw in 2008.
My previous comments on the analogies to 2008 and 2012 remain up-to-date:

Back in 2008, gold corrected to 61.8% Fibonacci retracement, but it stopped rallying approximately when the USD Index started to rally, and the general stock market accelerated its decline.
Taking into consideration that the general stock market has probably just topped, and the USD Index is about to rally, then gold is likely to slide for the final time in the following weeks/months. Both above-mentioned markets support this bearish scenario and so do the self-similar patterns in terms of gold price itself.
What would change my mind with regard to gold itself? Perhaps if it broke above its January 2021 highs and confirmed this breakout. This would be an important technical indication on its own, but it would also be something very different from what happened in 2008 and 2012. If that happened along with strength in mining stocks, it would be very bullish. Still, if the above happened, and miners didn’t react at all or they declined, it would not be bullish despite the gains in the gold price itself.
The March 2021 low formed well below the previous low, but as far as other things are concerned, the current situation is similar to what happened in 2012.
The relatively broad bottom with higher lows is what preceded both final short-term rallies – the current one, and the 2012 one. Their shape as well as the shape of the decline that preceded these broad bottoms is very similar. In both cases, the preceding decline had some back-and-forth trading in its middle, and the final rally picked up pace after breaking above the initial short-term high.
Interestingly, the 2012 rally ended on huge volume, which is exactly what we saw also on May 19 this year. Consequently, forecasting much higher silver or gold prices here doesn’t seem to be justified based on the historical analogies.
The thing I would like to emphasize here is that gold didn’t form the final top at the huge-volume reversal on Sep. 13, 2012. It moved back and forth for a while and moved a bit above that high-volume top, and only then the final top took place (in early October 2012).
The same happened in September and in October 2008. Gold reversed on huge volume in mid-September, and it was approximately the end of the rally. The final top, however, formed after some back-and-forth trading and a move slightly above the previous high.
Consequently, the fact that gold moved a bit above its own high-volume reversal (May 19, 2021) is not an invalidation of the analogy, but rather its continuation.
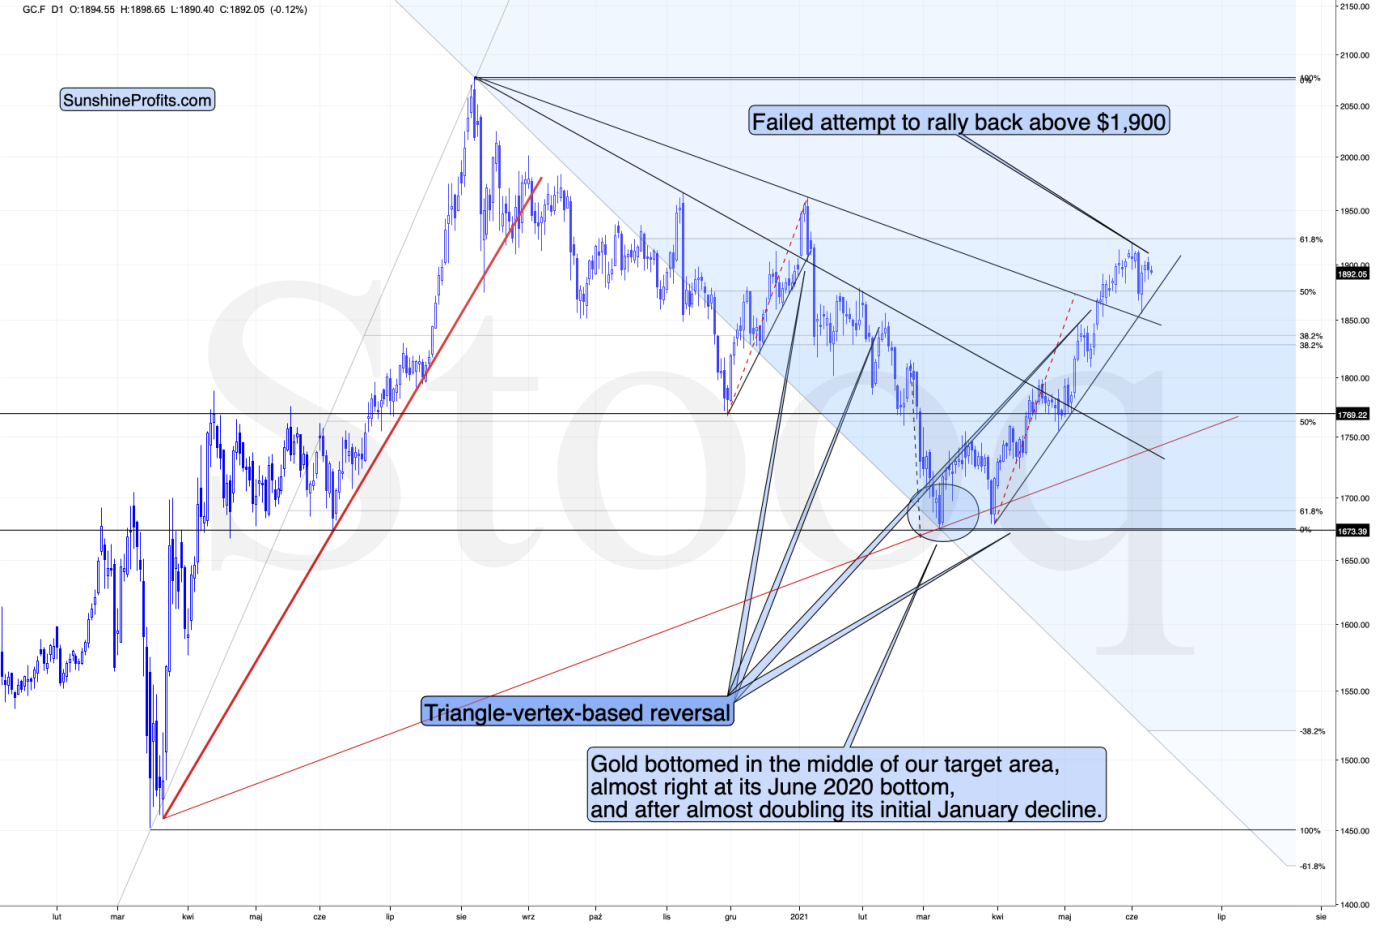
Moreover, back in 2008 and 2012, gold corrected to its 61.8% Fibonacci retracement before sliding profoundly for the last time. That’s almost exactly what we saw on June 1. Gold was just about $4 away from the 61.8% retracement, which means that it was practically right at it given the long-term point of view.
On top of that, with the Fed’s confidence game won or lost by whether or not inflation proves “transitory,” wouldn’t the central bank appreciate lower gold prices? If you think about it, it would be awfully convenient for the price of gold to decline in order to prove the point of the transitory nature of inflation.
Now, as you know, I’m not a fan of all the conspiracy theories that are out there, and I’m not the first to shout gold manipulation or silver manipulation every time the yellow or while metal goes down, but I also know that being realistic is one of my strengths. With the situation being what it is, and since the communities of top investment bankers and the community of officials interlace, I think that we have yet another reason to expect that the gold price is going to slide in the following weeks/months.
In addition, while gold has reached its dashed rising support line, the implications of its triangle-vertex-based reversal points remain much more significant. To that point, even if the yellow metal rises to the 61.8% Fibonacci level, it doesn’t change the medium-term outlook. For context, gold rallied to the 61.8% Fibonacci level in 2012 before suffering a profound drawdown. The bottom line? While short-term strength is not my base case, if gold happens to bounce, it’s likely the last “hurrah!” before the yellow metal succumbs to the bearish reality.
Moreover, do you know what else happened in 2008 and 2012 when gold topped? Gold stocks had been underperforming gold, and they had actually started their decline sooner. That’s exactly what we are seeing right now, and that’s what the most recent lack of strength in gold stocks confirms.
The history is rhyming, and the next huge move in gold is not likely to be to the upside; we should rather prepare for a slide.
Thank you for reading our free analysis today. Please note that the above is just a small fraction of the full analyses that our subscribers enjoy on a regular basis. They include multiple premium details such as the interim targets for gold and mining stocks that could be reached in the next few weeks. We invite you to subscribe now and read today’s issue right away.
Sincerely,
Przemyslaw Radomski, CFA
Founder, Editor-in-chief -
Gold Miners: Which Door Will Investors Choose?
June 7, 2021, 9:40 AMWith the current situation suggestive of a Monty Hall problem, investors are clinging to the first, bullish door. But what if a different option is more likely?
The Monty Hall problem is a form of a probability puzzle, and what it shows is immensely unintuitive. Suppose you are on a game show, and you need to choose one of three doors. Behind one of them is a car and behind the others, goats. You pick a door, and then the host (who knows what’s behind them) opens one of the remaining doors, behind which there is a goat. The host now asks: “Do you want to change your door choice for the remaining doors?” So, what do you do?
It turns out that if you change the door, the probability of winning the car increases… two times! You have a 2/3 chance, instead of a 1/3. Tremendously unintuitive, indeed, but what if the same is happening on the market now? With a bullish prospect representing the door of the first choice, and the technicals and fundamentals the host’s help, wouldn’t it be safer to switch the door to win eventually?
The Gold Miners
With investors stuck in their own version of the Monty Hall problem, guessing ‘what's behind door No.1’ has market participants scrambling to find the bullish gateway. However, with doors two and three signaling a much more ominous outcome for gold, silver and mining stocks, the key to unlocking their future performance may already be hiding in plain sight.
Case in point: with the analogue from 2012 signaling a forthcoming rush for the exits, there are no fire escapes available for investors that overstay their welcome. And because those who cannot remember the past are condemned to repeat it (George Santayana), doubters are likely to lose more than just their pride.
While the most recent price action is best visible in the short-term charts, it is actually the HUI Index’s very long-term chart that provides the most important details (today’s full analysis includes 44 charts, but the graph below is one of the key ones). The crucial thing happened two weeks ago, and what we saw last week was simply a major confirmation.
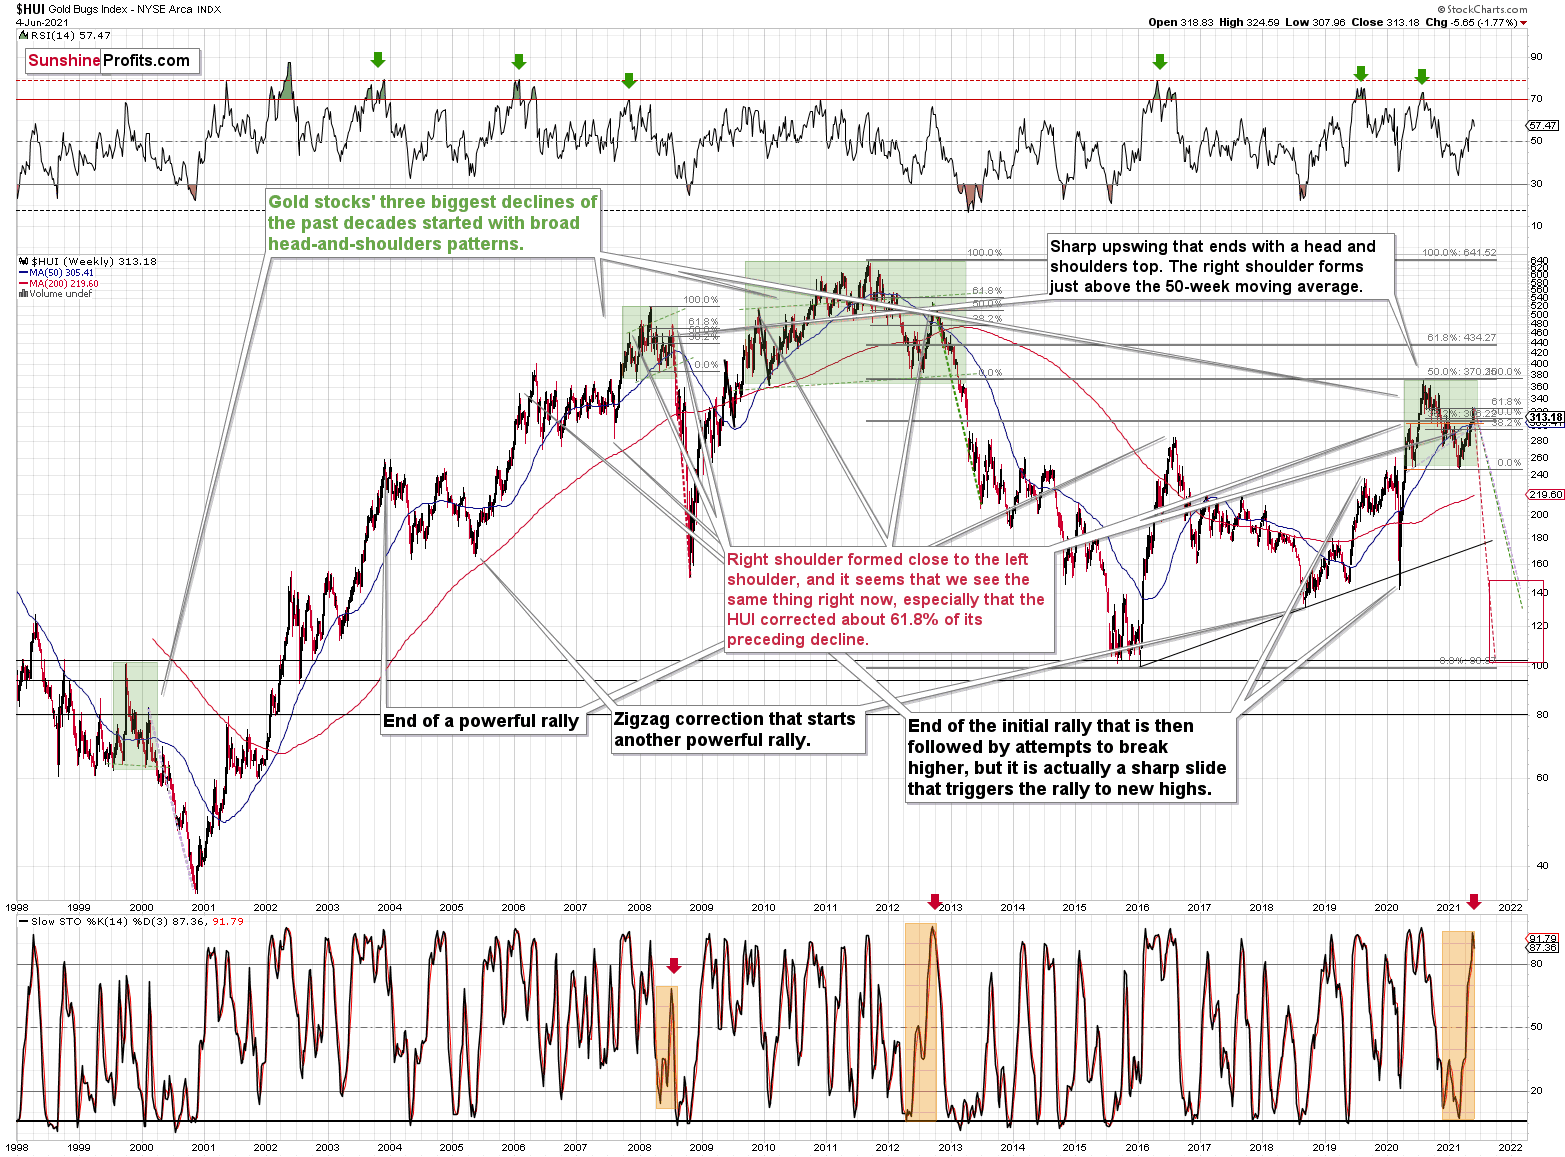
What happened two weeks ago was that gold rallied by almost $30 ($28.60) and at the same time, the HUI – a flagship proxy for gold stocks… Declined by 1.37. In other words, gold stocks completely ignored gold’s gains.
That shows exceptional weakness on the weekly basis and is a very bearish sign for the following weeks. And it has important historical analogies.
Back in 2008, right before a huge slide, in late September and early October gold was still moving to new intraday highs, but the HUI Index was ignoring that, and then it declined despite gold’s rally. However, it was also the case that the general stock market declined then. If stocks hadn’t declined back then so profoundly, gold stocks’ underperformance of gold would likely be present but more moderate. In fact, that’s exactly what happened in 2012.
The HUI Index topped on September 21, 2012, and that was just the initial high in gold. At that time the S&P 500 was moving back and forth with lower highs – so a bit more bearish than the current back-and-forth movement in this stock index. What happened in the end? Gold moved to new highs and formed the final top (October 5, 2012). It was when the S&P 500 almost (!) moved to new highs, and despite both, the HUI Index didn’t move to new highs.
The similarity to how the final counter-trend rally ended in 2012 (and to a smaller extent in 2008) ended is uncanny. The implications are very bearish for the following weeks, especially given that the gold price is following the analogy to 2008 and 2012 as well.
All the above is what we had already known last week. In that case, let’s move to last week’s confirmation. The thing is that the stochastic oscillator just flashed a clear sell signal. This is important on its own as these signals often preceded massive price declines. However, extremely bearish implications come from combining both: the sell signal and the analogy of 2008 and 2012. Therefore, we should consider the sell signal in the HUI-based stochastic oscillator as yet another sign serving as confirmation that the huge decline has just begun.
Thus, if history rhymes, as it tends to, the HUI Index will likely decline profoundly. How low could the gold stocks fall? If the similarity to the previous years continues, the HUI could find medium-term support in the 100-to-150 range. For context, high-end 2020 support implies a move back to 150, while low-end 2015 support implies a move back to 100. And yes, it could really happen, even though it seems unthinkable.
But which part of the mining stock sector is likely to decline the most? In my view, the junior mining stocks.
The Junior Miners
GDXJ is underperforming GDX just as I’ve been expecting it to. Once one realizes that GDXJ is more correlated with the general stock market than GDX is, GDXJ should be showing strength here, and it isn’t. If stocks don’t decline, GDXJ is likely to underperform by just a bit, but when (not if) stocks slide, GDXJ is likely to plunge visibly more than GDX.
Expanding on that point, the GDXJ/GDX ratio has been declining since the beginning of the year, which is remarkable because the general stock market hasn’t plunged yet. And once the general stock market suffers a material decline, the GDXJ ETF’s underperformance will likely be heard loud and clear.
Please see below:
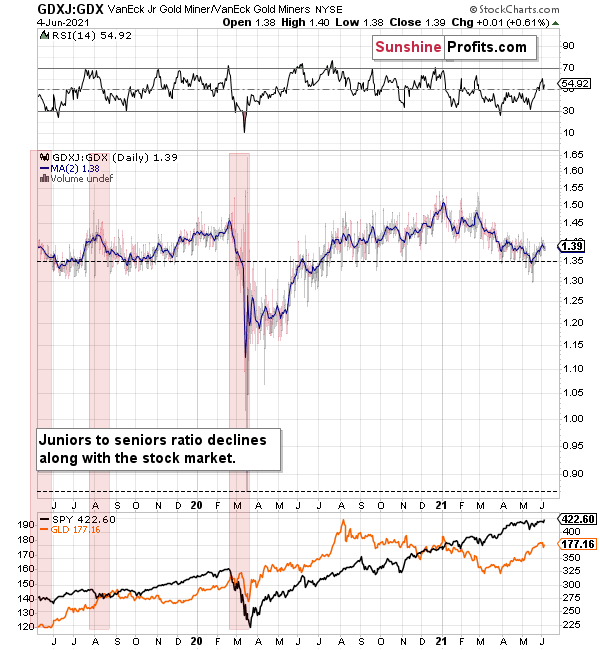
Why haven’t the juniors been soaring relative to senior mining stocks? What makes them so special (and weak) right now? In my opinion, it’s the fact that we now – unlike at any other time in the past – have an asset class that seems similarly appealing to the investment public. Not to everyone, but to some. And this “some” is enough for juniors to underperform.
Instead of speculating on an individual junior miner making a killing after striking gold or silver in some extremely rich deposit, it’s now easier than ever to get the same kind of thrill by buying… an altcoin (like Dogecoin or something else). In fact, people themselves can engage in “mining” these coins. And just like bitcoin seems similar to gold to many (especially the younger generation) investors, altcoins might serve as the “junior mining stocks” of the electronic future. At least they might be perceived as such by some.
Consequently, a part of the demand for juniors was not based on the “sympathy” toward the precious metals market, but rather on the emotional thrill (striking gold) combined with the anti-establishment tendencies (gold and silver are the anti- metals, but cryptocurrencies are anti-establishment in their own way). And since everyone and their brother seem to be talking about how much this or that altcoin has gained recently, it’s easy to see why some people jumped on that bandwagon instead of investing in junior miners.
This tendency is not likely to go away in the near term, so it seems that we have yet another reason to think that the GDXJ ETF is going to move much lower in the following months – declining more than the GDX ETF. The above + gold’s decline + stocks’ decline is truly an extremely bearish combination, in my view.
In conclusion, once gold, silver and mining stocks’ doors finally slam shut, over-optimistic investors will likely go down with the ship. And with the most volatile segments of the precious metals market eliciting the most bearish signals, those left holding the bag will likely wonder how it all went wrong. Moreover, with gold’s relative outperformance signaling waning investors’ optimism, the miners – and more specifically, the GDXJ ETF – will likely suffer the brunt of the forthcoming selling pressure. The bottom line? With the walls closing in on gold, silver and mining stocks, the game show will likely end with investors left empty-handed.
Thank you for reading our free analysis today. Please note that the above is just a small fraction of the full analyses that our subscribers enjoy on a regular basis. They include multiple premium details such as the interim targets for gold and mining stocks that could be reached in the next few weeks. We invite you to subscribe now and read today’s issue right away.
Sincerely,
Przemyslaw Radomski, CFA
Founder, Editor-in-chief


Gold Investment News
Delivered To Your Inbox
Free Of Charge
Bonus: A week of free access to Gold & Silver StockPickers.
Gold Alerts
More-
Status
New 2024 Lows in Miners, New Highs in The USD Index
January 17, 2024, 12:19 PM -
Status
Soaring USD is SO Unsurprising – And SO Full of Implications
January 16, 2024, 8:40 AM -
Status
Rare Opportunity in Rare Earth Minerals?
January 15, 2024, 2:06 PM

