

Briefly: in our opinion, full (300% of the regular position size) speculative short positions in mining stocks are justified from the risk/reward point of view at the moment of publishing this Alert.
Based on the analogy to 2012, gold was likely to take a breather within the decline that could have taken it as high as the 61.8% Fibonacci retracement. And indeed, we did see a breather, but it took gold only a little higher, and it seems that it’s already nearing its end. Consequently, waiting for gold to rally now would be waiting for something that might have already happened.
To clarify, the size of the move is not that important here as the time that gold took to consolidate.
It’s fine to wait for the broader bottom to be formed, and that seemed to be taking place initially.
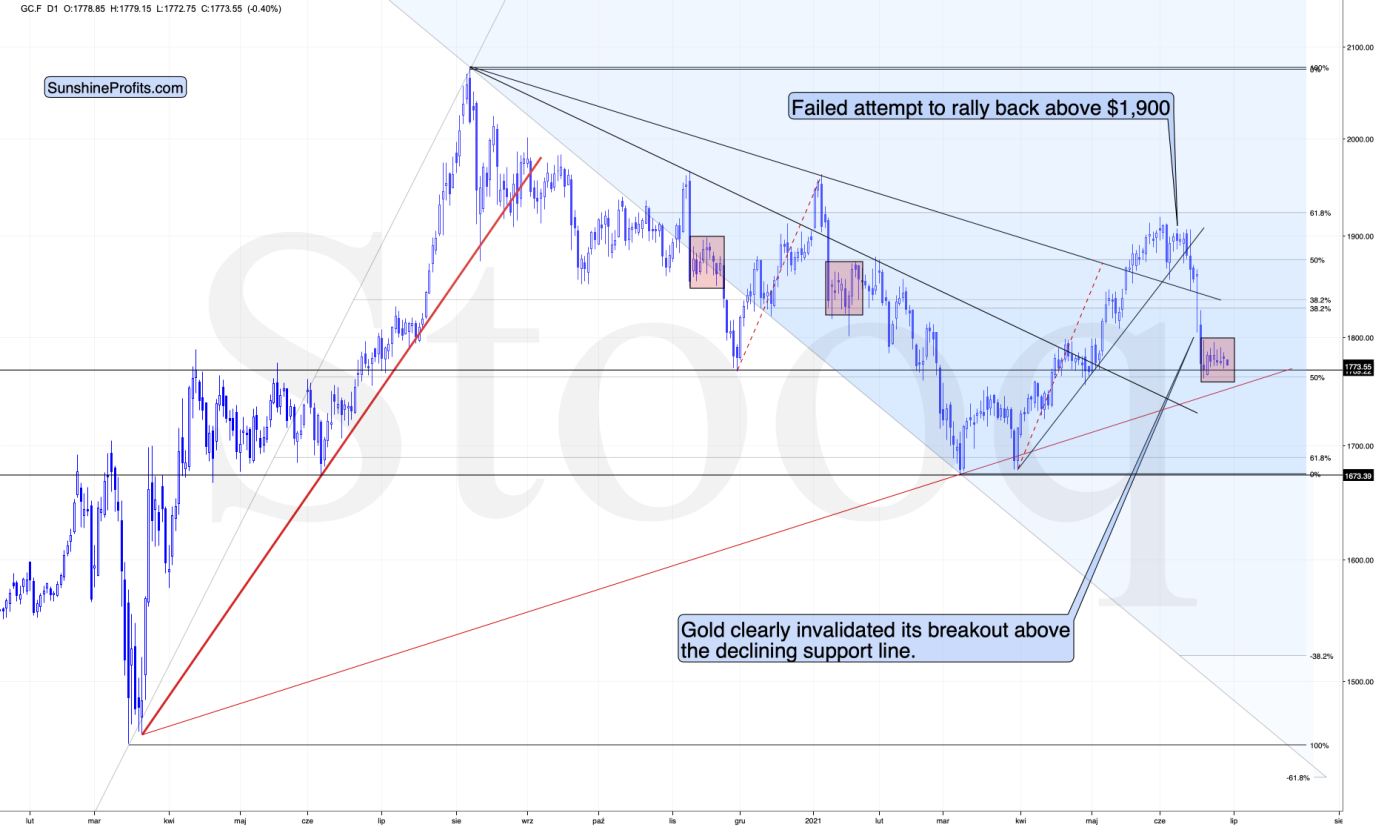
That was normal – we saw something like that several times, for example in mid-March 2020 and mid-September 2020. However, gold has been consolidating for over 7 trading days. There was no bottom in recent history that took so long to form.
There were, however, small consolidations that took even a bit longer. And we saw them after gold declined particularly profoundly. I marked those cases with red rectangles – they took place in November 2020 and January 2021. And we see the same thing now. In both previous cases, gold continued to decline, and it declined profoundly once again.
Now, if the USD Index was about to decline significantly, gold would likely rally anyway, but…
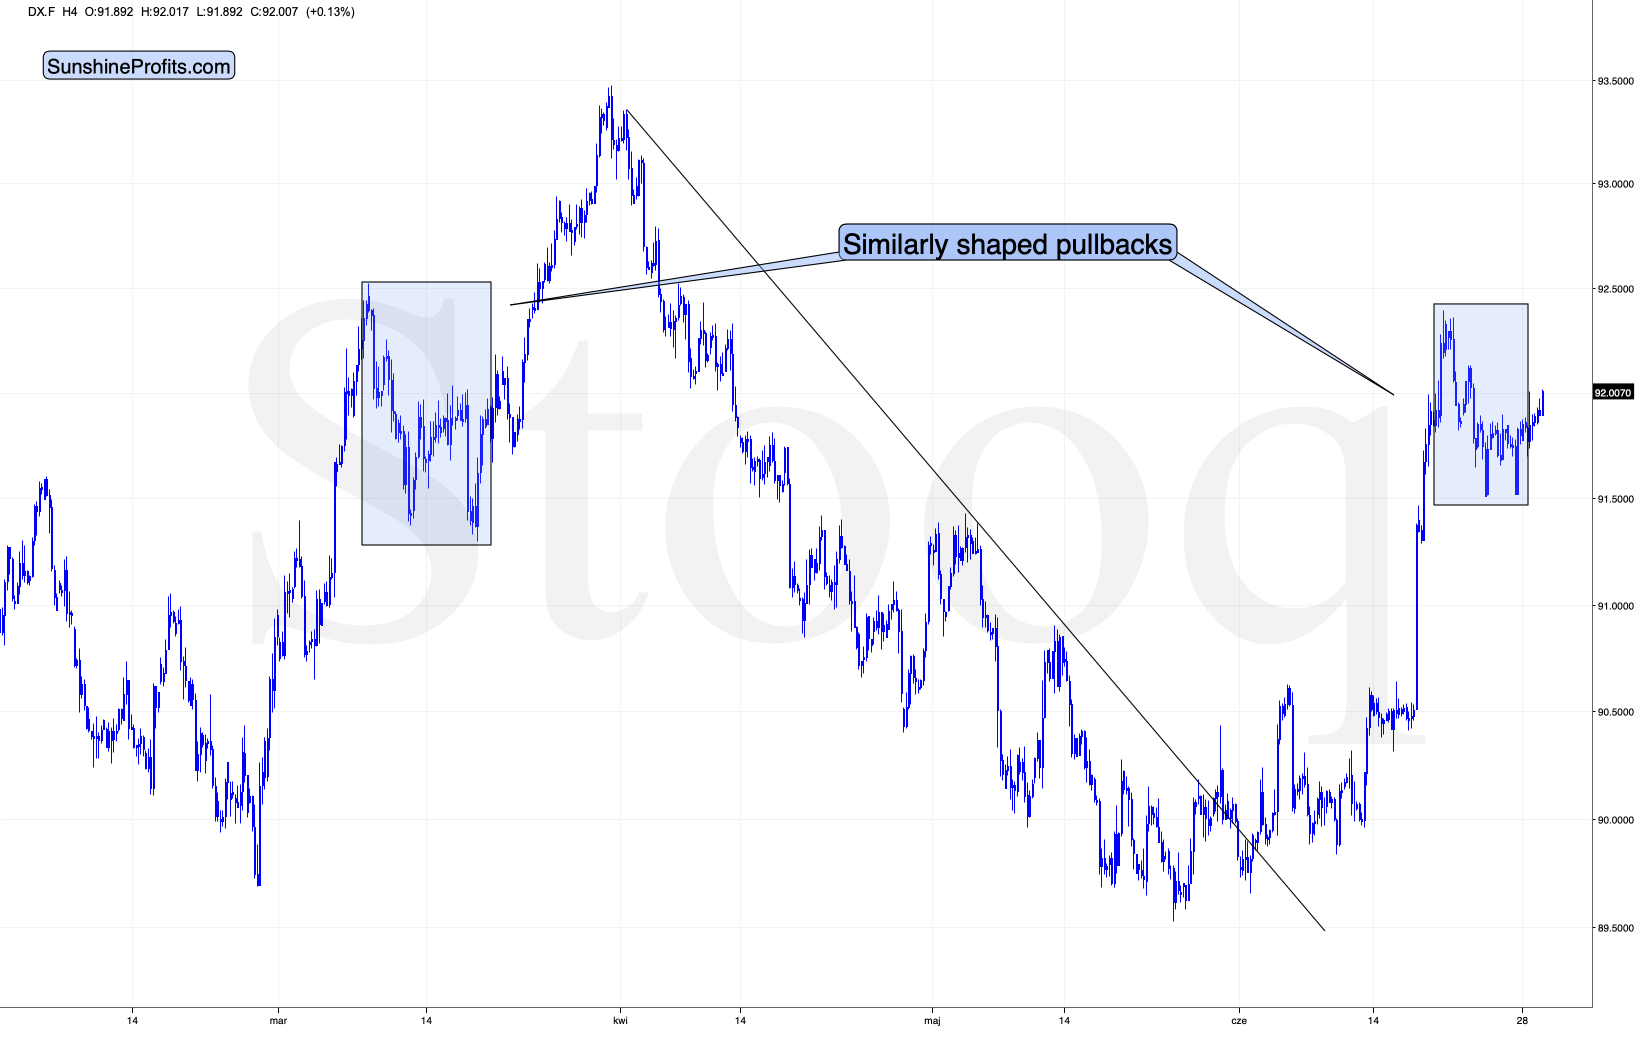
The USD Index shaped its corrective downswing very similarly to what it did in late March and early April. And since history rhymes, this could mean that a similar action will follow. And back in April, the USDX simply rallied.
Moreover, gold stocks’ relative performance not only hasn’t stopped indicating the bearish outlook recently but also provided a screaming sell sign once again yesterday.
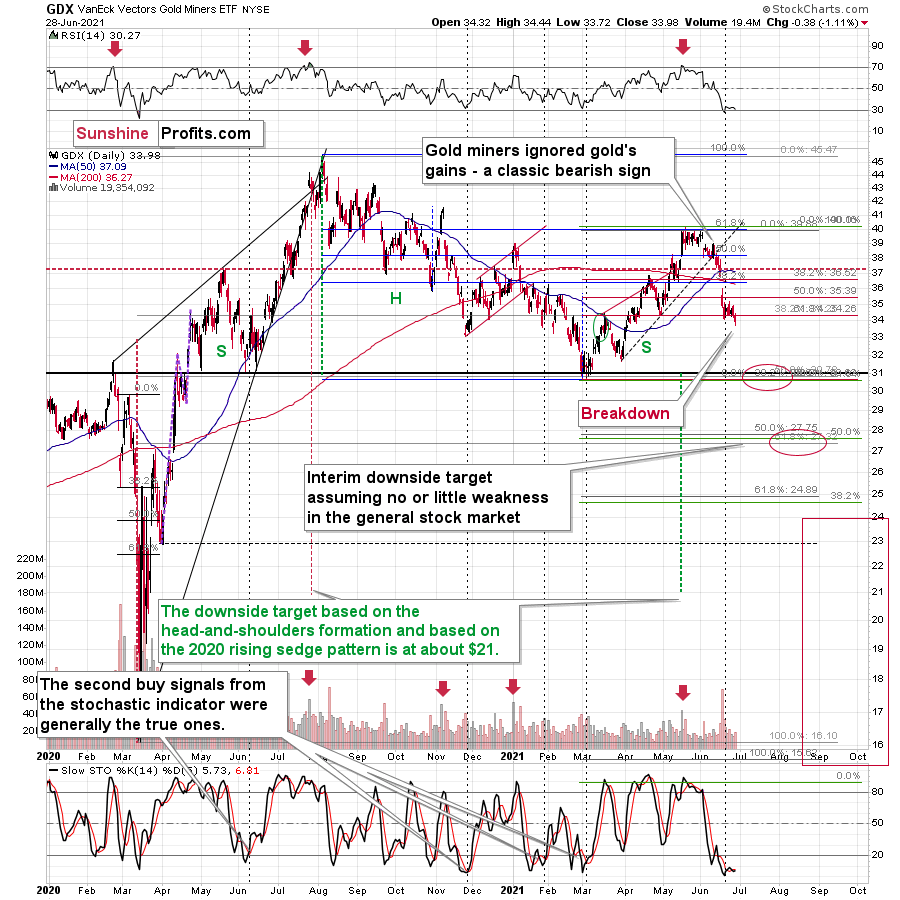
Namely, the GDX ETF declined and closed below its previous monthly lows as well as below the late-April lows. This breakdown took place without gold’s help, which makes it particularly bearish.
The breakdown was even more profound in the case of the GDXJ – a proxy for junior mining stocks.
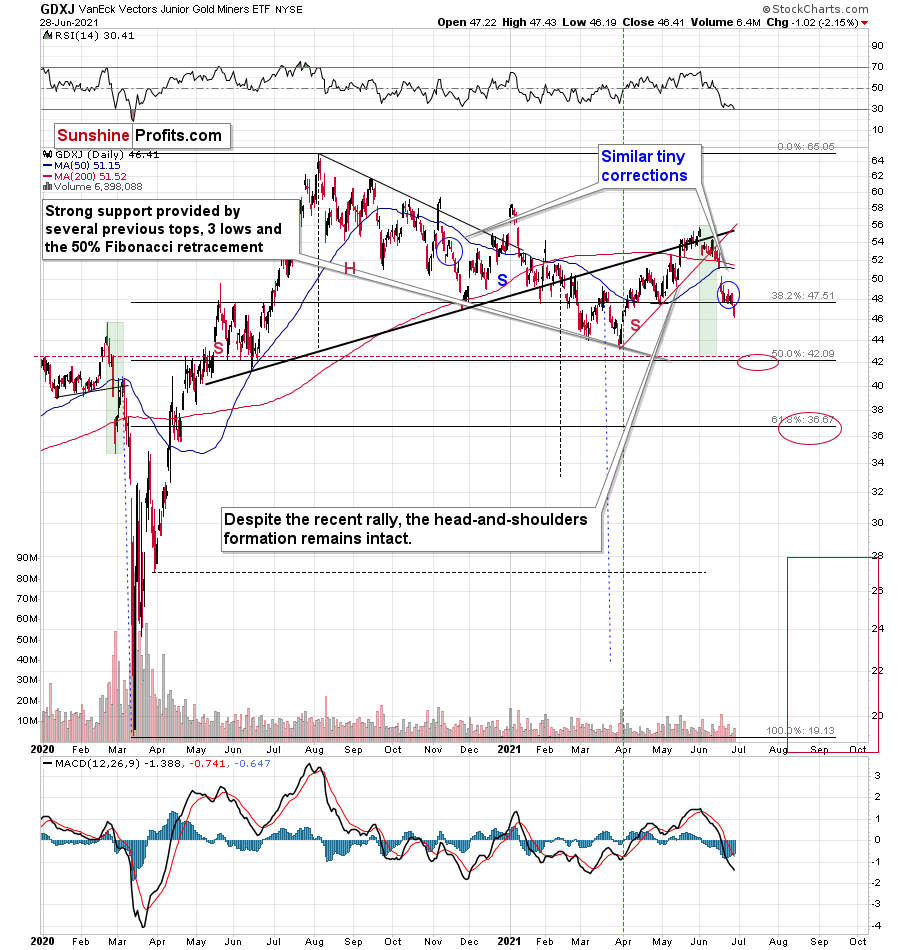
The size of the recent “upswing” was comparable to the mid-November 2020 one, so it confirms the analogy to this period that I mentioned while discussing the gold’s chart.
The next short-term downside target is at about $42 – a bit below the previous lows as that’s where the 50% Fibonacci retracement line coincides with the previous highs and lows (and also with the 2019 highs that are not visible on the above chart).
All in all, it seems that the outlook for the precious metals market –especially for the junior gold miners – is very bearish for the following weeks and months.
Having said that, let’s take a look at the markets from a more fundamental angle.
Solving the FED’s Jigsaw Puzzle
With rising U.S. nonfarm payrolls likely to put the final nail in QE’s coffin, I warned on Jun. 10 that September has all of the necessary ingredients to force the U.S. Federal Reserve’s (FED) hand.
I wrote:
With the Jun. 15/16 policy meeting not leaving enough time for FED officials to “communicate very early, very often what we’re going to do” (spoken by Philadelphia FED President Patrick Harker) and the Jul. 27/28 policy meeting excluding a summary of the FED’s economic projections, either the Jackson Hole Economic Symposium (late August) or the Sep. 21/22 policy meeting is when the fireworks will likely begin.
Please see below:
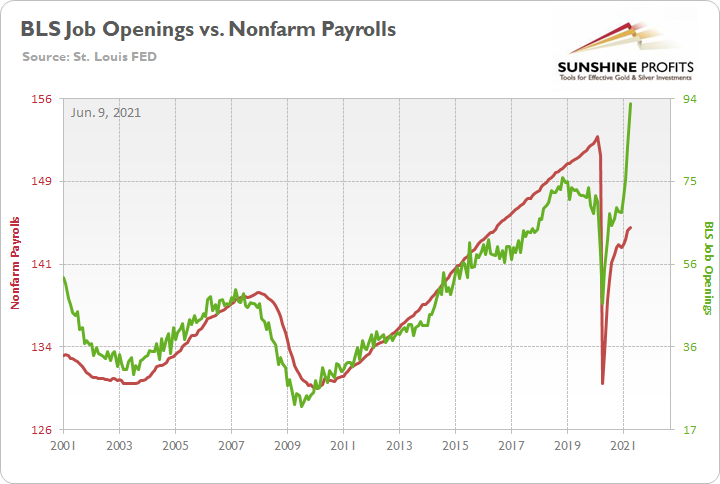
To explain, the red line above tracks U.S. nonfarm payrolls, while the green line above tracks U.S. job openings. If you analyze the relationship, you can see that the latter is often a strong predictor of the former. However, with enhanced unemployment benefits still in effect until mid-to-late June or early July (across ~25 states) – and nationwide until Sep. 6 (expected) – the shift likely won’t occur overnight. But once the benefits expire, U.S. nonfarm payrolls will likely spike in August (reflecting July’s data) and September (reflecting August’s data) and lift the U.S. 10-Year Treasury yield and the USD Index in the process.
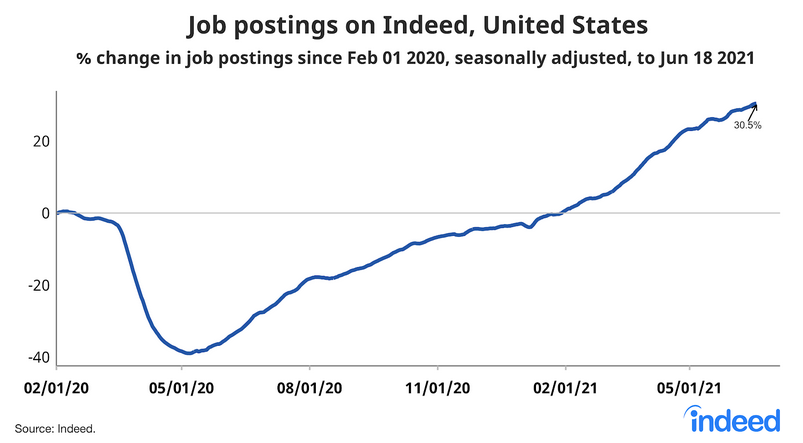
To that point, with June’s payrolls scheduled for release on Jul. 2, slowly but surely, the stars are aligning. For one, Indeed released its latest labor market roundup on Jun. 22. And with U.S. job postings now “30.5% above the pre-pandemic baseline” (Feb. 1, 2020), the report revealed that if BLS job openings grow “at the same rate as Indeed job postings” it “implies 9.8 million job openings as of June 18.” For context, the BLS figure hit an all-time high of 9.286 million on Jun. 8.
Please see below:
More importantly, though, the report revealed that U.S. states that have eliminated enhanced unemployment benefits (or are planning to do so) are already seeing an uptick in job search activity.
Please see below:
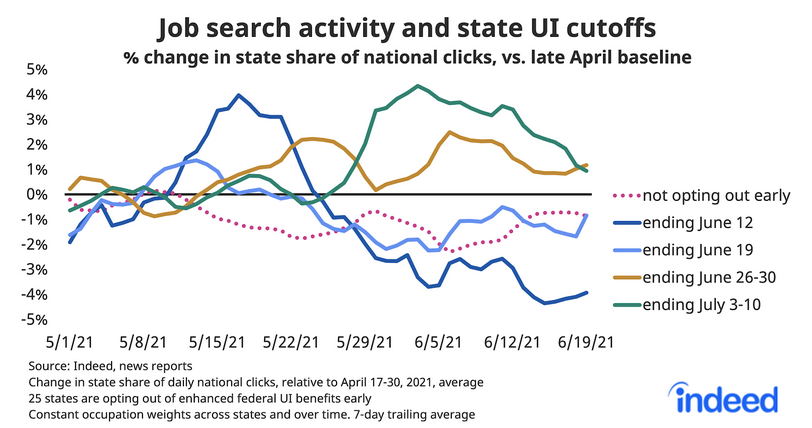
To explain, the dark blue, light blue, and brown lines above track job search activity across states where enhanced unemployment benefits have expired, or will expire, on Jun. 12, Jun. 19 and Jun. 26-30. If you analyze the right side of the chart, you can see that all three lines have moved higher in recent weeks. And with Indeed providing an early glimpse of the momentum that should accelerate in August and September, the FED is slowly running out of excuses.
As further evidence, Arbor Data Science found that searches for part-time employment have spiked in states where enhanced unemployment benefits expired on Jun. 12 and Jun. 19.
Please see below:
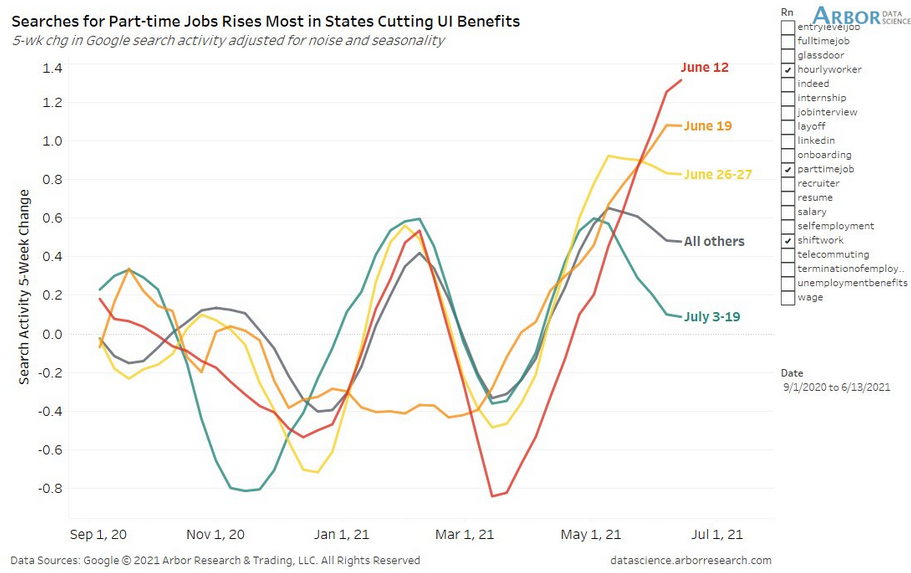
To explain, the red and orange lines above track the five-week search activity of the now-former claimants. And with data scientist Ben Breitholtz writing that “states already ending UI benefits have seen much stronger searches for part-time or hourly jobs topics,” over the next few months, the momentum should crawl, then walk, and finally run.
Haven’t You Forgotten About Something?
On top of that, while employment remains a work in progress, investors are still underestimating inflation. For context, we don’t expect hyperinflation due to the fact that the FED can taper its asset purchases and/or raise interest rates to slow the surge. However, the idea that inflation will ‘go away on its own’ is simply a pipedream.
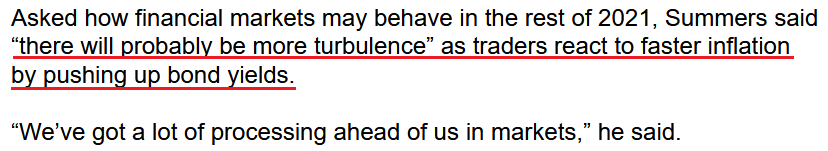
To explain, former U.S. Treasury Secretary Lawrence Summers told Bloomberg on Jun. 25 that “my guess is that at the end of the year inflation will, for this year, come out pretty close to 5%.” More importantly, though, if investors dismiss the scorching inflationary summer, they’ll likely incur deeper burns in the fall.
 Source: Bloomberg
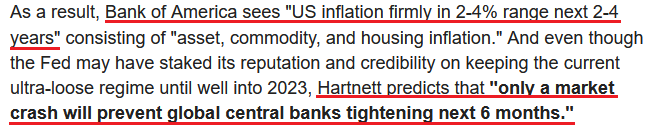
Singing a similar tune, Bank of America’s Chief Investment Strategist Michael Hartnett recently wrote that inflation is “annualizing 8% thus far in 2021” and that it’s “so fascinating [that] so many deem inflation as transitory when stimulus, economic growth, asset/commodity/housing inflations (are) deemed permanent.”
Also noteworthy:
 Source: ZeroHedge
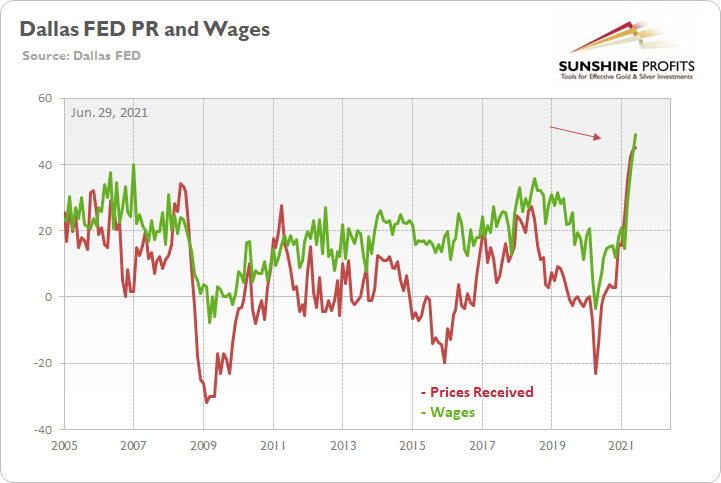
However, as the main course of this inflationary brief, the Dallas FED released its Texas Manufacturing Outlook Survey on Jun. 28. And while market participants have become increasingly dismissive of the inflationary pressures, the release could be a stark warning of what’s to come.
It read:
“Price and wage pressures accelerated further in June. The raw materials prices index inched up to 80.8, an all-time high. The finished goods prices index also pushed to new heights, coming in at 42.8. Similarly, the wages and benefits index set another record high of 48.1, up nine points from its May reading.”
Please see below:
Even more revealing, please have a look at the deluge of commentary from the survey. For context, while investors debate their positions at the macro level, insights from businesses that operate in the real economy are much more valuable:
Nonmetallic Mineral Product Manufacturing:
“Our sales would climb significantly if we could find workers. Our backlog is now six weeks; in January it was five days. Starting pay for untrained workers is up to $15 per hour with a signing bonus of $500. But we cannot even get applicants. It’s impossible to hire when our competitor for workers is the federal government. In 21 states and the District of Columbia, households can receive the wage equivalent of $25 an hour in benefits with no one working. In 19 states, benefits are the equivalent of $100,000 a year in salary for a family of four with two unemployed parents. How can a manufacturer compete with this?”
Fabricated Metal Manufacturing:
“Raw material pricing, primarily steel, is causing multiple disruptions to our business. As we attempt to pass along raw material increases, customers are slow to react and slow to approve, which causes delays to their orders. Also, the supply of raw material is getting scarce, causing us to go outside our normal supply chains to procure, which causes more delay and higher prices. Our gross margin is taking huge hits because we just can’t keep up the price increases fast enough with our customers.”
“We need 30 more employees, and there are none to be found. Steel prices have tripled, and other supplies are hard to find. We have raised prices and nobody is complaining.”
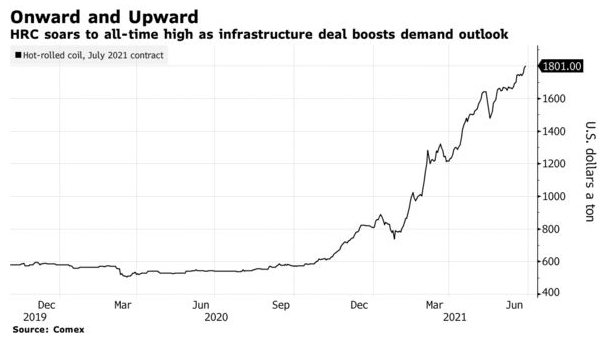
For context, even though steel futures have been on fire in 2021, the recently unveiled $1.2 trillion infrastructure package (that was agreed on Jun. 24 and includes $579 billion of new money) is like pouring gasoline on them.
Please see below:
Continuing the theme:
Computer and Electronic Product Manufacturing:
“Supply-chain issues and delays remain on nearly every front. Wages are increasing rapidly, and material costs are going up, which is forcing price increases on existing orders both to our customers and from our vendors. Lead times are extending, forcing rescheduling to products that can be built with the materials available rather than building what has been ordered. Those changes decrease efficiency on top of paying more for labor and materials. It appears that it could be several more months before the supply chain can stabilize.”
Paper Manufacturing:
“Raw material prices and wages are increasing. Some costs are passed on [to] the customers, but margins are compressed. We need to hire employees but can’t find prospects. Our current employees are being poached by other industries that appear to pay anything to lure them away. Either this is unsustainable, or inflation in our products will have to rise to 8-10 percent per year. Demand-pull and cost-push inflation is very strong in the packaging industry at this time.”
Miscellaneous Manufacturing:
“We cannot find qualified employees. Wage demand and pay are going through the roof. We are losing employees to higher-paying employers. There is a lot of poaching going on.”
The Hiring Challenge
Furthermore, while the anecdotal evidence is clearly abundant, the two responses below are so revealing that they should be read in their entirety.
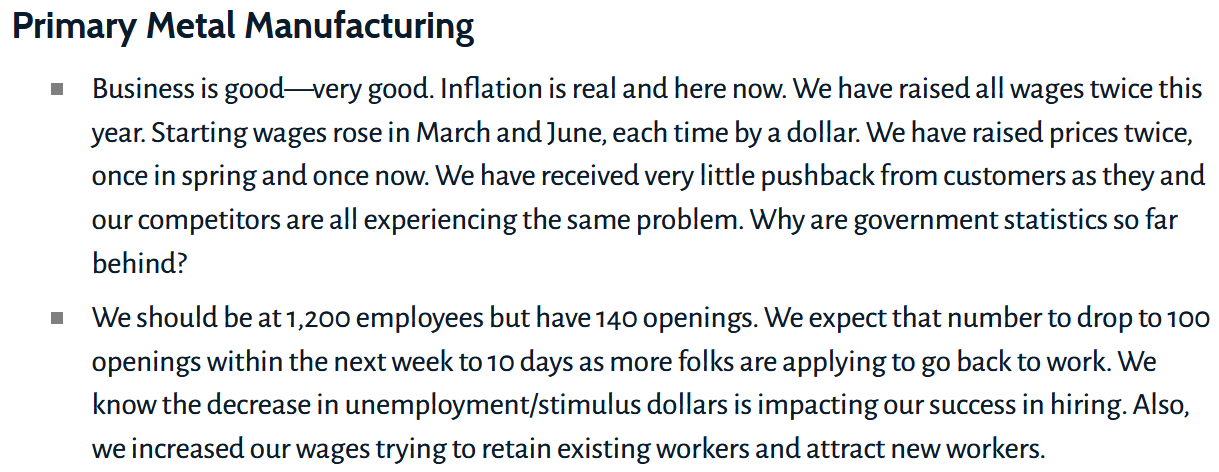 Source: Dallas FED
Adding to the inflationary thesis, not only has The Transportation Security Administration (TSA) offered $1,000 signing bonuses in a bid to add 6,000 screeners by the end of September, but airport restaurants are also following suit. Moreover, the situation became so extreme at the Dallas/Fort Worth (DFW) International Airport that shops were urged not to steal each other’s employees.
Please see below:
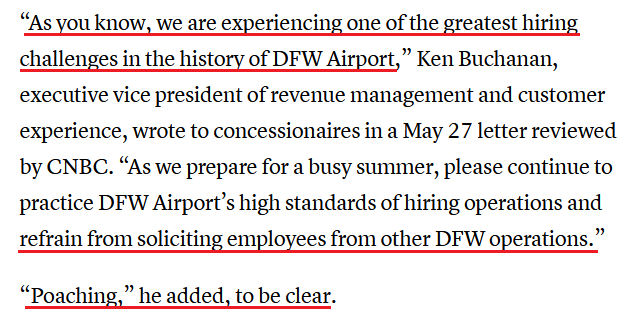 Source: CNBC
In addition, Star Concessions, which is home to more than 50 food, beverage, and retail businesses at Texas airports, increased its hourly wage for non-tipped employees from $12-$14 to $14-$17.
Please see below:
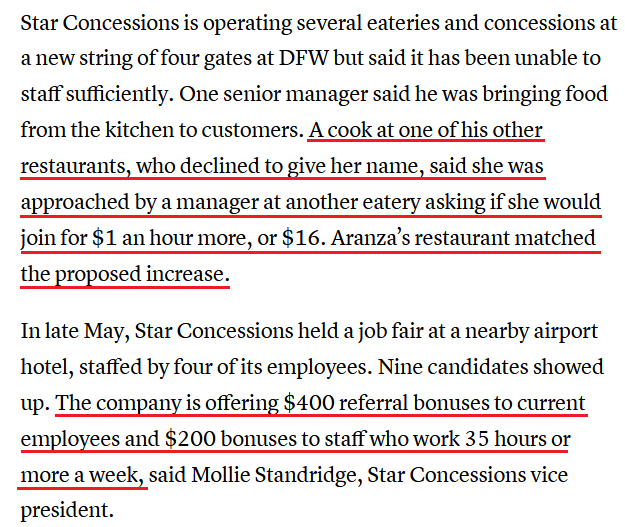 Source: CNBC
Likewise, the frenzy is occurring at airports across the country:
“OTG Management, which operates airport terminal restaurants in Newark, New Jersey, Houston and other major hubs, is offering $750 signing bonuses, said CEO Rick Blatstein. Cooks are in the greatest demand and get $1,000 signing bonuses, while new managers get $3,000 bonuses.”
Let’s Talk About Shipping
Now, since we’ve already covered raw materials and wages, what’s next on the list? Well, I warned on Jun. 15 that shipping costs are exploding at an unprecedented rate.
I wrote:
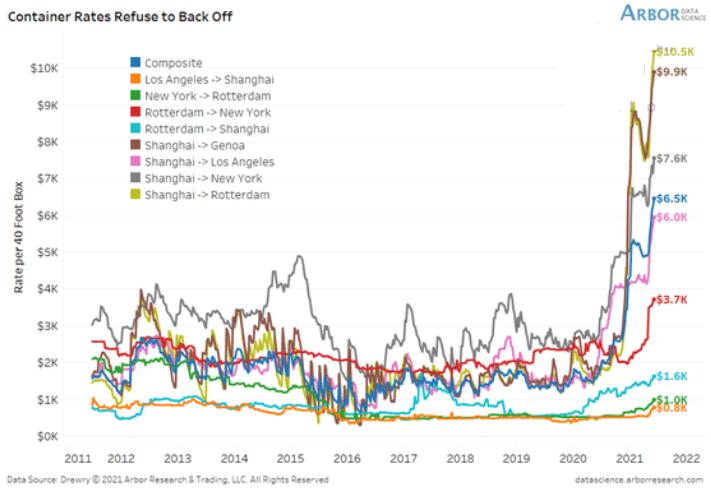
To explain, the lines above track the shipping costs to-and-from various regions. If you analyze the dark blue line sandwiched in the middle ($6.5K), average shipping costs continue to skyrocket. Moreover, if you’re shipping from Shanghai to Rotterdam, New York or Genca, global businesses are nowhere near solving these “transitory” issues.
And providing another update on Jun. 28, the situation has only worsened.
Please see below:
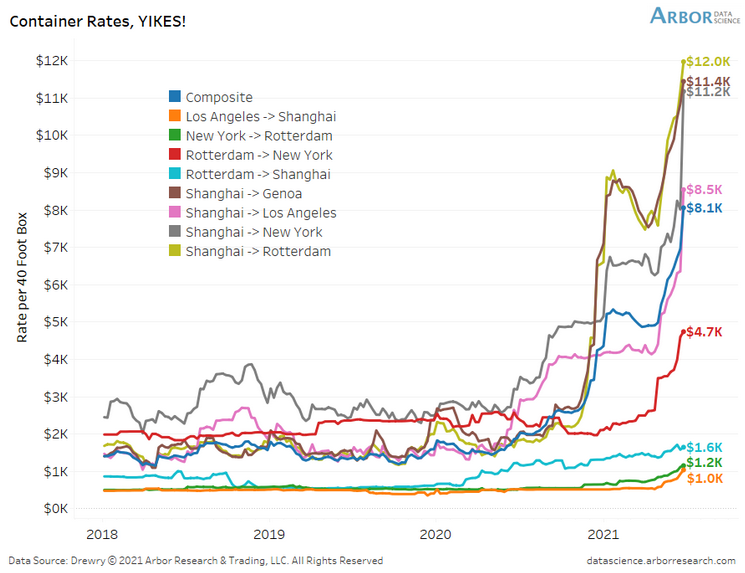
To explain, if you compare the first chart to the one directly above, you can see that the composite container rate (the dark blue line) has increased from $6.5K to $8.1K in only two weeks. Furthermore, shipping from Shanghai to Rotterdam (the gold line) has increased from $10.5K to $12.0k, while Shanghai to New York (the gray line) has risen from $7.6K to $11.2K. As a result, does it seem as if inflationary pressures were a thing of the past?
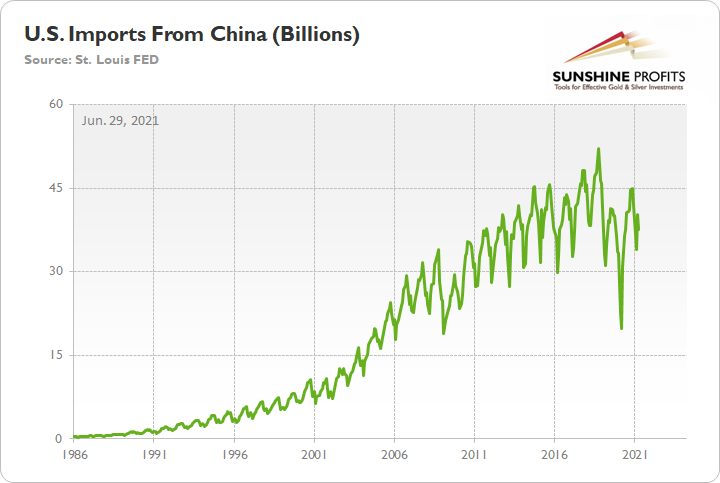
To that point, with the U.S. Census Bureau revealing on Jun. 8 that U.S. imports from China (goods) totaled nearly $38 billion in April, more and more data signals that the U.S. economy will continue to feel the inflationary burn.
Please see below:
Finally, Mohamed El-Erian, chief economic advisor at Allianz, told CNBC on Jun. 28 that “Every day I see evidence of inflation not being transitory.” Moreover, he added that “I have concern that the FED is falling behind and that it may have to play catch-up, and history makes you very uncomfortable if you end up in a world in which the FED has to play catch-up.”
And what exactly does he mean by if “the FED has to play catch-up?”
- Taper its asset purchasers at a faster pace than investors expect.
- Raise interest rates at a faster pace than investors expect.
- Cause a loss of confidence that results in a sell-off in the stock market and the commodities market (looking at you, PMs).
To that point, while El-Erian added that “as long as the FED believes it’s transitory, that is what matters for markets,” he was blunt in his assessment of how he thinks all this will end:
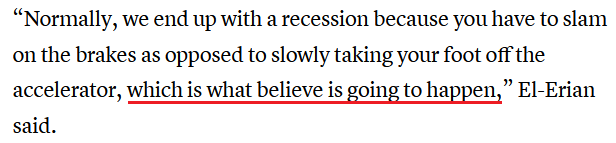 Source: CNBC
In conclusion, while investors position for declining inflation, the data suggests that the opposite is more likely. With raw materials, wages, shipping costs and commodities speculation creating the perfect storm, we haven’t even seen the effects of the demand side of the equation. More importantly, though, with surging inflation and a healing U.S. labor market poised to push the FED over the QE cliff, the PMs are right in harm’s way. And given that they’re struggling to find their footing now, when only words have been spoken, if the FED grows tangibly hawkish, look out below.
Overview of the Upcoming Part of the Decline
- The barely visible corrective upswing in gold might already be over, and another huge decline is likely just around the corner.
- After miners slide in a meaningful and volatile way, but silver doesn’t (and it just declines moderately), I plan to switch from short positions in miners to short positions in silver. At this time, it’s too early to say at what price levels this would take place – perhaps with gold close to $1,600. I plan to exit those short positions when gold shows substantial strength relative to the USD Index, while the latter is still rallying. This might take place with gold close to $1,350 - $1,500 and the entire decline (from above $1,900 to about $1,475) would be likely to take place within 6-20 weeks, and I would expect silver to fall the hardest in the final part of the move. This moment (when gold performs very strongly against the rallying USD and miners are strong relative to gold – after gold has already declined substantially) is likely to be the best entry point for long-term investments, in my view. This might also happen with gold close to $1,475, but it’s too early to say with certainty at this time.
- As a confirmation for the above, I will use the (upcoming or perhaps we have already seen it?) top in the general stock market as the starting point for the three-month countdown. The reason is that after the 1929 top, gold miners declined for about three months after the general stock market started to slide. We also saw some confirmations of this theory based on the analogy to 2008. All in all, the precious metals sector would be likely to bottom about three months after the general stock market tops.
- The above is based on the information available today, and it might change in the following days/weeks.
Please note that the above timing details are relatively broad and “for general overview only” – so that you know more or less what I think and how volatile I think the moves are likely to be – on an approximate basis. These time targets are not binding or clear enough for me to think that they should be used for purchasing options, warrants or similar instruments.
Summary
To summarize, even though gold could still move somewhat higher in the near term, it seems that having a short position in the junior mining stocks is much more justified from the risk-to-reward point of view than having a long one in any part of the precious metals market. Gold miners’ underperformance along with a self-similar pattern in the USD Index (pointing to the breather being over) and the length of the “bottoming” process in gold that no longer resembles a bottom (but rather a pause within a slide) all make the bearish outlook justified from the risk-to-reward point of view.
After the sell-off (that takes gold to about $1,350 - $1,500), I expect the precious metals to rally significantly. The final part of the decline might take as little as 1-5 weeks, so it's important to stay alert to any changes.
Most importantly, please stay healthy and safe. We made a lot of money last March and this March, and it seems that we’re about to make much more on the upcoming decline, but you have to be healthy to enjoy the results.
As always, we'll keep you - our subscribers - informed.
By the way, we’re currently providing you with a possibility to extend your subscription by a year, two years or even three years with a special 20% discount. This discount can be applied right away, without the need to wait for your next renewal – if you choose to secure your premium access and complete the payment upfront. The boring time in the PMs is definitely over and the time to pay close attention to the market is here. Naturally, it’s your capital, and the choice is up to you, but it seems that it might be a good idea to secure more premium access now, while saving 20% at the same time. Our support team will be happy to assist you in the above-described upgrade at preferential terms – if you’d like to proceed, please contact us.
To summarize:
Trading capital (supplementary part of the portfolio; our opinion): Full speculative short positions (300% of the full position) in mining stocks are justified from the risk to reward point of view with the following binding exit profit-take price levels:
Mining stocks (price levels for the GDXJ ETF): binding profit-take exit price: $24.12; stop-loss: none (the volatility is too big to justify a stop-loss order in case of this particular trade)
Alternatively, if one seeks leverage, we’re providing the binding profit-take levels for the JDST (2x leveraged) and GDXD (3x leveraged – which is not suggested for most traders/investors due to the significant leverage). The binding profit-take level for the JDST: $39.87; stop-loss for the JDST: none (the volatility is too big to justify a SL order in case of this particular trade); binding profit-take level for the GDXD: $94.87; stop-loss for the GDXD: none (the volatility is too big to justify a SL order in case of this particular trade).
For-your-information targets (our opinion; we continue to think that mining stocks are the preferred way of taking advantage of the upcoming price move, but if for whatever reason one wants / has to use silver or gold for this trade, we are providing the details anyway.):
Silver futures upside profit-take exit price: unclear at this time - initially, it might be a good idea to exit, when gold moves to $1,512.
Gold futures upside profit-take exit price: $1,512.
Long-term capital (core part of the portfolio; our opinion): No positions (in other words: cash
Insurance capital (core part of the portfolio; our opinion): Full position
Whether you already subscribed or not, we encourage you to find out how to make the most of our alerts and read our replies to the most common alert-and-gold-trading-related-questions.
Please note that we describe the situation for the day that the alert is posted in the trading section. In other words, if we are writing about a speculative position, it means that it is up-to-date on the day it was posted. We are also featuring the initial target prices to decide whether keeping a position on a given day is in tune with your approach (some moves are too small for medium-term traders, and some might appear too big for day-traders).
Additionally, you might want to read why our stop-loss orders are usually relatively far from the current price.
Please note that a full position doesn't mean using all of the capital for a given trade. You will find details on our thoughts on gold portfolio structuring in the Key Insights section on our website.
As a reminder - "initial target price" means exactly that - an "initial" one. It's not a price level at which we suggest closing positions. If this becomes the case (like it did in the previous trade), we will refer to these levels as levels of exit orders (exactly as we've done previously). Stop-loss levels, however, are naturally not "initial", but something that, in our opinion, might be entered as an order.
Since it is impossible to synchronize target prices and stop-loss levels for all the ETFs and ETNs with the main markets that we provide these levels for (gold, silver and mining stocks - the GDX ETF), the stop-loss levels and target prices for other ETNs and ETF (among other: UGL, GLL, AGQ, ZSL, NUGT, DUST, JNUG, JDST) are provided as supplementary, and not as "final". This means that if a stop-loss or a target level is reached for any of the "additional instruments" (GLL for instance), but not for the "main instrument" (gold in this case), we will view positions in both gold and GLL as still open and the stop-loss for GLL would have to be moved lower. On the other hand, if gold moves to a stop-loss level but GLL doesn't, then we will view both positions (in gold and GLL) as closed. In other words, since it's not possible to be 100% certain that each related instrument moves to a given level when the underlying instrument does, we can't provide levels that would be binding. The levels that we do provide are our best estimate of the levels that will correspond to the levels in the underlying assets, but it will be the underlying assets that one will need to focus on regarding the signs pointing to closing a given position or keeping it open. We might adjust the levels in the "additional instruments" without adjusting the levels in the "main instruments", which will simply mean that we have improved our estimation of these levels, not that we changed our outlook on the markets. We are already working on a tool that would update these levels daily for the most popular ETFs, ETNs and individual mining stocks.
Our preferred ways to invest in and to trade gold along with the reasoning can be found in the how to buy gold section. Furthermore, our preferred ETFs and ETNs can be found in our Gold & Silver ETF Ranking.
As a reminder, Gold & Silver Trading Alerts are posted before or on each trading day (we usually post them before the opening bell, but we don't promise doing that each day). If there's anything urgent, we will send you an additional small alert before posting the main one.
Thank you.
Przemyslaw Radomski, CFA
Founder, Editor-in-chief

