

Briefly: in our opinion, full (300% of the regular position size) speculative short positions in mining stocks are justified from the risk/reward point of view at the moment of publishing this Alert.
The decline in gold continues, and while we might see a small pop-up higher here, it’s unlikely to last.
And why could gold move slightly higher and correct the recent declines?
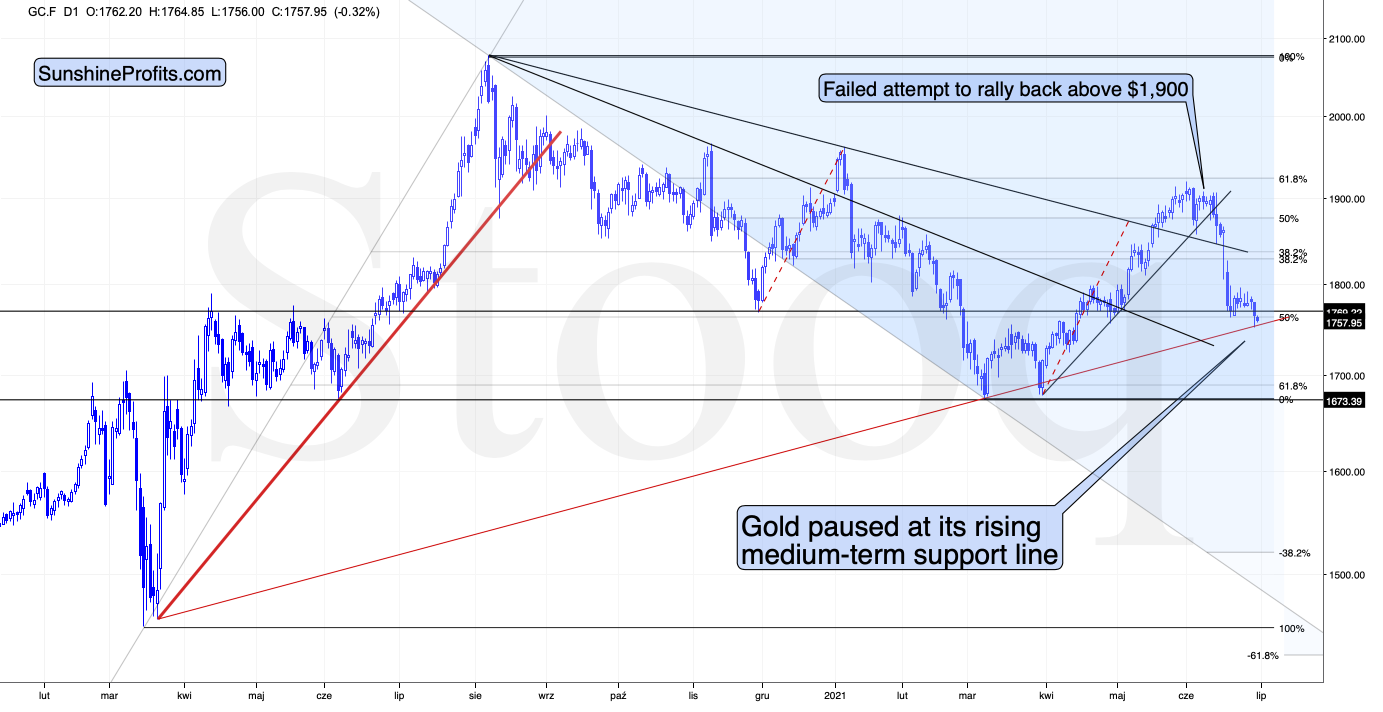
Because it has just reached the rising support line based on its previous important lows. The possible rebound could take place based on this single development. However, just because it might happen doesn’t make it very likely, and it doesn’t mean that taking any action now is justified. The medium-term forecast for gold remains bearish.
The situation in the USD Index is one of the reasons for this outlook:
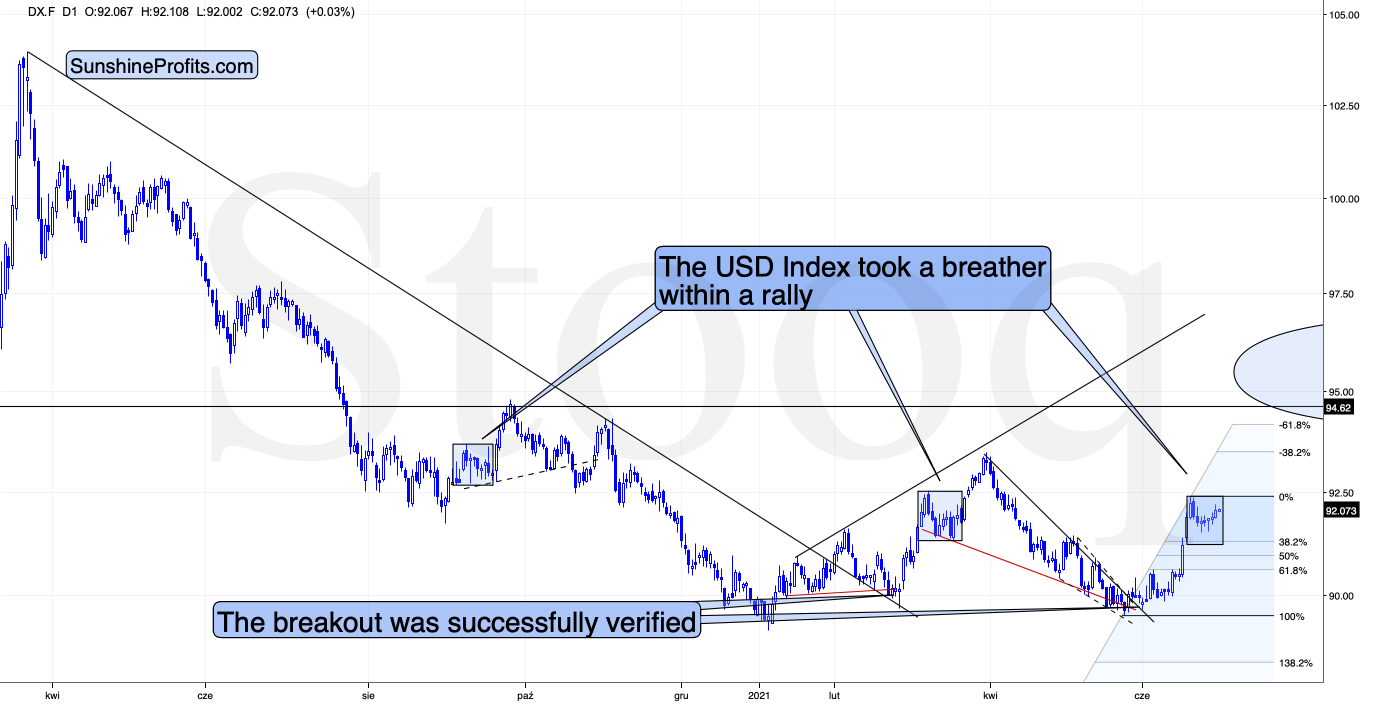
We recently saw a breather that was similar in terms of time and price to the previous patterns which happened after quick short-term rallies. And now, the USDX is moving higher once again. As soon as it exceeds the previous June highs, it’s likely to rally more substantially, perhaps stopping temporarily at the late-March high or rallying even higher, to 95 or so.
Either way, gold is likely to get the bearish push off the cliff that will likely take it below the above-mentioned rising red line. Gold’s next support is at the previous 2021 lows – close to $1,670.
Besides, while gold bounced off the rising red line visible on the first chart, the yellow metal actually broke visibly below a much more important support line.
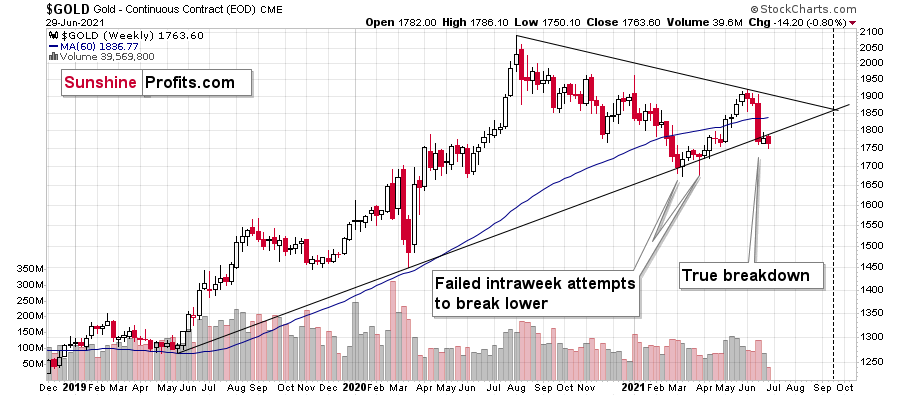
In fact, that was the first time when gold managed to break below this line and not rally back up. This time is already different.
Moreover, let’s keep in mind that gold stocks’ relative performance not only hasn’t stopped indicating the bearish outlook recently but also provided a screaming sell sign once again on Monday.
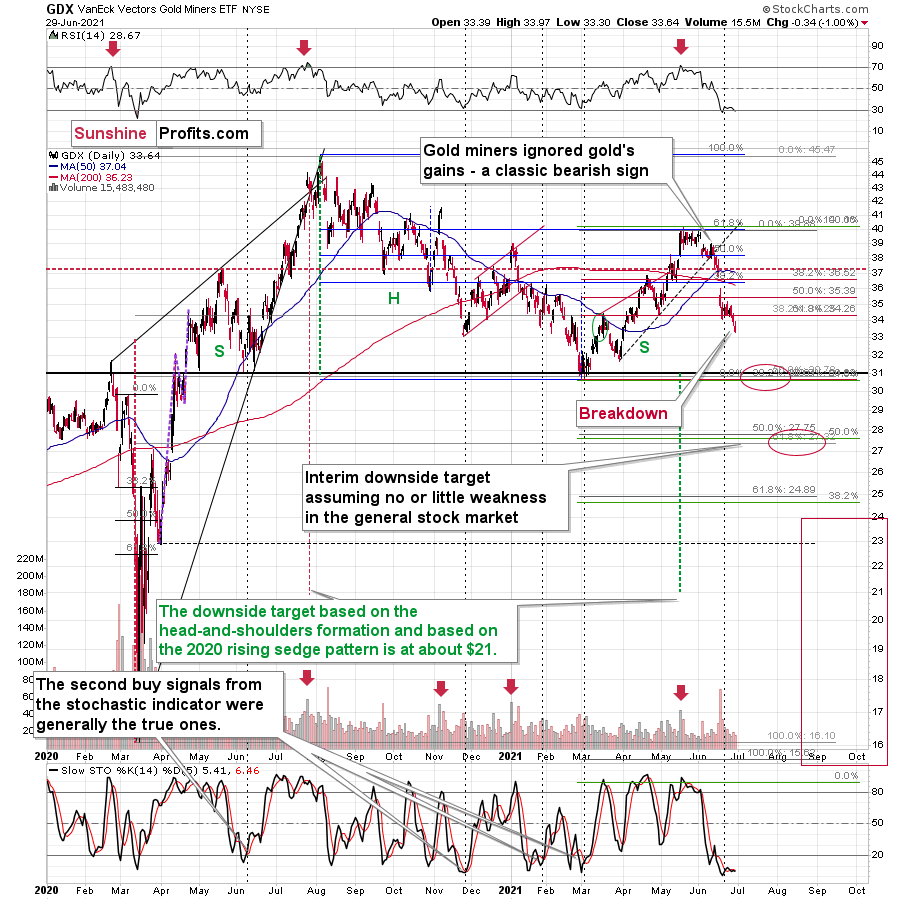
Namely, the GDX ETF declined and closed below its previous monthly lows as well as below the late-April lows. This breakdown took place without gold’s help, which makes it particularly bearish.
Please note that the volume that accompanied this week’s declines is relatively low, and the declines tend to end on huge volume. Consequently, the low-volume readings imply that we’re not at the bottom yet. Also, silver hasn’t broken visibly lower, and it didn’t “catch up” with the miners, which could indicate that the bottom is in. So, it likely isn’t.
The above-mentioned breakdown was even more profound in the case of the GDXJ – a proxy for junior mining stocks.
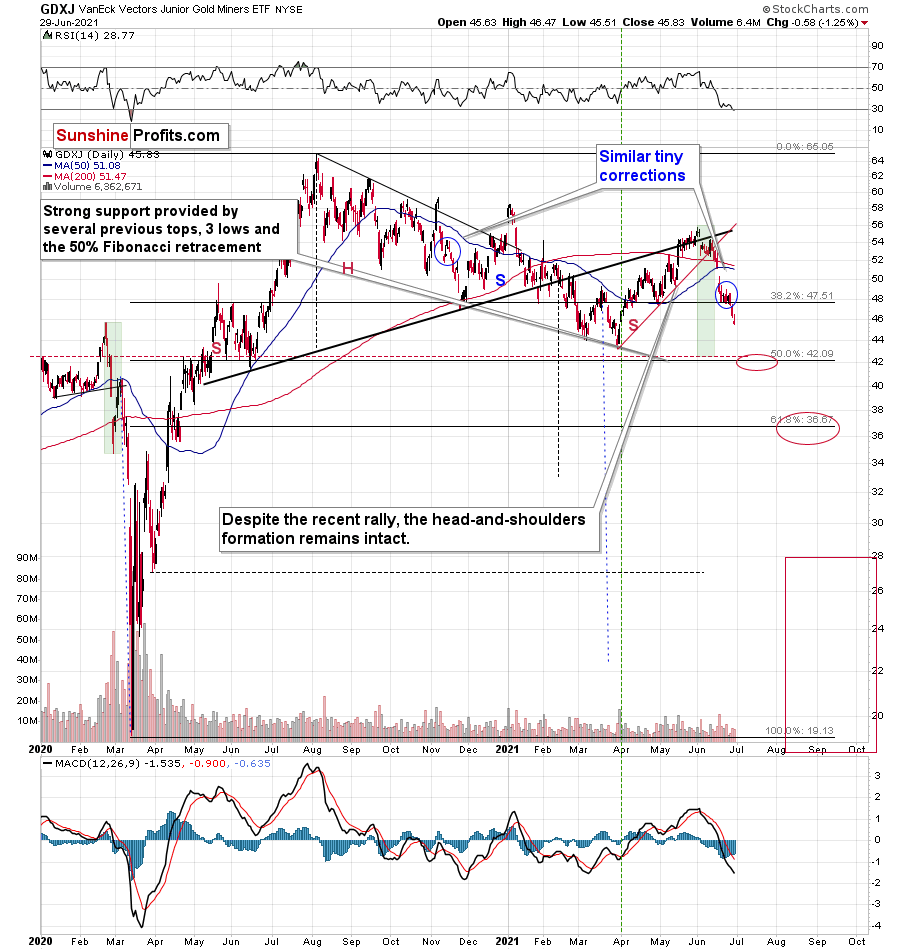
The size of the recent “upswing” was comparable to the mid-November 2020 one, so it confirms the analogy to this period that I mentioned while discussing the gold’s chart yesterday.
The next short-term downside target is at about $42 – a bit below the previous lows, as that’s where the 50% Fibonacci retracement line coincides with the previous highs and lows (and also with the 2019 highs that are not visible on the above chart).
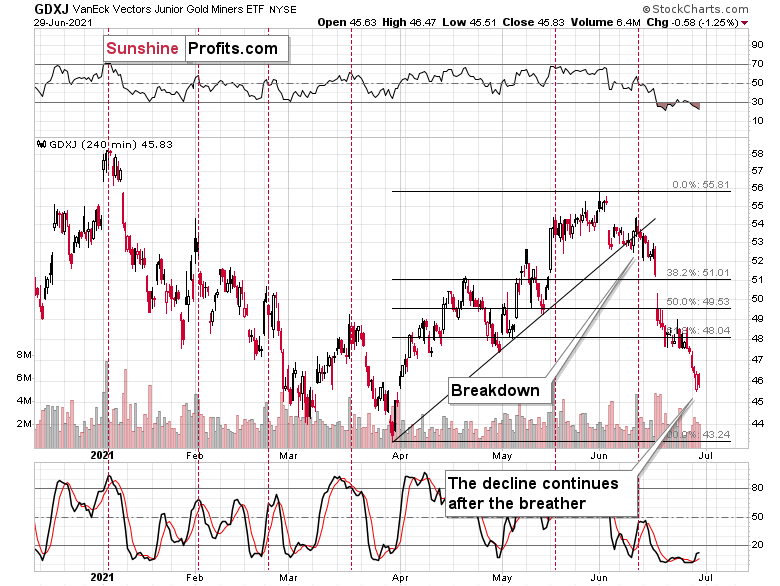
The 4-hour candlestick chart shows that junior miners moved slightly higher at the beginning of yesterday’s session only to decline in its final hours. So, it’s not that we’re not seeing any corrections – we do have them, but they are so tiny that they are barely noticeable from the daily perspective.
All in all, it seems that the outlook for the precious metals market – especially for the junior gold miners – is very bearish for the following weeks and months, and it seems that the profits on our current short position will grow much more quite soon.
Having said that, let’s take a look at the markets from a more fundamental angle.
When Doves Cry
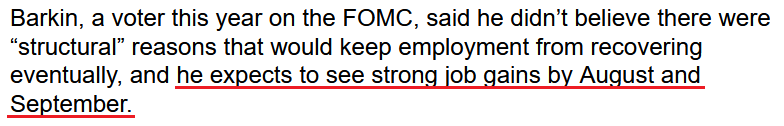
With the U.S. Federal Reserve’s (FED) hawkish shift sending the PMs into a downward spiral, even the doves aren’t so dovish anymore. Case in point: while I’ve been highlighting that U.S. nonfarm payrolls should spike in August and September (and, therefore, force the FED’s hand), Richmond FED President Thomas Barkin said on Jun. 29 that “I still think we’ve got a long way to go on the job front.”
“I think you can argue reasonably compellingly [that] we’ve made substantial further progress on the inflation,” he said. On employment, “it just feels like further progress but doesn’t feel like – to me – like substantial further progress.”
However, because the phrase “a long way to go” is much more semblance than substance, the irony is that Barkin’s timeline actually matches our estimates.
Please see below:
 Source: Bloomberg
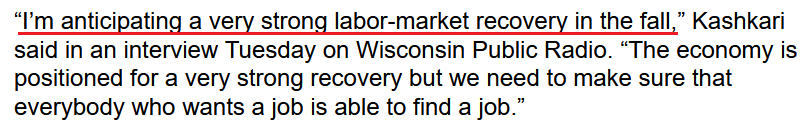
Likewise, Minneapolis FED President Neel Kashkari – the most dovish of them all – is also starting to see things from our perspective. And once the doves start abandoning the ship, it increases the likelihood of a September to remember.
 Source: Bloomberg
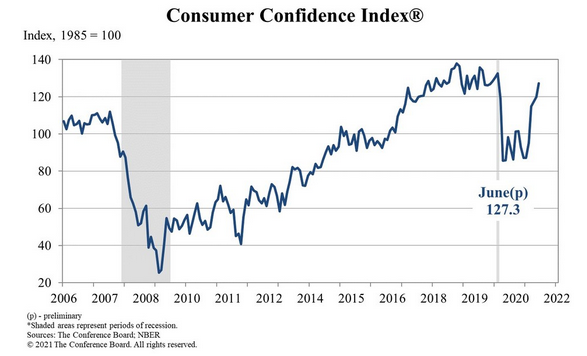
To that point, The Conference Board released its Consumer Confidence Survey on Jun. 29. And with the index hitting its “highest level since the onset of the pandemic’s first surge in March 2020,” Lynn Franco, Senior Director of Economic Indicators at The Conference Board, had this to say:
“Consumers’ assessment of current conditions improved again, suggesting economic growth has strengthened further in Q2. Consumers’ short-term optimism rebounded, buoyed by expectations that business conditions and their own financial prospects will continue improving in the months ahead. While short-term inflation expectations increased, this had little impact on consumers’ confidence or purchasing intentions. In fact, the proportion of consumers planning to purchase homes, automobiles, and major appliances all rose—a sign that consumer spending will continue to support economic growth in the short term. Vacation intentions also rose, reflecting a continued increase in spending on services.”
Please see below:
On top of that, the survey revealed:
- 54.4% of consumers said that jobs are “plentiful,” up from 48.5% in May.
- 33.3% of consumers expect that business conditions will improve over the next six months, up from 31.0% in May.
- 18.6% of consumers expect their incomes to increase over the next six months, up from 16.2% in May.
Please see below:
 Source: The Conference Board
Moreover, while the USD Index celebrated the news on Jun. 29, the data also matches the findings from the University of Michigan’s Consumer Sentiment Index (CSI) – which rose from 82.9 to 86.4 on Jun. 11.
To explain, I wrote on May 19:
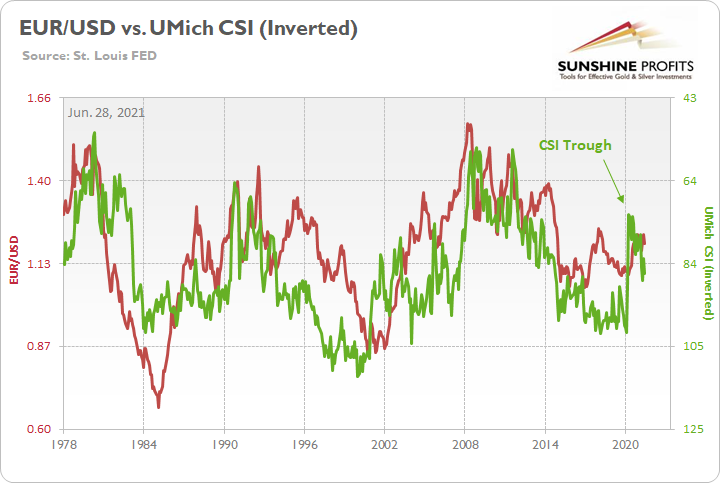
The red line above tracks the EUR/USD, while the green line above tracks the inverted University of Michigan’s CSI. For context, inverted means that the latter’s scale is flipped upside down and that a rising green line represents a falling CSI, while a falling green line represents a rising CSI. More importantly, though, if you analyze the relationship, you can see that troughs in the CSI nearly always coincide with peaks in the EUR/USD. Moreover, while both variables had risen simultaneously, the EUR/USD is fighting a battle that it hasn’t won in 40+ years.
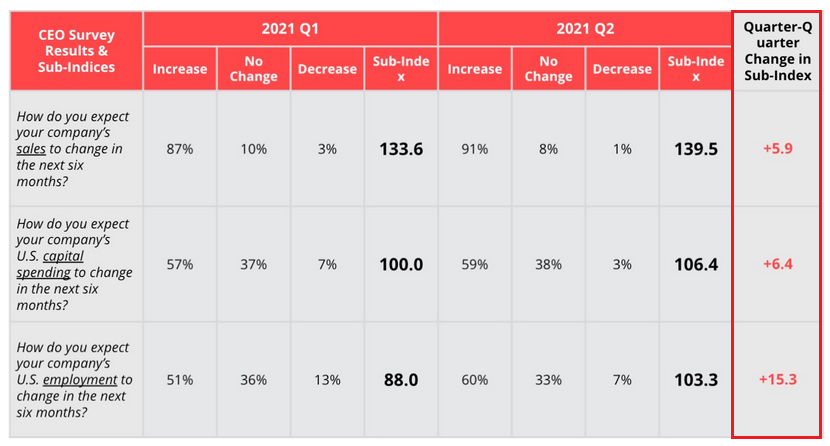
Furthermore, Business Roundtable released its second-quarter CEO Economic Outlook Survey on Jun. 15. The report revealed:
“The overall CEO Economic Outlook Index increased in the second quarter to a value of 116, up nine points from Q1 2021, and only two points below the all-time high reached in Q1 2018 in the wake of pro-growth tax reform. All three subindices increased in the second quarter as well, with the sub-index measuring plans for hiring rising to historically high levels.”
Please see below:
 Source: Business Roundtable
To explain, the first column from the right shows that CEOs have increased their six-month expectations for sales, capital expenditures and employment by 5.9%, 6.4%, and 15.3% respectively from Q1:2021. As a result, both consumers and businesses remain optimistic about the six-month outlook.
Price & Wage Recurring Theme
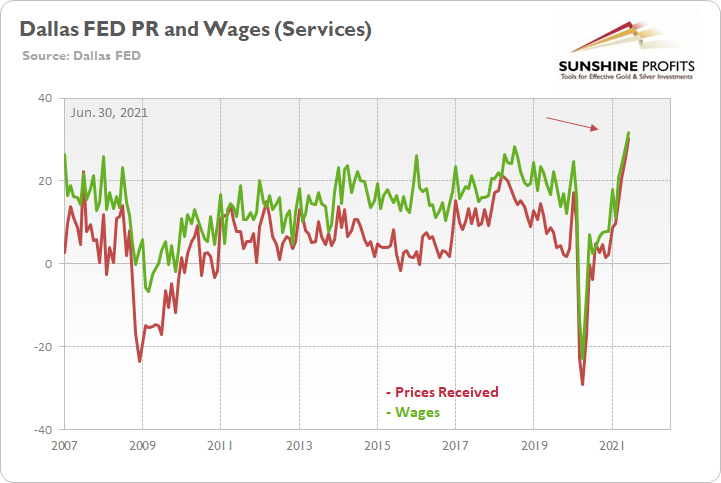
If that wasn’t enough, I highlighted the appetizing insights from the Dallas FED’s Texas Manufacturing Outlook Survey on Jun. 29 (which was released on Jun. 28). And with the Texas Service Sector Outlook Survey released on Jun. 29, the report was just as revealing. To explain, while the revenue index declined from 23.9 in May to 16.7 in June, COVID-19 has been much harder on services than manufacturing. As such, a volatile recovery is expected. However, even amid the up-and-down performance, a recurring theme continues to emerge:
“Price and wage pressures further accelerated in June. The wages and benefits index rose from 26.9 to a record high of 31.4, with more than one-third of contacts increasing wages compared with May. The selling prices index increased five points to 28.6, a new all-time high, while the input prices index inched up one point to 44.9—its highest reading since 2008.”
Please see below:
On top of that, the Texas Retail Outlook Survey was also signing a similar tune:
“Retailers saw continued increases in price and wage pressures in June. The selling prices index surged over 11 points to 57.4, with over 60% of firms reporting increased prices compared with the previous month. The input prices index increased nearly seven points to 59.2, a record high in the survey, while the wages and benefits index rose from 15.4 to 20.2.”
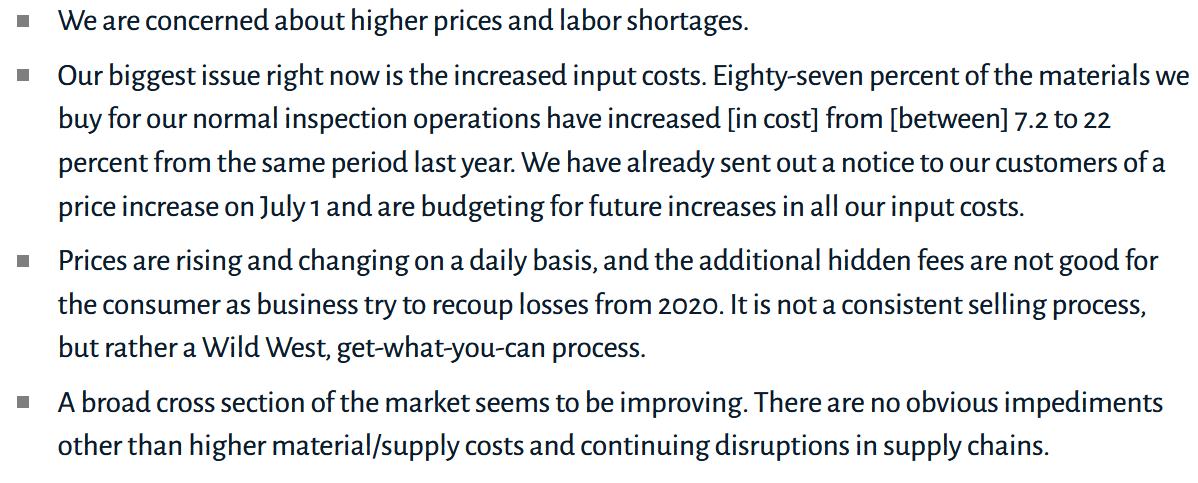
Moreover, because the devil is in the details, please have a look at the anecdotal evidence:
Rental and Leasing Services:
“Anyone who wants to argue inflation is not coming does not live in the world most of us live in; it's here! Wage pressure has gone through the roof as the politicians so artfully, stealthily, executively ordered it into existence with their “relief” payments. “
Management of Companies and Enterprises:
“Construction costs and lead times for materials are the biggest issues right now — that, and [the] lack of suitable inventory in all asset classes.”
“Inflation is starting to impact consumer and business spending trends as increases in food costs, fuel and construction costs are tightening belts and postponing building projects, etc.”
Administrative and Support Services:
“Prices are rapidly increasing. We are unable to find labor.”
“Construction-related inflation is as high as I have ever seen it in 30 years.”
In addition, the respondents added:
 Source: Dallas FED
The bottom line?
With the inflationary storm surge poised to collide with a resurgent U.S. labor force in the coming months, the FED is fighting a losing battle. And with a taper announcement poised to uplift the USD Index and U.S. Treasury yields (the front-end with near certainty and the back-end likely), the PMs could face severe selling pressure.
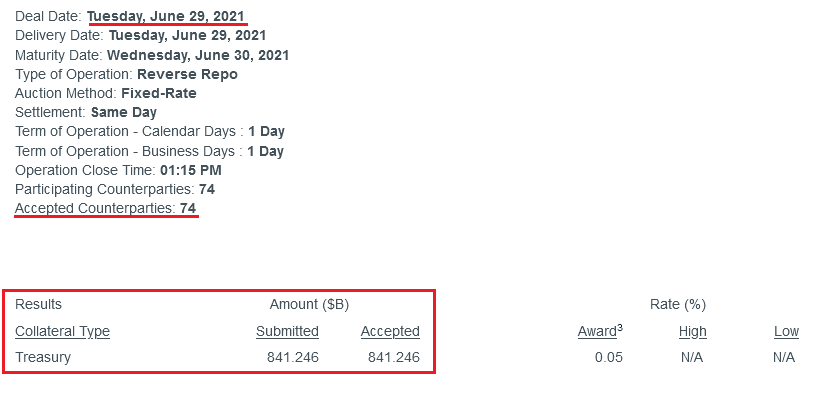
Shadow Taper Behind The Scenes
To that point, while investors still haven’t been clued in on the ramifications, the FED’s reverse repurchase agreements hit another all-time high on Jun. 29. And with 74 counterparties siphoning more than $841 billion out of the U.S. financial system, we’re already witnessing a shadow taper.
Please see below:
 Source: New York FED
For context, I wrote previously:
A reverse repurchase agreement (repo) occurs when an institution offloads cash to the FED in exchange for a Treasury security (on an overnight or short-term basis). And with U.S. financial institutions currently flooded with excess liquidity, they’re shipping cash to the FED at an alarming rate.
More importantly, though, after the $400 billion level was breached in December 2015, the FED’s rate-hike cycle began. On top of that, the liquidity drain is at extreme odds with the FED’s QE program. For example, the FED aims to purchase a combined $120 billion worth of Treasuries and mortgage-backed securities per month. However, with daily reverse repurchase agreements averaging $520 billion since May 21, the FED has essentially negated 4.33 months’ worth of QE in the last month alone.
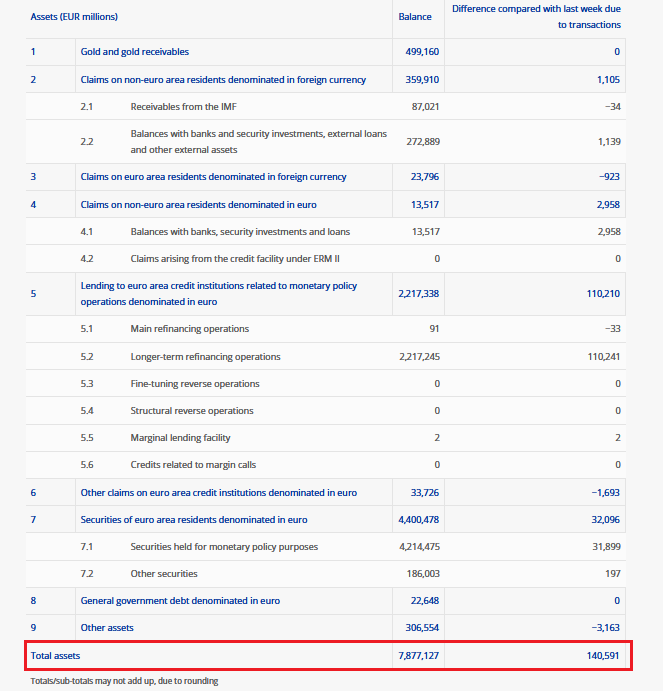
In addition, the EUR/USD – which accounts for nearly 58% of the movement of the USD Index – has come down from its recent sugar high. And with the European Central Bank (ECB) revealing on Jun. 29 that its balance sheet increased by more than €140 billion week-over-week (WoW), the continued splurge supports a lower EUR/USD.
Please see below:
 Source: ECB
For context, both the FED and the ECB have increased the pace of their asset purchases in recent weeks. However, the FED’s shopping spree has been more than offset by the liquidity drain from the reverse repos. On top of that, even before the Jun. 29 revelation, the ECB’s balance sheet was a much greater proportion of regional GDP.
Please see below:
 Source: Robin Brooks/Institute of International Finance (IIF)
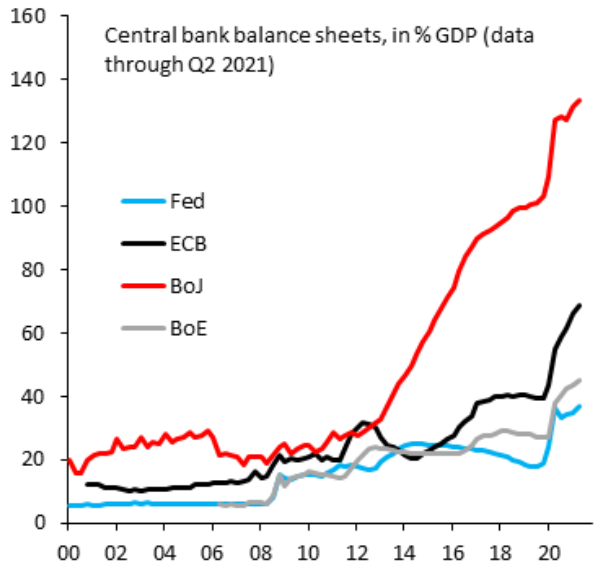
To explain, the blue line above tracks the FED’s balance sheet as a percentage of U.S. GDP, while the black line above tracks the ECB’s balance sheet as a percentage of Eurozone GDP. If you analyze the right side of the chart, you can see that the ECB is tracking well ahead of the FED. Additionally, if you analyze the red line (Bank of Japan) and the gray line (Bank of England), their spending habits also depict why the ‘death of the dollar’ narrative was extremely overblown. As a result, the USD/JPY and the GBP/USD could also be ripe for a re-rating.
As further evidence, data from Vanda Research reveals that the USD sentiment is beginning to shift. And with the tide turning, short-covering fury could add further momentum to the USD Index’s recent revival.
Please see below:
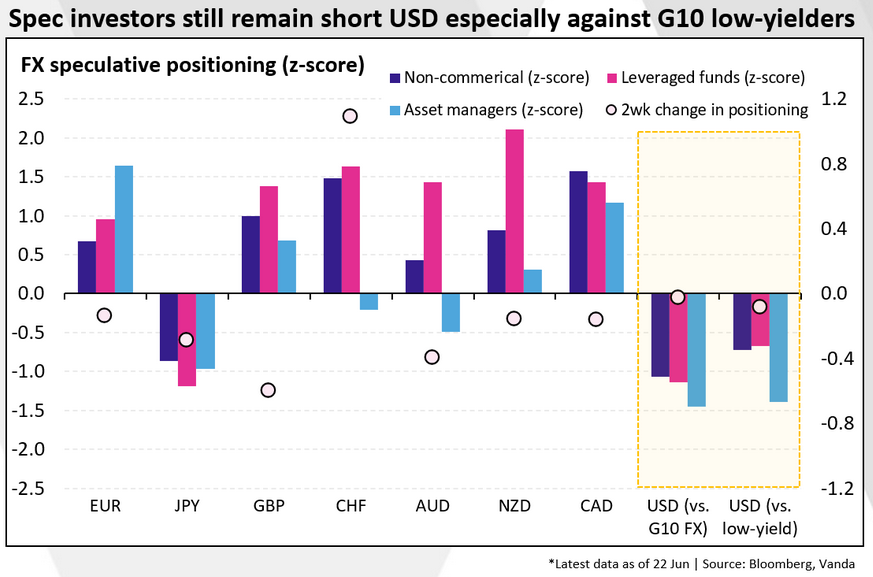
To explain, the dark blue, pink and light blue bars above track the positioning (z-score) of speculative futures traders, asset managers and leveraged funds. If you analyze the various columns, you can see that the trio is long EUR, GBP, and CAD and short USD (and JPY). However, if you follow the various white circles, you can see that over the last two weeks, the trio has reduced its long exposure to EUR, GBP (the most) and CAD, while also reducing its short exposure to USD (and JPY). As a result, with investors always looking to front-run the fundamentals, the USD Index should price in the developments well before September arrives.
National Home Price Index
Finally, while deflationists often cite plunging sentiment for housing and motor vehicles (which is valid) as evidence of a forthcoming shift, the S&P/Case-Shiller U.S. National Home Price Index (NHPI) hit a new all-time high on Jun. 29. Moreover, Craig J. Lazzara, Managing Director and Global Head of Index Investment Strategy at S&P DJI, had this to say:
“April’s performance was truly extraordinary. The 14.6% gain in the National Composite is literally the highest reading in more than 30 years of S&P CoreLogic Case-Shiller data. Housing prices in all 20 cities rose; price gains in all 20 cities accelerated; price gains in all 20 cities were in the top quartile of historical performance.”
Thus, while there are several “bubbles” floating throughout the financial markets that are poised to pop, the important question is when, not if, reality will rear its ugly head. As such, with a collapse in the U.S. housing market unlikely to occur over the next six months, the thesis of higher inflation, GDP growth, Treasury yields, FED’s taper and lower precious metals prices remains the most likely outcome.
Please see below:
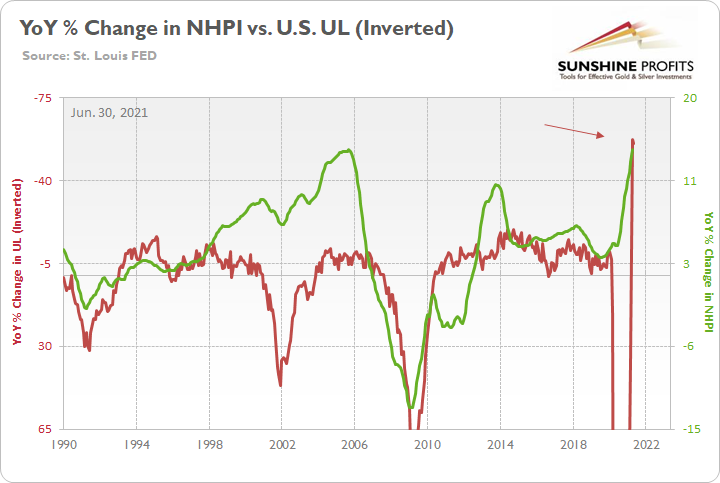
To explain, the green line above tracks the year-over-year (YoY) percentage change in the NHPI, while the red line above tracks the inverted YoY percentage change in the number of unemployed U.S. citizens. For context, inverted means that the latter’s scale is flipped upside down and that a rising red line represents falling U.S. unemployment, while a falling red line represents rising U.S. unemployment.
If you analyze the relationship, you can see that rising U.S. unemployment often coincides with falling U.S. home prices. More importantly, though, with unemployment already declining precipitously (as depicted by the rising red line on the right side of the chart), enhanced unemployment benefits expiring and record job openings poised to boost U.S. nonfarm payrolls in August and September, the U.S. housing market is unlikely to collapse in the near future.
In conclusion, the PMs suffered another drawdown on Jun. 29, and the fundamentals signal an ominous environment as we approach August and September. With the USD Index hitting its stride and dovish FED officials suddenly sounding hawkish, rising U.S. nonfarm payrolls could inflict plenty of pain on the PMs. And while the Jul. 2 print may not capture the full extent of the momentum – as enhanced unemployment benefits are still in play – clouds are forming and the weather is turning. Furthermore, with investing all about front-running the price action, market participants will likely seek shelter long before the fundamental storm arrives.
Overview of the Upcoming Part of the Decline
- The barely visible corrective upswing in gold might already be over, and another huge decline is likely just around the corner.
- After miners slide in a meaningful and volatile way, but silver doesn’t (and it just declines moderately), I plan to switch from short positions in miners to short positions in silver. At this time, it’s too early to say at what price levels this would take place – perhaps with gold close to $1,600. I plan to exit those short positions when gold shows substantial strength relative to the USD Index, while the latter is still rallying. This might take place with gold close to $1,350 - $1,500 and the entire decline (from above $1,900 to about $1,475) would be likely to take place within 6-20 weeks, and I would expect silver to fall the hardest in the final part of the move. This moment (when gold performs very strongly against the rallying USD and miners are strong relative to gold – after gold has already declined substantially) is likely to be the best entry point for long-term investments, in my view. This might also happen with gold close to $1,475, but it’s too early to say with certainty at this time.
- As a confirmation for the above, I will use the (upcoming or perhaps we have already seen it?) top in the general stock market as the starting point for the three-month countdown. The reason is that after the 1929 top, gold miners declined for about three months after the general stock market started to slide. We also saw some confirmations of this theory based on the analogy to 2008. All in all, the precious metals sector would be likely to bottom about three months after the general stock market tops.
- The above is based on the information available today, and it might change in the following days/weeks.
Please note that the above timing details are relatively broad and “for general overview only” – so that you know more or less what I think and how volatile I think the moves are likely to be – on an approximate basis. These time targets are not binding or clear enough for me to think that they should be used for purchasing options, warrants or similar instruments.
Summary
To summarize, even though gold could still move somewhat higher in the near term, it seems that having a short position in the junior mining stocks is much more justified from the risk-to-reward point of view than having a long one in any part of the precious metals market. Gold miners’ underperformance along with a self-similar pattern in the USD Index (pointing to the breather being over) and the length of the “bottoming” process in gold that no longer resembles a bottom (but rather a pause within a slide) all make the bearish outlook justified from the risk-to-reward point of view.
After the sell-off (that takes gold to about $1,350 - $1,500), I expect the precious metals to rally significantly. The final part of the decline might take as little as 1-5 weeks, so it's important to stay alert to any changes.
Most importantly, please stay healthy and safe. We made a lot of money last March and this March, and it seems that we’re about to make much more on the upcoming decline, but you have to be healthy to enjoy the results.
As always, we'll keep you - our subscribers - informed.
By the way, we’re currently providing you with a possibility to extend your subscription by a year, two years or even three years with a special 20% discount. This discount can be applied right away, without the need to wait for your next renewal – if you choose to secure your premium access and complete the payment upfront. The boring time in the PMs is definitely over and the time to pay close attention to the market is here. Naturally, it’s your capital, and the choice is up to you, but it seems that it might be a good idea to secure more premium access now, while saving 20% at the same time. Our support team will be happy to assist you in the above-described upgrade at preferential terms – if you’d like to proceed, please contact us.
To summarize:
Trading capital (supplementary part of the portfolio; our opinion): Full speculative short positions (300% of the full position) in mining stocks are justified from the risk to reward point of view with the following binding exit profit-take price levels:
Mining stocks (price levels for the GDXJ ETF): binding profit-take exit price: $24.12; stop-loss: none (the volatility is too big to justify a stop-loss order in case of this particular trade)
Alternatively, if one seeks leverage, we’re providing the binding profit-take levels for the JDST (2x leveraged) and GDXD (3x leveraged – which is not suggested for most traders/investors due to the significant leverage). The binding profit-take level for the JDST: $39.87; stop-loss for the JDST: none (the volatility is too big to justify a SL order in case of this particular trade); binding profit-take level for the GDXD: $94.87; stop-loss for the GDXD: none (the volatility is too big to justify a SL order in case of this particular trade).
For-your-information targets (our opinion; we continue to think that mining stocks are the preferred way of taking advantage of the upcoming price move, but if for whatever reason one wants / has to use silver or gold for this trade, we are providing the details anyway.):
Silver futures upside profit-take exit price: unclear at this time - initially, it might be a good idea to exit, when gold moves to $1,512.
Gold futures upside profit-take exit price: $1,512.
Long-term capital (core part of the portfolio; our opinion): No positions (in other words: cash
Insurance capital (core part of the portfolio; our opinion): Full position
Whether you already subscribed or not, we encourage you to find out how to make the most of our alerts and read our replies to the most common alert-and-gold-trading-related-questions.
Please note that we describe the situation for the day that the alert is posted in the trading section. In other words, if we are writing about a speculative position, it means that it is up-to-date on the day it was posted. We are also featuring the initial target prices to decide whether keeping a position on a given day is in tune with your approach (some moves are too small for medium-term traders, and some might appear too big for day-traders).
Additionally, you might want to read why our stop-loss orders are usually relatively far from the current price.
Please note that a full position doesn't mean using all of the capital for a given trade. You will find details on our thoughts on gold portfolio structuring in the Key Insights section on our website.
As a reminder - "initial target price" means exactly that - an "initial" one. It's not a price level at which we suggest closing positions. If this becomes the case (like it did in the previous trade), we will refer to these levels as levels of exit orders (exactly as we've done previously). Stop-loss levels, however, are naturally not "initial", but something that, in our opinion, might be entered as an order.
Since it is impossible to synchronize target prices and stop-loss levels for all the ETFs and ETNs with the main markets that we provide these levels for (gold, silver and mining stocks - the GDX ETF), the stop-loss levels and target prices for other ETNs and ETF (among other: UGL, GLL, AGQ, ZSL, NUGT, DUST, JNUG, JDST) are provided as supplementary, and not as "final". This means that if a stop-loss or a target level is reached for any of the "additional instruments" (GLL for instance), but not for the "main instrument" (gold in this case), we will view positions in both gold and GLL as still open and the stop-loss for GLL would have to be moved lower. On the other hand, if gold moves to a stop-loss level but GLL doesn't, then we will view both positions (in gold and GLL) as closed. In other words, since it's not possible to be 100% certain that each related instrument moves to a given level when the underlying instrument does, we can't provide levels that would be binding. The levels that we do provide are our best estimate of the levels that will correspond to the levels in the underlying assets, but it will be the underlying assets that one will need to focus on regarding the signs pointing to closing a given position or keeping it open. We might adjust the levels in the "additional instruments" without adjusting the levels in the "main instruments", which will simply mean that we have improved our estimation of these levels, not that we changed our outlook on the markets. We are already working on a tool that would update these levels daily for the most popular ETFs, ETNs and individual mining stocks.
Our preferred ways to invest in and to trade gold along with the reasoning can be found in the how to buy gold section. Furthermore, our preferred ETFs and ETNs can be found in our Gold & Silver ETF Ranking.
As a reminder, Gold & Silver Trading Alerts are posted before or on each trading day (we usually post them before the opening bell, but we don't promise doing that each day). If there's anything urgent, we will send you an additional small alert before posting the main one.
Thank you.
Przemyslaw Radomski, CFA
Founder, Editor-in-chief

