

Briefly: in our opinion, full (100% of the regular position size) speculative long positions in gold are justified from the risk/reward point of view at the moment of publishing this Alert. We’re moving the profit-take levels lower.
I will begin today’s analysis with a question that I have just received – I think that many more people are asking themselves the same thing:
Are you still confident in a push-up here before the continuation to the downside?
Given the recent sideways trend in gold, I will rephrase this question a bit:
Will Gold Get Tired of Doing Push-Ups?
In short, I do think that the precious metals market is going to move briefly higher before continuing to decline, but based on what happened (and mostly, based on what didn’t happen) it seems that the potential for this counter-trend rally is smaller than it seemed initially. Every mediocre push-up along the way makes the final one smaller.
I had closed the previous short positions and opened the current long ones based on several factors, and they could be divided into two categories:
- Factors based on similarity to how the situation developed in 2012
- Other factors
Generally, the “other factors” like the Fibonacci retracements, breakouts, indicators, etc. remain up-to-date. However, back in 2012, gold rallied immediately after the initial bottom, and it’s now clear that it didn’t happen this time. Gold is moving back and forth instead.
One possible reason could be that gold has simply not started its corrective upswing yet, and it’s just delayed.
Another possible reason, however, could be that the situation is more bearish than it was in 2012, and therefore, we won’t see as significant corrections as we did in 2012. After all, we are likely in the final part of the decline that started when gold invalidated its long-term breakout above its all-time high (just like in 2008), and this was not the case in 2012.
Yet another possible reason is the link to the general stock market. If we’re about to see the top in the stock market, then gold (and the rest of the PM sector) is likely to bottom about 3-3.5 months after that top (similarly to what happened with gold stocks in 1929). Additionally, let’s keep in mind that the 2012 – 2013 decline (counting to the June 2013 bottom) took about 6 months. So, if the current decline is going to take only half the time of the previous huge decline, then it will be natural for corrections to be shorter and/or smaller on average.
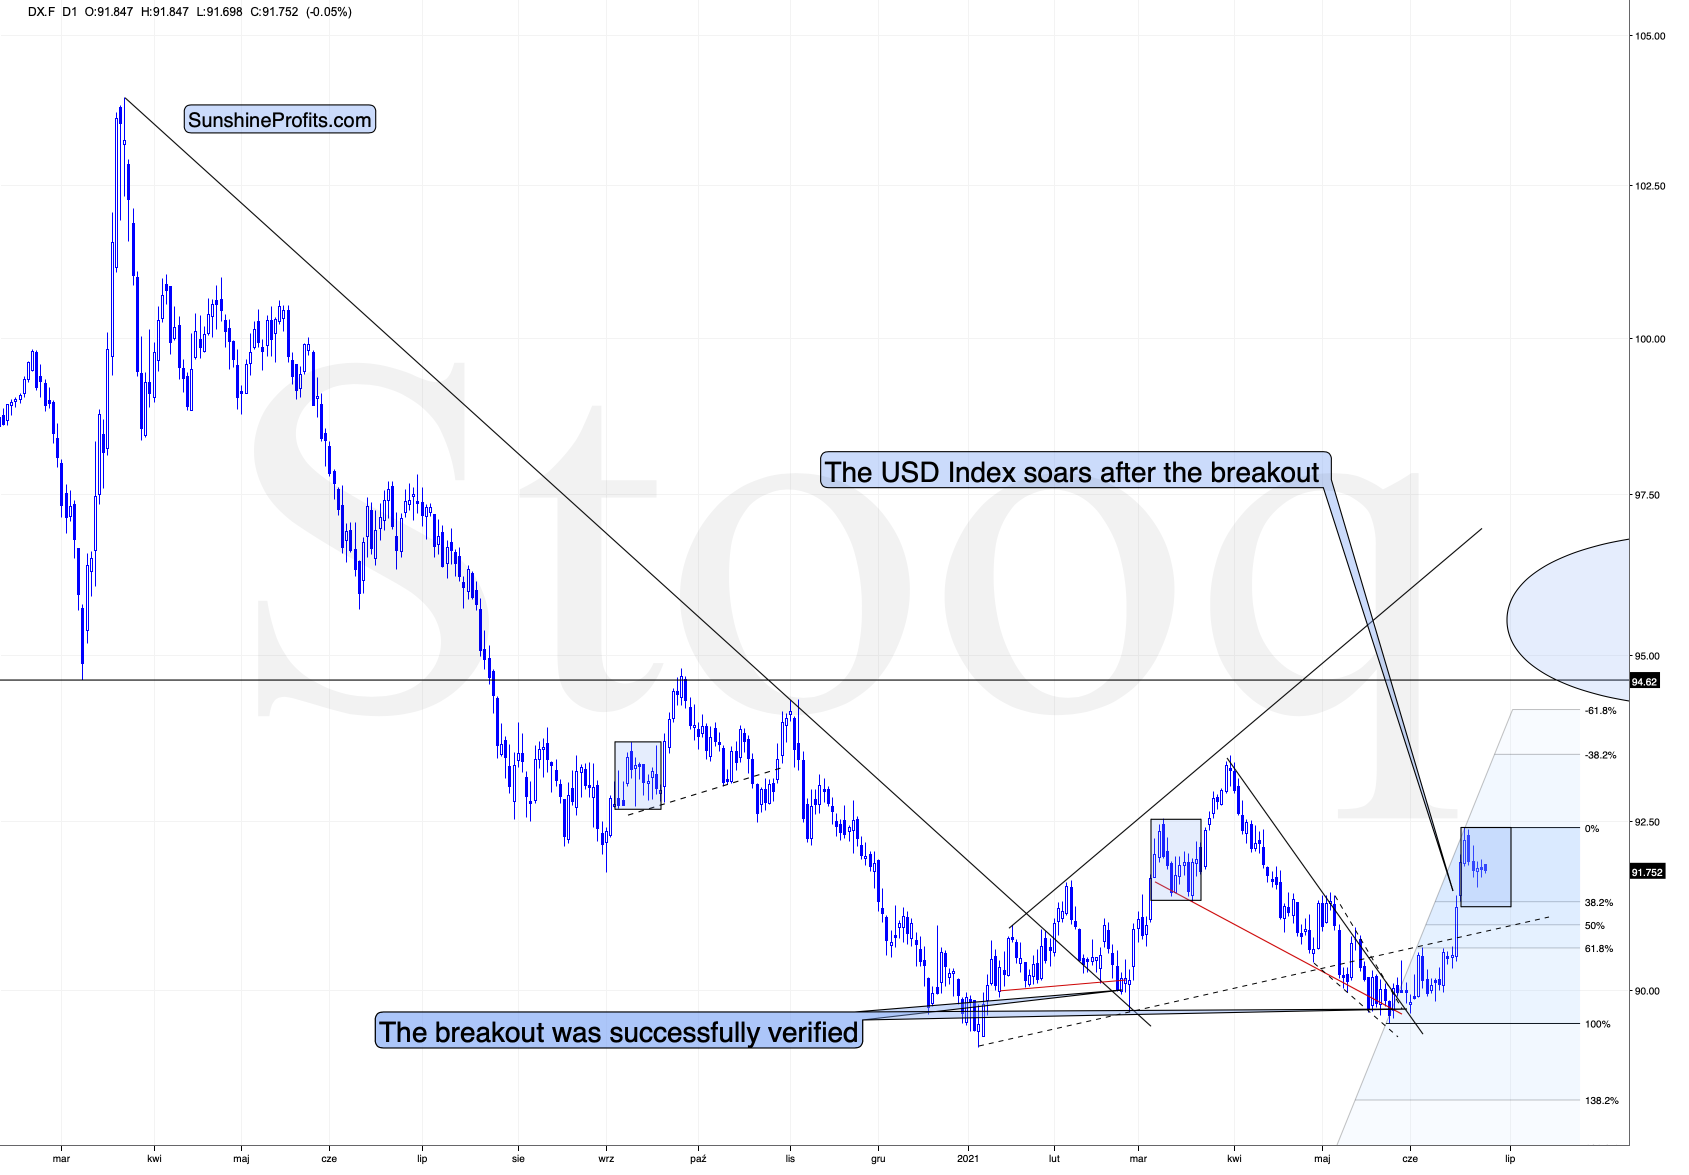
So, while the 2012 – now analogy doesn’t provide us with decisive details, it’s useful to turn to the analogy that appears to remain intact – the one in the USD Index that points to it performing similarly as it did in 2016.
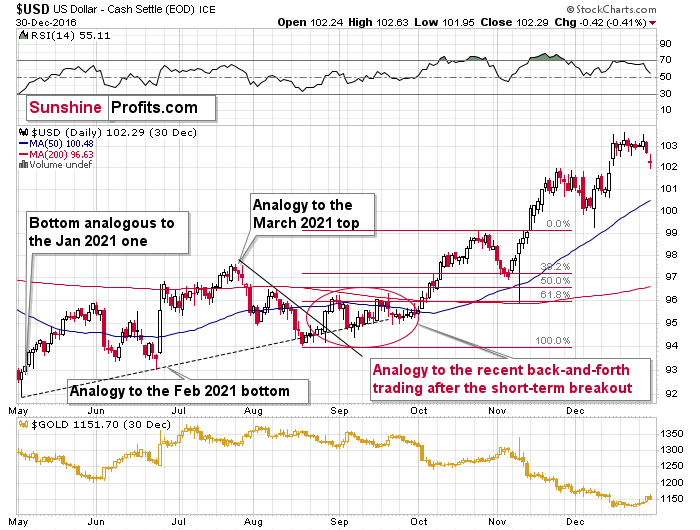
Back in 2016, the USD Index broke above its short-term declining resistance line, moved a bit below its rising support (dashed) line, consolidated for about a month and then rallied visibly.
We saw the same thing recently.
Then, (back in 2016 again) the USD Index corrected to approximately its 38.2% Fibonacci retracement before rallying once again. In fact, it moved slightly below it. There was also a huge intraday reversal in the following days, but it was an event-driven one (it was when Donald Trump won the elections), so it’s unlikely to be repeated.
Currently, the 38.2% Fibonacci retracement is at about 91.3, so the USDX could bottom close to this level. Now, this might not seem like a big deal, as that’s only 0.45 away from the current price (at the moment of writing these words), but it becomes quite important once one considers what happened in gold during the final part of the move to the 38.2% retracement in 2016. That was when gold made most of its gains.
Consequently, it seems that gold is going to rally from here (it’s already higher in today’s pre-market trading), but I don’t think that it’s justified to bet on gold’s repeat of the 2012 correction, during which it corrected about 61.8% of its previous decline. Instead, it seems more likely to me that gold will rally less before topping.
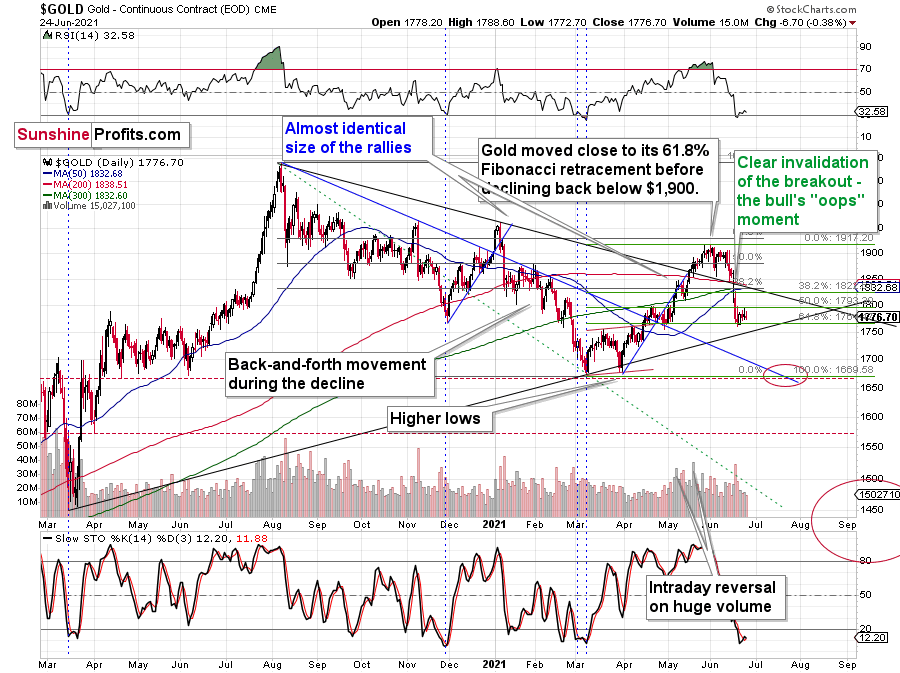
If so, then how high is gold likely to move?
The above chart doesn’t provide us with many clues, so let’s zoom in for more details.
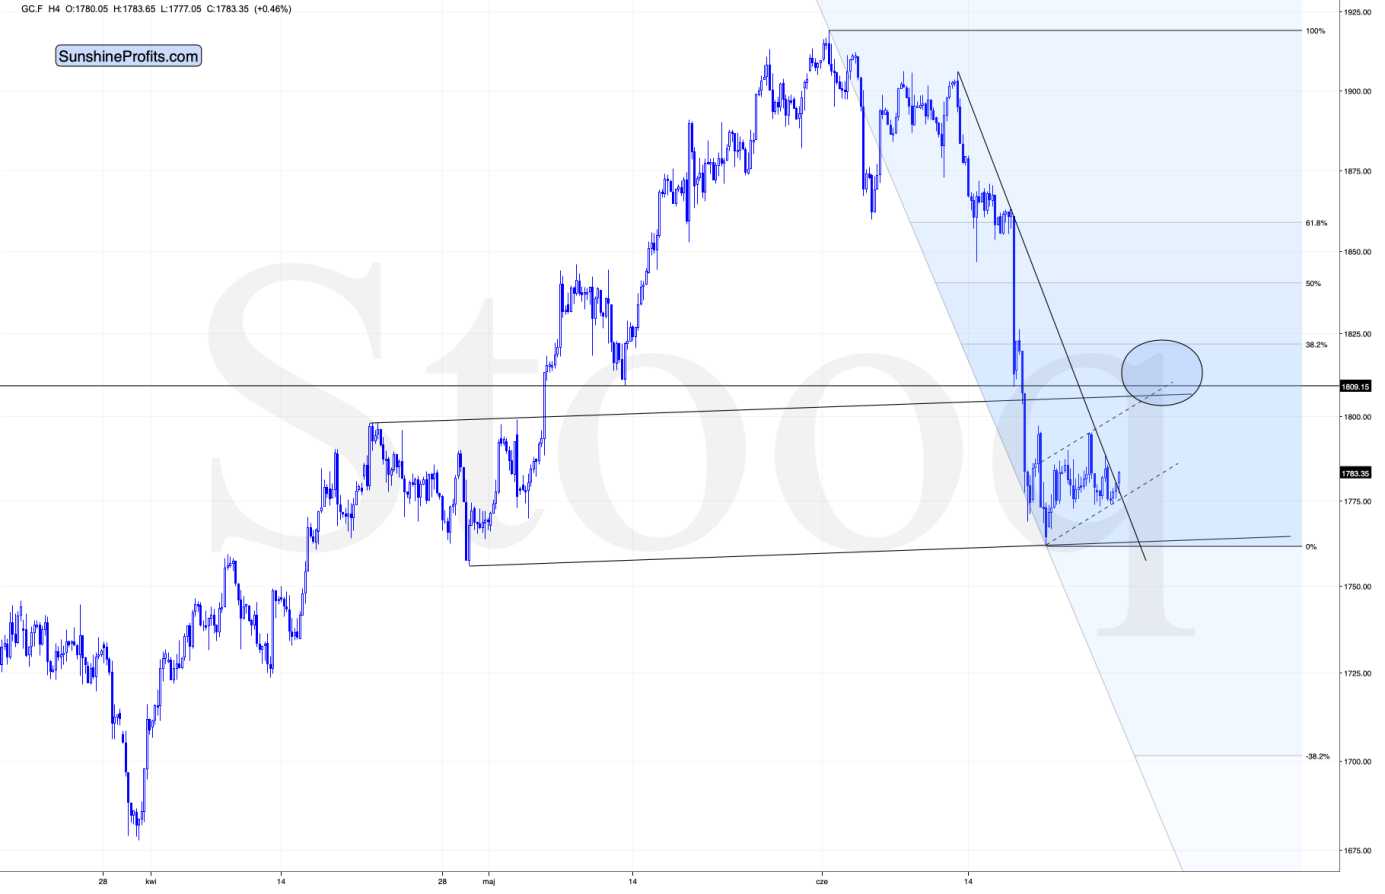
The above chart shows that the easy part of the rally ends at about $1,805. Slightly above it, we can see the upper border of the potential symmetrical head-and-shoulders pattern, the upper border of the potential flag pattern (dashed lines), as well as the mid-May and mid-June lows level. A bit higher, we can see the 38.2% Fibonacci retracement level.
Moreover, the above chart features a small (but still) breakout above the declining resistance line. Based on it, gold might finally rally more visibly, just as it did in 2016.
So, while this correction is likely to be relatively small, the next one – that could start when gold reaches its yearly lows (marked on the previous chart with a red ellipse) – will likely be more visible.
Having said that, let’s take a look at the markets from a more fundamental point of view.
Banking on a Comeback
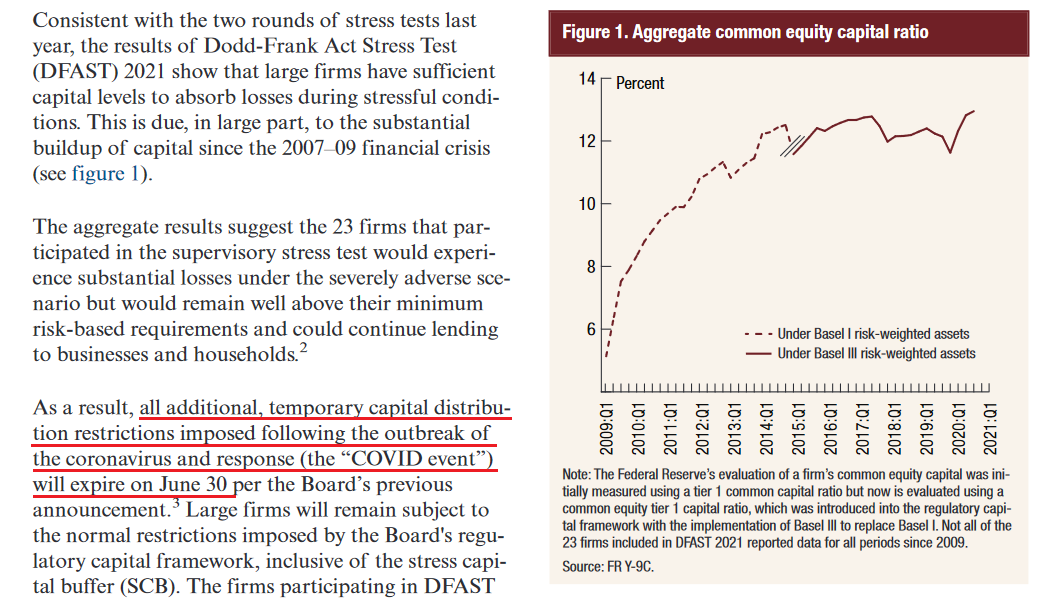
With the U.S. Federal Reserve (FED) releasing its annual bank stress tests on Jun. 24, Vice Chairman for Supervision Randal Quarles said that “the banking system is strongly positioned to support the ongoing recovery." For context, the FED’s stress tests analyze the health of U.S. banks’ balance sheets and reveal how they would fare if hypothetical economic doomsdays were to occur.
And while Chairman Jerome Powell told Congress on Jun. 22 that the U.S. economy "is still a ways off," the results of the stress tests are a contradiction. Case in point: the report revealed that since “all 23 large banks tested remained well above their risk-based minimum capital requirements […] the additional restrictions put in place during the COVID event will end.”
Translation? The FED will allow U.S. banks – like JPMorgan, Bank of America and Citigroup – to resume share buybacks and standard dividend payments (roughly $130 billion worth) as of next month.
Please see below:
 Source: U.S. FED
On top of that, the FED considers the following a scary situation:
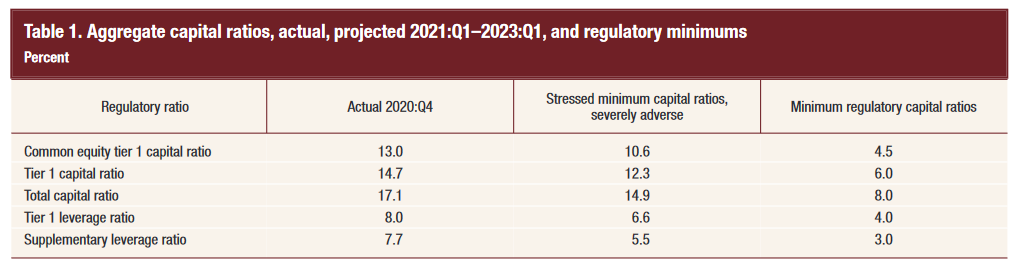
“The severely adverse scenario is characterized by a severe global recession accompanied by a period of heightened stress in CRE and corporate debt markets. The U.S. unemployment rate climbs to a peak of 10-3/4 percent in the third quarter of 2022, a 4 percentage point increase relative to its fourth quarter 2020 level. Real GDP falls 4 percent from the end of the fourth quarter of 2020 to its trough in the third quarter of 2022. The decline in activity is accompanied by a lower headline consumer price index (CPI).”
However, even if this hypothetical malaise occurs, the FED believes that all 23 banks will pass the test with flying colors.
Please see below:
 Source: U.S. FED
To explain, the third column from the left depicts the banks’ regulatory capital ratios under the “severely adverse scenario.” Moreover, if you compare the results with the fourth column from the left, you can see that even if an economic meteor strikes, participants’ ratios will still remain above their regulatory minimums. For context, common equity tier 1 capital (CET1) is the most liquid source of banks’ capital, and the CET1 ratio is used to gauge banks’ ability to absorb losses should an economic shock occur.
But why is all of this so important?
Well, if the FED was so worried about the U.S. economy, would it allow financial institutions to frivolously spend their collateral on dividends and share buybacks? Remember, U.S. banks supply credit card loans, mortgages, commercial loans and finance the sectors that were hardest hit by COVID-19 (commercial real estate, hospitality, energy, etc.). Thus, with the FED giving banks the ‘all-clear,’ it’s a sign that the U.S. economy is much stronger than the FED lets on.
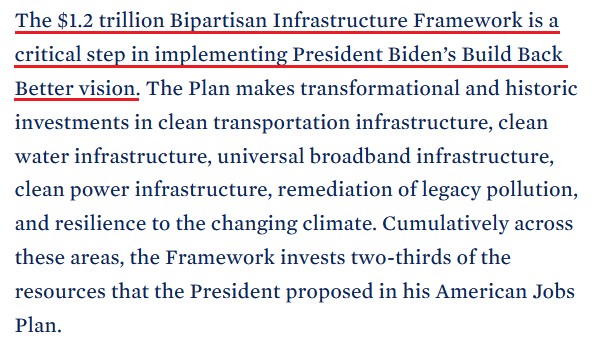
In addition, The White House announced on Jun. 24 that a $1.2 trillion infrastructure deal was reached. And calling the milestone “the largest federal investment in public transit in history and the largest federal investment in passenger rail since the creation of Amtrak,” lawmakers want to cook the U.S. economy until it boils. For context, the agreement includes $579 billion of new spending with the rest being diverted from untapped coronavirus-relief funds.
Please see below:
 Source: The White House
More importantly, though, with U.S. lawmakers hell-bent on pushing the limits of inflation and economic growth, the ominous impulse remains bullish for the U.S. 10-Year Treasury yield and the USD Index. Regarding the latter, if U.S. GDP growth outperforms the Eurozone, the EUR/USD – which accounts for nearly 58% of the movement of the USD Index – should suffer in the process. Likewise, with the U.S. 10-Year Treasury yield materially undervalued relative to realized inflation and prospective GDP growth, unprecedented spending should put upward pressure on interest rates. Furthermore, the bullish cocktail should force the FED to taper its asset purchases in September.
To explain, while the PMs are allergic to a rising U.S. 10-Year Treasury yield, the latter doesn’t have to move for the metals to suffer. For example, following the FED’s announcement on Jun. 16, the U.S. 2-Year, 3-Year and 5-Year Treasury yields surged. And while the development flattened the U.S. yield curve – meaning that short-term interest rates rose while long-term interest rates stood pat – the PMs still suffered significant drawdowns. Thus, while the U.S. 10-Year Treasury yield remains ripe for an upward re-rating, even if it stays in consolidation mode, short-term interest rate pressures are just as ominous.
Will We See Another Inflation Surprise?
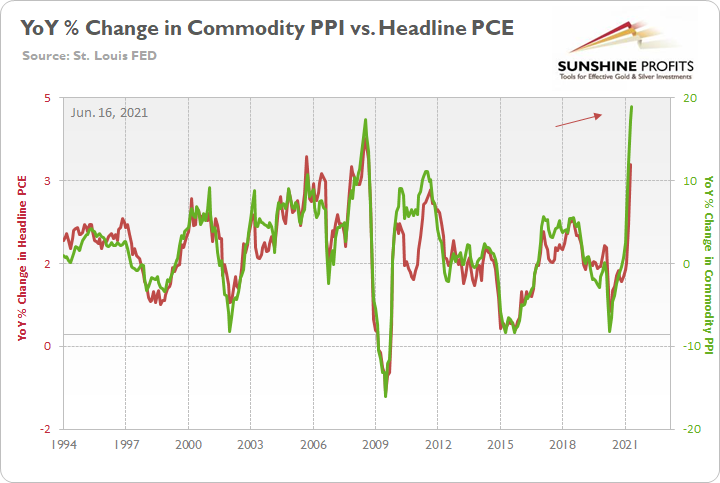
To that point, with the Personal Consumption Expenditures (PCE) Index scheduled for release today, another inflation ‘surprise’ could rattle the bond market once again. To explain, I wrote on Jun. 22:
The FED increased its year-over-year (YoY) headline PCE Index forecast from a rise of 2.40% YoY to a rise of 3.40% YoY on Jun. 16. However, with the Commodity Producer Price Index (PPI) surging by 18.98% YoY – the highest YoY percentage increase since 1974 – the wind still remains at inflation’s back. Moreover, with all signs pointing to a YoY print of roughly 4% to 4.50% on Jun. 25, the “transitory” narrative could suffer another blow on Friday.
As further evidence, the Kansas City FED released its Manufacturing Survey on Jun. 24. And with the composite index rising from 26 in May to 27 in June, Chad Wilkerson, vice president and economist at the KC FED, had this to say about the current state of affairs:
“Regional factory activity rose again in June and expectations for future activity were the highest in survey history. While the majority of firms continue to face increasing materials prices and labor shortages, many firms have also increased selling prices and capital expenditures for 2021.”
To that point, while the KC FED’s prices paid and prices received indexes declined slightly from their all-time highs, both gauges remain above their prior historical peaks.
Please see below:
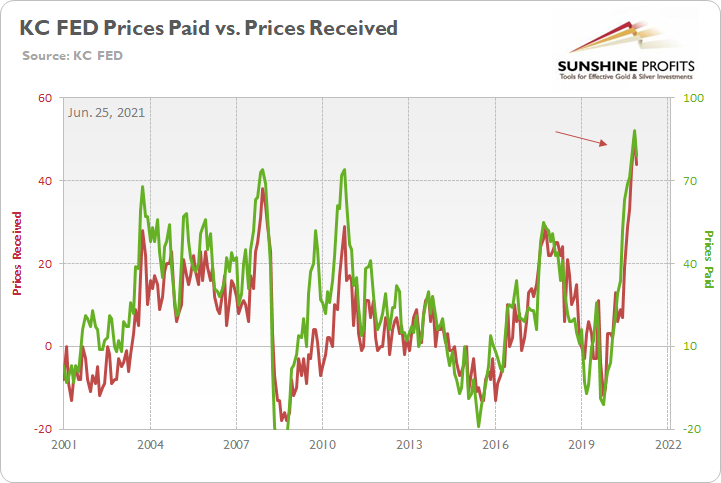
To explain, the green line above tracks the KC FED’s prices paid index, while the red line above tracks the KC FED’s prices received index. If you analyze the right side of the chart, you can see that both remain extremely elevated.
On top of that, survey respondents provided the following anecdotal evidence:
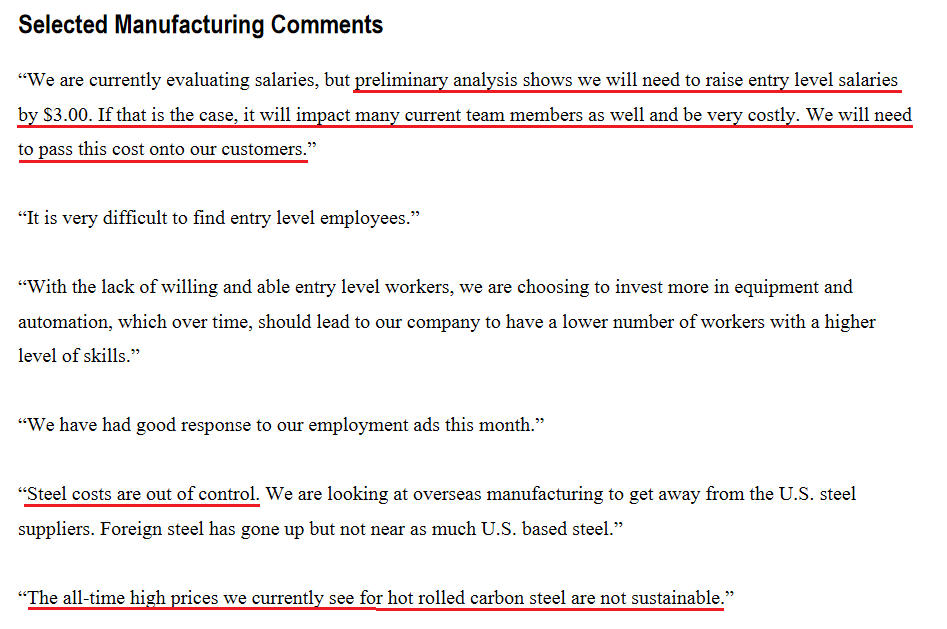 Source: KC FED
Also supportive of future economic growth, U.S. manufacturers spent $36.218 billion on machinery in May (the data was released on Jun. 24) – only a slight decrease from the all-time high of $36.364 billion set in April. And with machinery representative of long-lived assets that have high breakeven costs, the recent splurge signals that manufacturers remain optimistic about the recovery.
Please see below:
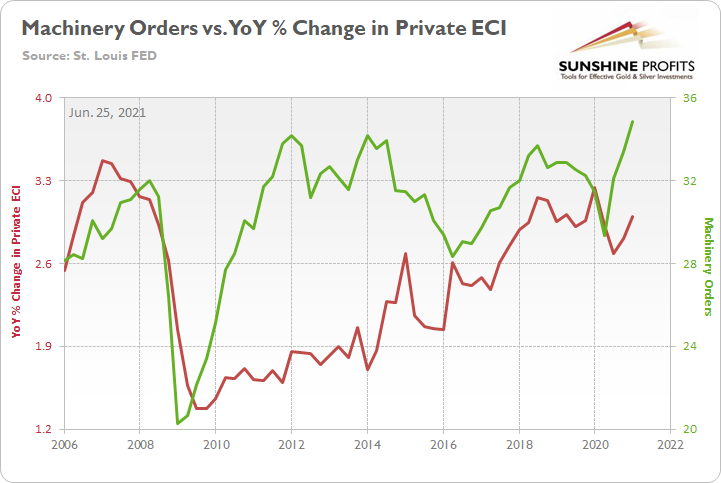
To explain, the green line above tracks manufacturers’ machinery orders, while the red line above tracks the YoY percentage change in the Private Employment Cost Index (ECI). If you analyze the relationship, you can see that when manufacturers invest in long-term equipment, wage inflation often follows. As a result, if the two lines continue their ascent, it will only increase the odds that the FED tapers in September. Forecasting more hawkish, not more dovish FED seems to be appropriate at this time.
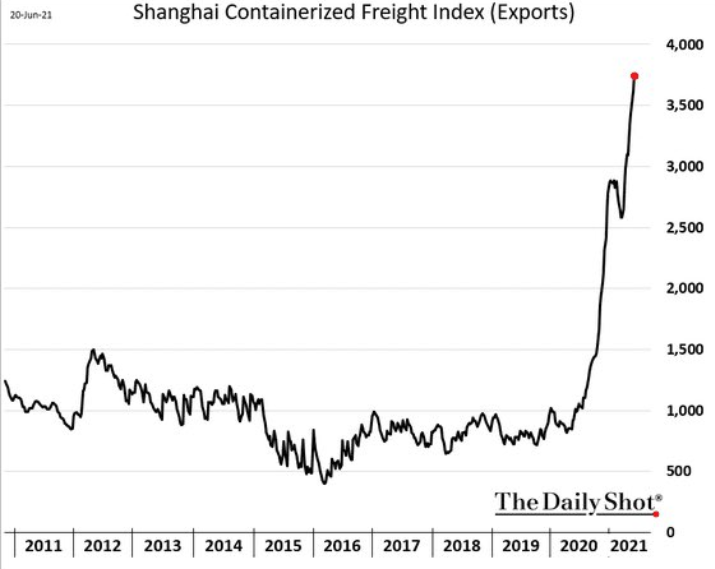
Knock Knock? It’s China, We Want More Money
On top of that, with the U.S. goods trade balance (exports minus imports) revised to -$88.11 billion on Jun. 24, foreign production is required to stock U.S. shelves. And with the Shanghai Containerized Freight Index (the cost to ship from China) unrelenting in its parabolic rise, it’s another indicator that inflationary pressures are unlikely to abate anytime soon.
Finally, with the FED selling another $813 billion worth of reverse repurchase agreements on Jun. 24 (~$53 million below the all-time high set on Jun. 23), the liquidity drain remains on schedule.
Please see below:
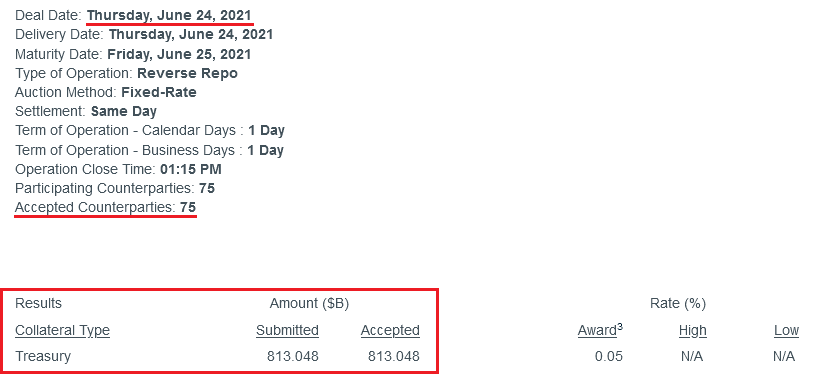 Source: NY FED
To explain the significance, I wrote previously:
A reverse repurchase agreement (repo) occurs when an institution offloads cash to the FED in exchange for a Treasury security (on an overnight or short-term basis). And with U.S. financial institutions currently flooded with excess liquidity, they’re shipping cash to the FED at an alarming rate.
More importantly, though, after the $400 billion level was breached in December 2015, the FED’s rate-hike cycle began. On top of that, the liquidity drain is at extreme odds with the FED’s QE program. For example, the FED aims to purchase a combined $120 billion worth of Treasuries and mortgage-backed securities per month. However, with daily reverse repurchase agreements averaging $520 billion since May 21, the FED has essentially negated 4.33 months’ worth of QE in the last month alone.
In conclusion, while the PMs should recover a meaningful chunk of last week’s downswing, their medium-term outlook isn’t so sanguine. With FED hawks and doves splintered down the middle, the fundamentals are firmly tilted in the former’s favor. And with inflation and U.S. GDP growth both accelerating concurrently, unemployment is the only card left for the doves to play. However, with enhanced unemployment benefits expiring in early July for roughly 30% of claimants, U.S. nonfarm payrolls should show strength in August and September. Thus, with the FED’s taper talk likely to grow louder over the next few months, the PMs may not like what they will hear.
Overview of the Upcoming Part of the Decline
- The corrective upswing seems to be over, and gold seems to have started its big decline – one similar to what we saw in 2008 and 2012-2013. We’re likely to see a short-term bounce, though.
- After miners slide in a meaningful and volatile way, but silver doesn’t (and it just declines moderately), I plan to switch from short positions in miners to short positions in silver. At this time, it’s too early to say at what price levels this would take place – perhaps with gold close to $1,600. I plan to exit those short positions when gold shows substantial strength relative to the USD Index, while the latter is still rallying. This might take place with gold close to $1,350 - $1,500 and the entire decline (from above $1,900 to about $1,475) would be likely to take place within 6-20 weeks, and I would expect silver to fall the hardest in the final part of the move. This moment (when gold performs very strongly against the rallying USD and miners are strong relative to gold – after gold has already declined substantially) is likely to be the best entry point for long-term investments, in my view. This might also happen with gold close to $1,475, but it’s too early to say with certainty at this time.
- As a confirmation for the above, I will use the (upcoming or perhaps we have already seen it?) top in the general stock market as the starting point for the three-month countdown. The reason is that after the 1929 top, gold miners declined for about three months after the general stock market started to slide. We also saw some confirmations of this theory based on the analogy to 2008. All in all, the precious metals sector would be likely to bottom about three months after the general stock market tops.
- The above is based on the information available today, and it might change in the following days/weeks.
Please note that the above timing details are relatively broad and “for general overview only” – so that you know more or less what I think and how volatile I think the moves are likely to be – on an approximate basis. These time targets are not binding or clear enough for me to think that they should be used for purchasing options, warrants or similar instruments.
Summary
To summarize, while the medium-term trend in the precious metals market remains down, it seems that we’re about to see a counter-trend rally shortly. In my opinion, gold is likely to be its main benefactor, and I plan to keep the long position intact only for the easy part of the rally. It could be over within a week, and I expect the big downswing to be resumed within the next 1-2 weeks.
After the sell-off (that takes gold to about $1,350 - $1,500), I expect the precious metals to rally significantly. The final part of the decline might take as little as 1-5 weeks, so it's important to stay alert to any changes.
Most importantly, please stay healthy and safe. We made a lot of money last March and this March, and it seems that we’re about to make much more on the upcoming decline, but you have to be healthy to enjoy the results.
As always, we'll keep you - our subscribers - informed.
By the way, we’re currently providing you with a possibility to extend your subscription by a year, two years or even three years with a special 20% discount. This discount can be applied right away, without the need to wait for your next renewal – if you choose to secure your premium access and complete the payment upfront. The boring time in the PMs is definitely over and the time to pay close attention to the market is here. Naturally, it’s your capital, and the choice is up to you, but it seems that it might be a good idea to secure more premium access now, while saving 20% at the same time. Our support team will be happy to assist you in the above-described upgrade at preferential terms – if you’d like to proceed, please contact us.
To summarize:
Trading capital (supplementary part of the portfolio; our opinion): Full speculative long positions (100% of the full position) in gold are justified from the risk to reward point of view with the following binding exit profit-take price levels:
Gold: binding profit-take exit price: $1,804; stop-loss: none
Alternatively, if one seeks leverage, we’re providing the binding profit-take levels for the UGL. The binding profit-take level for the UGL: $59.38; stop-loss for the UGL: none
Long-term capital (core part of the portfolio; our opinion): No positions (in other words: cash
Insurance capital (core part of the portfolio; our opinion): Full position
Whether you already subscribed or not, we encourage you to find out how to make the most of our alerts and read our replies to the most common alert-and-gold-trading-related-questions.
Please note that we describe the situation for the day that the alert is posted in the trading section. In other words, if we are writing about a speculative position, it means that it is up-to-date on the day it was posted. We are also featuring the initial target prices to decide whether keeping a position on a given day is in tune with your approach (some moves are too small for medium-term traders, and some might appear too big for day-traders).
Additionally, you might want to read why our stop-loss orders are usually relatively far from the current price.
Please note that a full position doesn't mean using all of the capital for a given trade. You will find details on our thoughts on gold portfolio structuring in the Key Insights section on our website.
As a reminder - "initial target price" means exactly that - an "initial" one. It's not a price level at which we suggest closing positions. If this becomes the case (like it did in the previous trade), we will refer to these levels as levels of exit orders (exactly as we've done previously). Stop-loss levels, however, are naturally not "initial", but something that, in our opinion, might be entered as an order.
Since it is impossible to synchronize target prices and stop-loss levels for all the ETFs and ETNs with the main markets that we provide these levels for (gold, silver and mining stocks - the GDX ETF), the stop-loss levels and target prices for other ETNs and ETF (among other: UGL, GLL, AGQ, ZSL, NUGT, DUST, JNUG, JDST) are provided as supplementary, and not as "final". This means that if a stop-loss or a target level is reached for any of the "additional instruments" (GLL for instance), but not for the "main instrument" (gold in this case), we will view positions in both gold and GLL as still open and the stop-loss for GLL would have to be moved lower. On the other hand, if gold moves to a stop-loss level but GLL doesn't, then we will view both positions (in gold and GLL) as closed. In other words, since it's not possible to be 100% certain that each related instrument moves to a given level when the underlying instrument does, we can't provide levels that would be binding. The levels that we do provide are our best estimate of the levels that will correspond to the levels in the underlying assets, but it will be the underlying assets that one will need to focus on regarding the signs pointing to closing a given position or keeping it open. We might adjust the levels in the "additional instruments" without adjusting the levels in the "main instruments", which will simply mean that we have improved our estimation of these levels, not that we changed our outlook on the markets. We are already working on a tool that would update these levels daily for the most popular ETFs, ETNs and individual mining stocks.
Our preferred ways to invest in and to trade gold along with the reasoning can be found in the how to buy gold section. Furthermore, our preferred ETFs and ETNs can be found in our Gold & Silver ETF Ranking.
As a reminder, Gold & Silver Trading Alerts are posted before or on each trading day (we usually post them before the opening bell, but we don't promise doing that each day). If there's anything urgent, we will send you an additional small alert before posting the main one.
Thank you.
Przemyslaw Radomski, CFA
Founder, Editor-in-chief

