

Briefly: in our opinion, full (300% of the regular position size) speculative short positions in junior mining stocks are justified from the risk/reward point of view at the moment of publishing this Alert.
“That’s all Folks!”
- Porky Pig at the end of the Looney Tunes cartoon series
The above is what immediately came to my mind after seeing Friday’s price action in the precious metals sector. Why? Because of the reversals and tiny outperformance of silver.
And also because of USD’s decisive daily rally. Let’s start with the latter.
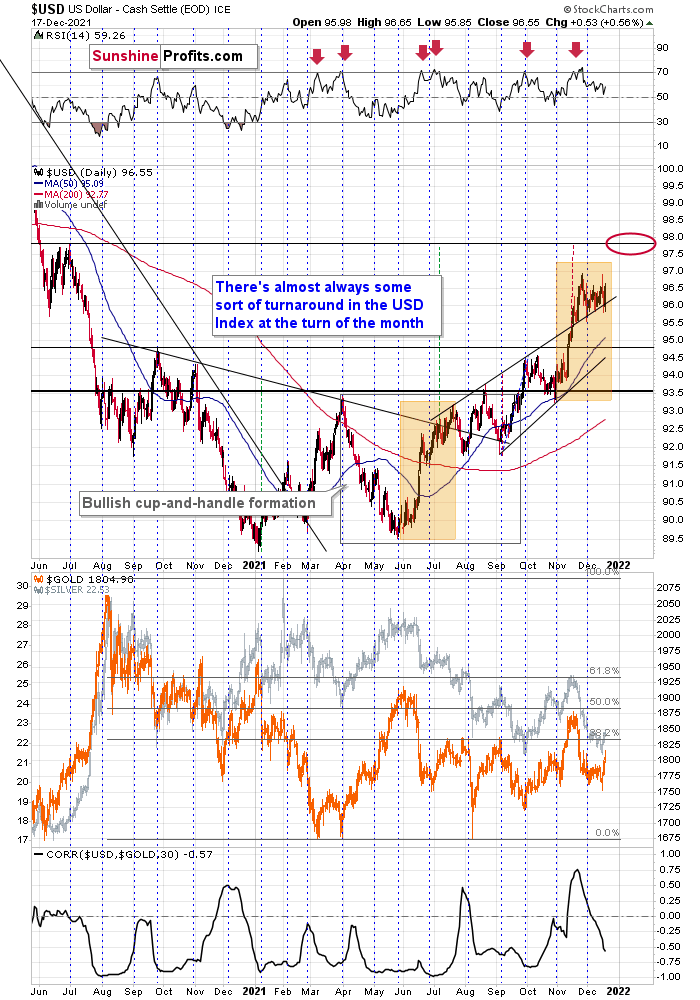
After briefly moving below its rising support line, the USD Index soared back up and the situation is now much more bullish than it was a month ago, when the USD Index was breaking through the 96 level for the first time in many months.
The reason is that now, the USD Index is already after a sizable consolidation. The RSI indicator reflects that as well – it’s no longer in the overbought territory.
And if the USD Index soars once again, precious metals are likely to slide. What we saw in gold, silver, and – in particular – mining stocks on Friday confirms that.
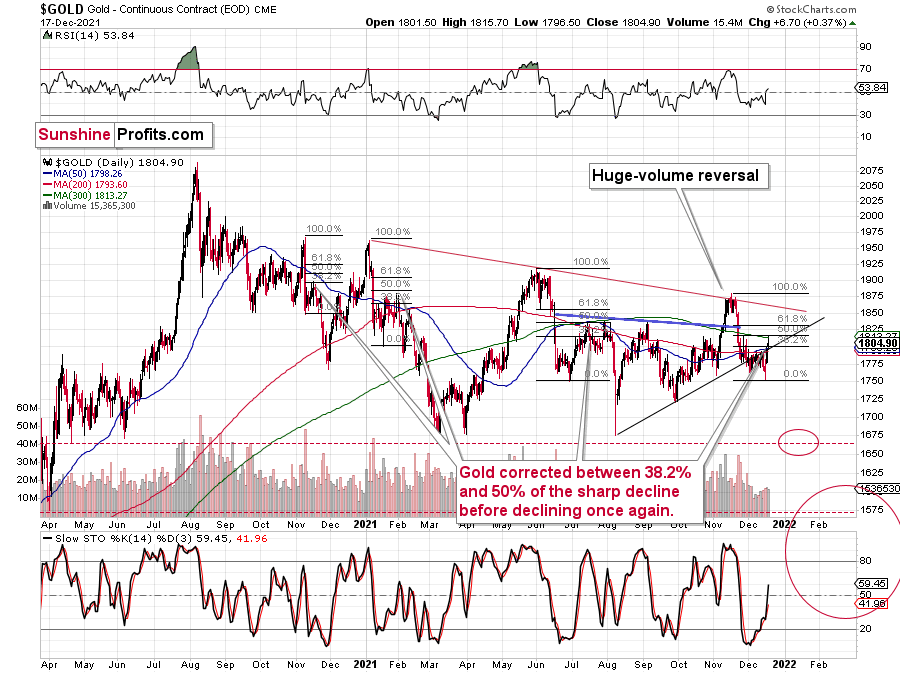
Gold moved to $1,815.70 on Friday, but it’s now once again below $1,800.
This means that the yellow metal moved above its rising support line on Friday, but it ended the day just slightly above it and based on today’s pre-market decline, it’s once again back below this line. The breakout was invalidated.
On Thursday, after gold’s reversal, I wrote the following:
Well, gold moved visibly higher from the recent lows, but:
- It hasn’t invalidated its previous breakdown below the rising red support line
- Even if the size of the very recent rally doubled, gold would not move up that significantly – perhaps to $1,815 or so.
There’s also a risk that gold might rally more visibly because of the similarity to what happened earlier this year.
Well, gold did exactly that. The yellow metal moved to late-November highs on Friday, to its 300-day moving average, and it all happened in tune with the previous patterns and with what I wrote previously.
There’s also another pattern that I marked on the above chart. After the previous sharp declines, gold corrected between 38.2% and 50% of the decline, and only after this consolidation did it move to new lows. We saw that in November 2020, January 2021, and July 2021. And it seems that it’s exactly what we saw right now.
On Thursday, I also wrote the following:
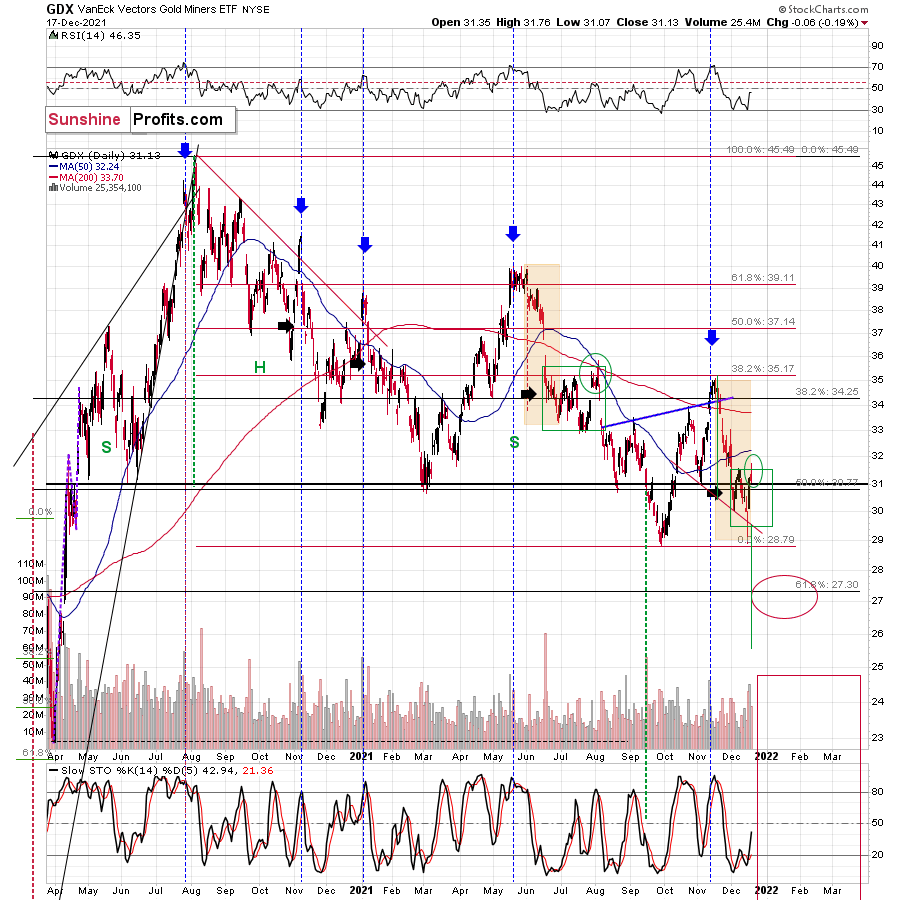
But how much did the mining stocks rally in July?
Please take a look at the areas marked with green rectangles. There was a tiny rally in July 2020, but it was nothing significant, unless one was engaged in day-trading or very short-term trading.
So, will we see a rebound here? That’s probably going to be the case. Will it be significant? That depends.
It might be quite visible in case of gold, but not necessarily in case of mining stocks.
In fact, at the moment of writing these words, gold is trading very close to its December highs, while the GDXJ (in London trading) corrected about 23.6% of the entire December decline.
Consequently, if I had a short position in gold, I would probably close it right now in order to re-enter it at higher prices, but since I don’t have one, but I have a short position in junior mining stocks, I’m choosing to keep it intact and wait out the possible correction.
Well, the corrective upswing in mining stocks wasn’t that significant as the one in gold. Miners moved just slightly above their December highs, but close back below them, thus invalidating this breakout. Unlike gold, they were not even close to reaching their late-November highs.
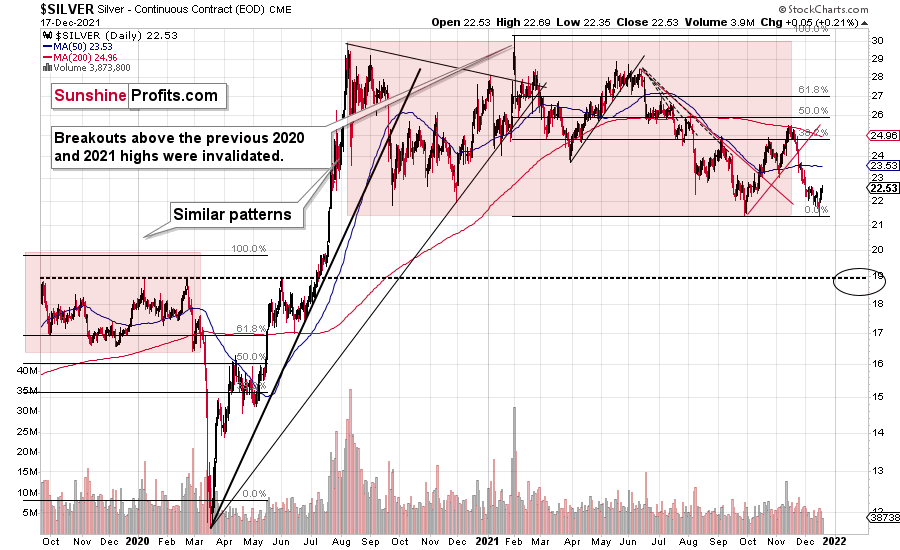
Silver outperformed gold on Friday, but only slightly and only on an immediate-term basis. Overall, just like mining stocks, silver was rather weak during this corrective upswing – relative to gold that is.
Does this remind you of something? It should, as it has March 2020 written all over it.
Silver corrected after a sizable short-term decline and after reaching its previous lows. Will it now decline substantially? That’s likely, but this time the decline might not be as volatile. After all, it’s not the case that the lockdowns are being introduced for the first time and nobody knows what’s going to happen and how. People are not panicking in the way they panicked in 2020.
Then again, the markets (the main stock indices) are more overvalued, and more capital was used to pump it, so the declines are likely to be huge anyway – also in the PMs. They simply might not be as sharp as they were in 2020. What happened a couple of days back then, might take a couple of weeks this time, but it’s likely to happen, nonetheless.
Having said that, let’s take a look at the markets from a more fundamental angle.
Hawk Talk: The Sequel
While the Fed fired a hawkish bazooka on Dec. 15, the ‘sell the news’ event contrasted the fundamental implications of the central bank’s rapidly shifting policy stance. And while the dollar basket sold off on Dec. 16, the USD Index recouped all of those losses and then some on Dec. 17.
But what caused the bullish reversal?
Well, from a fundamental perspective, Fed hawks were out in full force on Dec. 17. For context, I warned on Dec. 16 that Chairman Jerome Powell’s deputies often act as monetary policy messengers. I wrote:
As one of the most important quotes of the press conference, [Powell] admitted:
“My colleagues were out talking about a faster taper and that doesn’t happen by accident. They were out talking about a faster taper before the president made his decision. So it’s a decision that effectively was more than entrained.”
And while Powell sounded a little rattled during the exchange, his slip highlights the importance of Fed officials’ hawkish rhetoric. Essentially, when Clarida, Waller, Bostic, Bullard, etc., are making the hawkish rounds, “that doesn’t happen by accident.” As such, it’s an admission that his understudies serve as messengers for pre-determined policy decisions.
To that point, San Francisco Fed President Mary Daly – a major dove that urged patience in November – admitted on Dec. 17 that “I have adjusted my stance.”
“If we try to push the labor market now when clearly many Americans who are sidelined don’t want to come in ... if we push too hard and then we have to raise rates rapidly, then we end up with a really sharp pullback and historically a very sharp pullback on the part of the Fed, it results in a recession.”
As a result, what’s the most prudent course of action?
 Source: Reuters
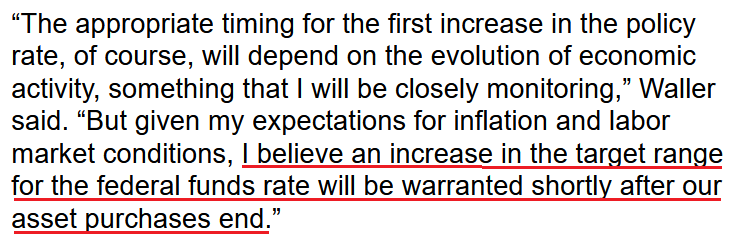
Second on the list, Fed Governor Christopher Waller said on Dec. 17 that “the whole point of accelerating the tapering was to end it much faster in March so the March meeting could be a live meeting. That was the intent.”
And what does he mean by a “live meeting?”
 Source: Bloomberg
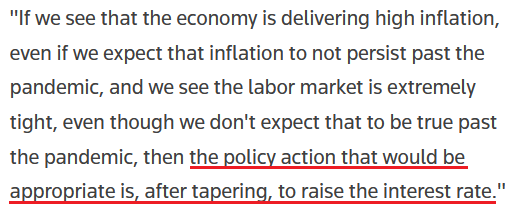
On top of that, Waller said that “it would take something like severe disruption from Omicron to delay labor market improvement or keep unemployment from falling, to keep March from being a key date to think of for liftoff.”
Likewise, after admitting that inflation “is alarmingly high, persistent, and has broadened to affect more categories of goods and services,” Waller implored the Fed to sell some of its bond holdings.
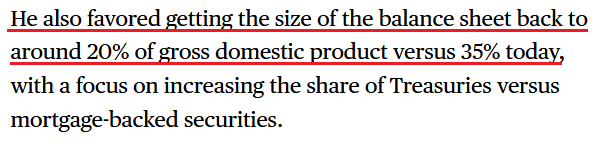
For context, tapering means that bonds are purchased at a slower pace or not at all. However, even zero purchases result in the Fed’s nearly $8.76 trillion in bond holdings remaining constant. Conversely, if the Fed reduces its balance sheet by selling bonds to private investors, it’s akin to a taper on steroids. Waller said:
“If we start doing some balance sheet runoff by summer, that’ll take some pressure off, you don’t have to raise rates quite as much. My view is we should start doing that by summer.”
 Source: Bloomberg
For context, selling bonds is more hawkish than raising interest rates. And if the Fed tries to reduce its balance sheet from 35% to 20% of GDP, the financial markets would freak out. And while that scenario is profoundly bullish for the USD Index and profoundly bearish for the PMs, Powell is unlikely to choose this path.
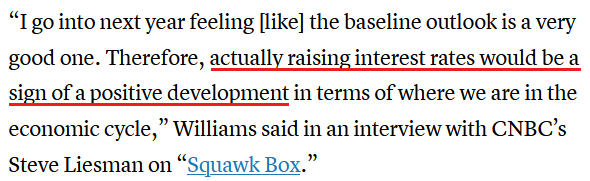
Making it a three-peat, New York Fed President John Williams – another major dove that’s suddenly had a change of heart – said on Dec. 17 that “we’re very focused on inflation; it is obviously too high right now. We want to make sure inflation comes back down to our 2% longer-run goal.”
Moreover, he added that “I’m pretty optimistic that we’re seeing really strong improvements in the labor market. You’re seeing the unemployment rate come down quickly.”
And while he tried to put a positive spin on the hawkish revelation, Williams aligned with Daly and Waller:
 Source: CNBC
Thus, Powell’s messengers are at it again. And with their rhetoric becoming more hawkish by the month, the fundamental outlook for the PMs continues to deteriorate. For context, I noted how the GDXJ ETF suffered mightily after the 2013 taper commenced. However, the taper is moving at warp speed this time around, and interest rate hikes are already on the table. As a result, this is like a fundamental meteor heading straight for the PMs.
To that point, the ECB made headlines on Dec. 16. Releasing its monetary policy statement, an excerpt read:
“In the first quarter of 2022, the Governing Council expects to conduct net asset purchases under the PEPP at a slower pace than in the previous quarter. It will discontinue net asset purchases under the PEPP at the end of March 2022.”
For context, everyone already knows that PEPP is scheduled to conclude at the end of March 2022. And while slowing its bond purchases in Q1 2022 is slightly hawkish, the ECB’s revolving door of stimulus continues to turn. To explain, the ECB’s monetary policy statement read on Oct. 28:
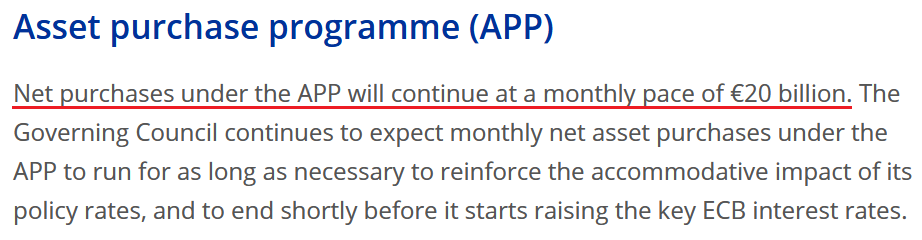 Source: ECB
Conversely, the ECB’s monetary policy statement read on Dec. 16:
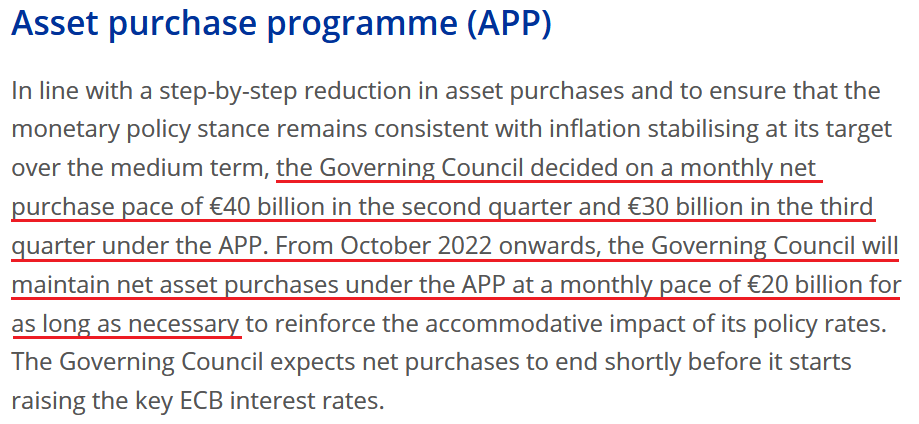 Source: ECB
As a result, while the ECB cut its PEPP purchases for Q1 2022, its net APP purchases will double in Q2 2022 and increase by 50% in Q3 2022. Moreover, the standard €20 billion per month in net APP purchases will resume in Q4 2022 and will continue for “as long as necessary.”
Thus, let’s run down the checklist:
- The Fed’s taper should conclude in March, while the ECB will be doubling the pace of its APP purchases.
- The Fed should hike interest rates in mid-2022 (and maybe even three times in 2022), while the ECB likely won’t hike at all.
- The Fed may reduce its balance sheet in late 2022, while the ECB is still buying bonds in Q4 2022.
All in all, there is no relative fundamental case for the EUR/USD to rally. And since the currency pair accounts for nearly 58% of the USD Index’s movement, the greenback’s outlook remains profoundly bullish.
What’s more, ECB President Christine Lagarde acknowledged on Dec. 16 that Eurozone inflation is mainly a function of sky-high energy prices. For context, I highlighted the dynamic on Dec. 1. I wrote:
Eurozone inflation increased by 4.9% year-over-year (YoY) on Nov. 30 (flash estimate).
However, it’s important to remember that the Eurozone core Harmonised Index of Consumer Prices (HICP) – which excludes the inflationary impacts of food and energy – increased by 2.6% YoY in November (the red box below). As a result, the only inflationary issues confronting the Eurozone are surging oil & gas prices.
Please see below:
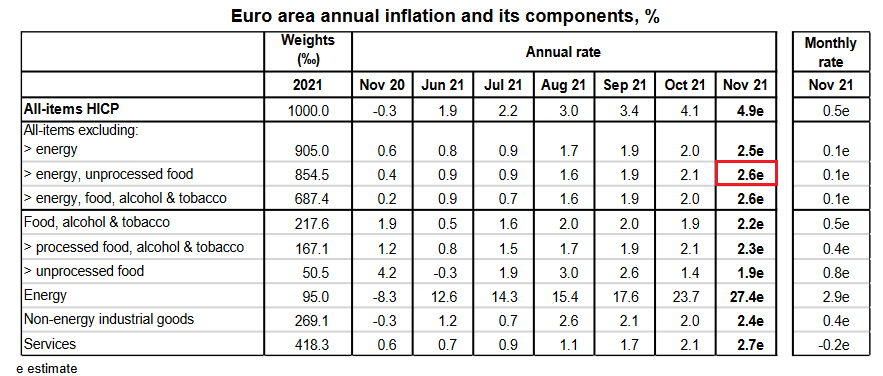 Source: Eurostat
And telling reporters just that on Dec. 16, Lagarde said that “the upswing in inflation primarily reflects a sharp rise in prices for fuel, gas, and electricity….
“Energy is more than two-thirds of this very significant difference between our September projections and our December projections. The other part of it is essentially related to the longer duration of the supply bottlenecks.”
In addition, Lagarde highlighted that wage inflation remains well anchored in the Eurozone. For context:
- Eurozone hourly labor costs rose by 2.5% year-over-year (YoY) on Dec. 16. However, the non-wage component increased by 3% YoY, while the wages & salaries per hours worked component only increased by 2.3% YoY.
- Conversely, U.S. average hourly earnings increased by 4.8% YoY on Dec. 3.
As a result, wage inflation in the U.S. is tracking well ahead of the Eurozone, and Lagarde accurately said that the current readings are far from troublesome.
“On the wage account and how much of a second-round effect it would have, as I said, we are extremely attentive to what happens on a weekly basis,” she said. “But what we are seeing now certainly is significantly below the levels that have been factored into the projections that we have.”
As a result, a 2022 rate hike is likely off the table:
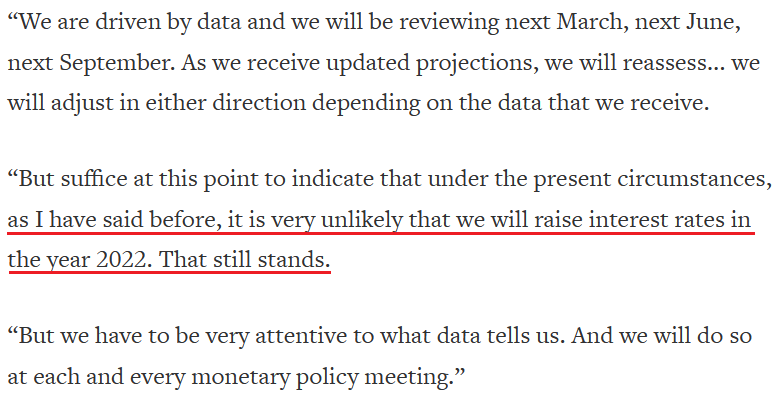 Source: Reuters
The bottom line? While I’ve been warning for months that the Fed and the ECB are worlds apart, the monetary policy divergence has widened materially over the last 30 days. And with no relative fundamental metrics supporting a stronger euro – like relative GDP growth, interest rates, money printing, etc. – the EUR/USD’s downtrend likely has more room to run.
In addition, while the Bank of England (BoE) raised interest rates on Dec. 17, the GBP/USD only accounts for 11.9% of the USD Index’s movement. As a result, the Fed still remains ahead of other central banks whose currency pairs are included in the dollar basket, and ~98 remains the most likely outcome over the medium term.
Moreover, with the PMs likely to lament the U.S. dollar’s forthcoming strength and the potential increase in real interest rates, more downside should confront gold, silver and mining stocks over the next few months.
In conclusion, the PMs were mixed on Dec. 17, though, the GDXJ ETF was a noticeable underperformer. However, with the Fed increasingly hawked up, the entire precious metals complex should come under pressure in the coming months. As a result, the bearish thesis remains intact, and the ECB’s dovish disposition further supports a continuation of ‘USD Index up, PMs down’ in 2022.
Overview of the Upcoming Part of the Decline
- It seems to me that while we the corrective upswing might still continue, it might not be significant in case of junior mining stocks. After the corrective upswing is over, I think that gold will decline once again taking silver and mining stocks lower as well.
- It seems that the first stop for gold will be close to its previous 2021 lows, slightly below $1,700. Then it will likely correct a bit, but it’s unclear if I want to exit or reverse the current short position based on that – it depends on the number and the nature of the bullish indications that we get at that time.
- After the above-mentioned correction, we’re likely to see a powerful slide, perhaps close to the 2020 low ($1,450 - $1,500).
- If we see a situation where miners slide in a meaningful and volatile way while silver doesn’t (it just declines moderately), I plan to – once again – switch from short positions in miners to short positions in silver. At this time, it’s too early to say at what price levels this could take place, and if we get this kind of opportunity at all – perhaps with gold close to $1,600.
- I plan to exit all remaining short positions once gold shows substantial strength relative to the USD Index while the latter is still rallying. This may be the case with gold close to $1,350 - $1,400. I expect silver to fall the hardest in the final part of the move. This moment (when gold performs very strongly against the rallying USD and miners are strong relative to gold after its substantial decline) is likely to be the best entry point for long-term investments, in my view. This can also happen with gold close to $1,375, but at the moment it’s too early to say with certainty. I expect the final bottom to take place near the end of the year, perhaps in mid-December. It is not set in stone that PMs have to bottom at that time. If not then, then early 2022 would become a likely time target.
- As a confirmation for the above, I will use the (upcoming or perhaps we have already seen it?) top in the general stock market as the starting point for the three-month countdown. The reason is that after the 1929 top, gold miners declined for about three months after the general stock market started to slide. We also saw some confirmations of this theory based on the analogy to 2008. All in all, the precious metals sector is likely to bottom about three months after the general stock market tops. The additional confirmation will come from the tapering schedule, as markets are likely to move on the rumor and reverse on the fact as they tend to do in general.
- The above is based on the information available today, and it might change in the following days/weeks.
You will find my general overview of the outlook for gold on the chart below:
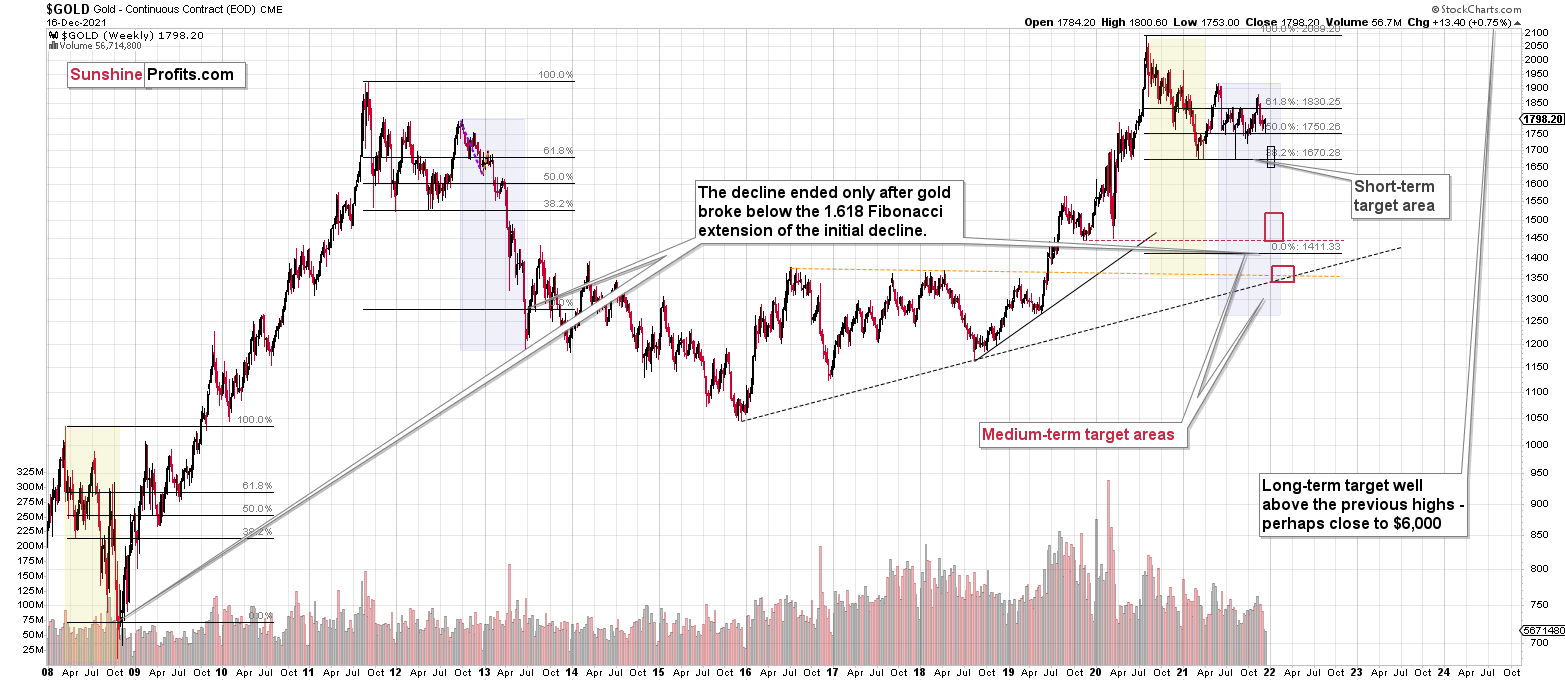
Please note that the above timing details are relatively broad and “for general overview only” – so that you know more or less what I think and how volatile I think the moves are likely to be – on an approximate basis. These time targets are not binding or clear enough for me to think that they should be used for purchasing options, warrants or similar instruments.
Summary
Summing up, it seems to me that while we the corrective upswing might still continue, it might not be significant in case of junior mining stocks. After the corrective upswing is over, I think that gold will decline once again taking silver and mining stocks lower as well.
If the new Covid-19 variant makes the vaccine rather useless, we might be in for very wild price moves in most markets. In the case of the precious metals sector, the initial move should be to the downside, but at the same time, it makes the long-term outlook even more bullish.
From the medium-term point of view, the key two long-term factors remain the analogy to 2013 in gold and the broad head and shoulders pattern in the HUI Index. They both suggest much lower prices ahead.
It seems that our profits from the short positions are going to become truly epic in the following months.
After the sell-off (that takes gold to about $1,350 - $1,500), I expect the precious metals to rally significantly. The final part of the decline might take as little as 1-5 weeks, so it's important to stay alert to any changes.
Most importantly, please stay healthy and safe. We made a lot of money last March and this March, and it seems that we’re about to make much more on the upcoming decline, but you have to be healthy to enjoy the results.
As always, we'll keep you - our subscribers - informed.
By the way, we’re currently providing you with the possibility to extend your subscription by a year, two years or even three years with a special 20% discount. This discount can be applied right away, without the need to wait for your next renewal – if you choose to secure your premium access and complete the payment upfront. The boring time in the PMs is definitely over, and the time to pay close attention to the market is here. Naturally, it’s your capital, and the choice is up to you, but it seems that it might be a good idea to secure more premium access now while saving 20% at the same time. Our support team will be happy to assist you in the above-described upgrade at preferential terms – if you’d like to proceed, please contact us.
To summarize:
Trading capital (supplementary part of the portfolio; our opinion): Full speculative short positions (300% of the full position) in junior mining stocks are justified from the risk to reward point of view with the following binding exit profit-take price levels:
Mining stocks (price levels for the GDXJ ETF): binding profit-take exit price: $35.73; stop-loss: none (the volatility is too big to justify a stop-loss order in case of this particular trade)
Alternatively, if one seeks leverage, we’re providing the binding profit-take levels for the JDST (2x leveraged) and GDXD (3x leveraged – which is not suggested for most traders/investors due to the significant leverage). The binding profit-take level for the JDST: $16.18; stop-loss for the JDST: none (the volatility is too big to justify a SL order in case of this particular trade); binding profit-take level for the GDXD: $32.08; stop-loss for the GDXD: none (the volatility is too big to justify a SL order in case of this particular trade).
For-your-information targets (our opinion; we continue to think that mining stocks are the preferred way of taking advantage of the upcoming price move, but if for whatever reason one wants / has to use silver or gold for this trade, we are providing the details anyway.):
Silver futures downside profit-take exit price: $19.12
SLV profit-take exit price: $17.72
ZSL profit-take exit price: $41.38
Gold futures downside profit-take exit price: $1,683
HGD.TO – alternative (Canadian) inverse 2x leveraged gold stocks ETF – the upside profit-take exit price: $12.48
HZD.TO – alternative (Canadian) inverse 2x leveraged silver ETF – the upside profit-take exit price: $30.48
Long-term capital (core part of the portfolio; our opinion): No positions (in other words: cash
Insurance capital (core part of the portfolio; our opinion): Full position
Whether you already subscribed or not, we encourage you to find out how to make the most of our alerts and read our replies to the most common alert-and-gold-trading-related-questions.
Please note that we describe the situation for the day that the alert is posted in the trading section. In other words, if we are writing about a speculative position, it means that it is up-to-date on the day it was posted. We are also featuring the initial target prices to decide whether keeping a position on a given day is in tune with your approach (some moves are too small for medium-term traders, and some might appear too big for day-traders).
Additionally, you might want to read why our stop-loss orders are usually relatively far from the current price.
Please note that a full position doesn't mean using all of the capital for a given trade. You will find details on our thoughts on gold portfolio structuring in the Key Insights section on our website.
As a reminder - "initial target price" means exactly that - an "initial" one. It's not a price level at which we suggest closing positions. If this becomes the case (like it did in the previous trade), we will refer to these levels as levels of exit orders (exactly as we've done previously). Stop-loss levels, however, are naturally not "initial", but something that, in our opinion, might be entered as an order.
Since it is impossible to synchronize target prices and stop-loss levels for all the ETFs and ETNs with the main markets that we provide these levels for (gold, silver and mining stocks - the GDX ETF), the stop-loss levels and target prices for other ETNs and ETF (among other: UGL, GLL, AGQ, ZSL, NUGT, DUST, JNUG, JDST) are provided as supplementary, and not as "final". This means that if a stop-loss or a target level is reached for any of the "additional instruments" (GLL for instance), but not for the "main instrument" (gold in this case), we will view positions in both gold and GLL as still open and the stop-loss for GLL would have to be moved lower. On the other hand, if gold moves to a stop-loss level but GLL doesn't, then we will view both positions (in gold and GLL) as closed. In other words, since it's not possible to be 100% certain that each related instrument moves to a given level when the underlying instrument does, we can't provide levels that would be binding. The levels that we do provide are our best estimate of the levels that will correspond to the levels in the underlying assets, but it will be the underlying assets that one will need to focus on regarding the signs pointing to closing a given position or keeping it open. We might adjust the levels in the "additional instruments" without adjusting the levels in the "main instruments", which will simply mean that we have improved our estimation of these levels, not that we changed our outlook on the markets. We are already working on a tool that would update these levels daily for the most popular ETFs, ETNs and individual mining stocks.
Our preferred ways to invest in and to trade gold along with the reasoning can be found in the how to buy gold section. Furthermore, our preferred ETFs and ETNs can be found in our Gold & Silver ETF Ranking.
As a reminder, Gold & Silver Trading Alerts are posted before or on each trading day (we usually post them before the opening bell, but we don't promise doing that each day). If there's anything urgent, we will send you an additional small alert before posting the main one.
Thank you.
Przemyslaw Radomski, CFA
Founder, Editor-in-chief

