

Briefly: in our opinion, full (300% of the regular position size) speculative short positions in junior mining stocks are justified from the risk/reward point of view at the moment of publishing this Alert.
Now that was a big decline in the USD Index! What made gold yawn and why is it declining today? Because it doesn’t want to rally.
I’ve been writing this over and over again, and yet I’ll write it once more. Markets don’t move in a straight line up or down, and periodic corrections are natural. However, the way markets interact during those corrections tells us a lot about what’s likely to take place next, at least in the case of some markets.
The USD Index declined quite visibly yesterday and in today’s overnight trading.
The key questions are: so what, and if that was completely unexpected.
Starting with the latter, it wasn’t unexpected. It’s something in tune with gold’s long-term chart.
When the weekly RSI (based on the weekly price changes) for the USD Index hit 70, I wrote the following:
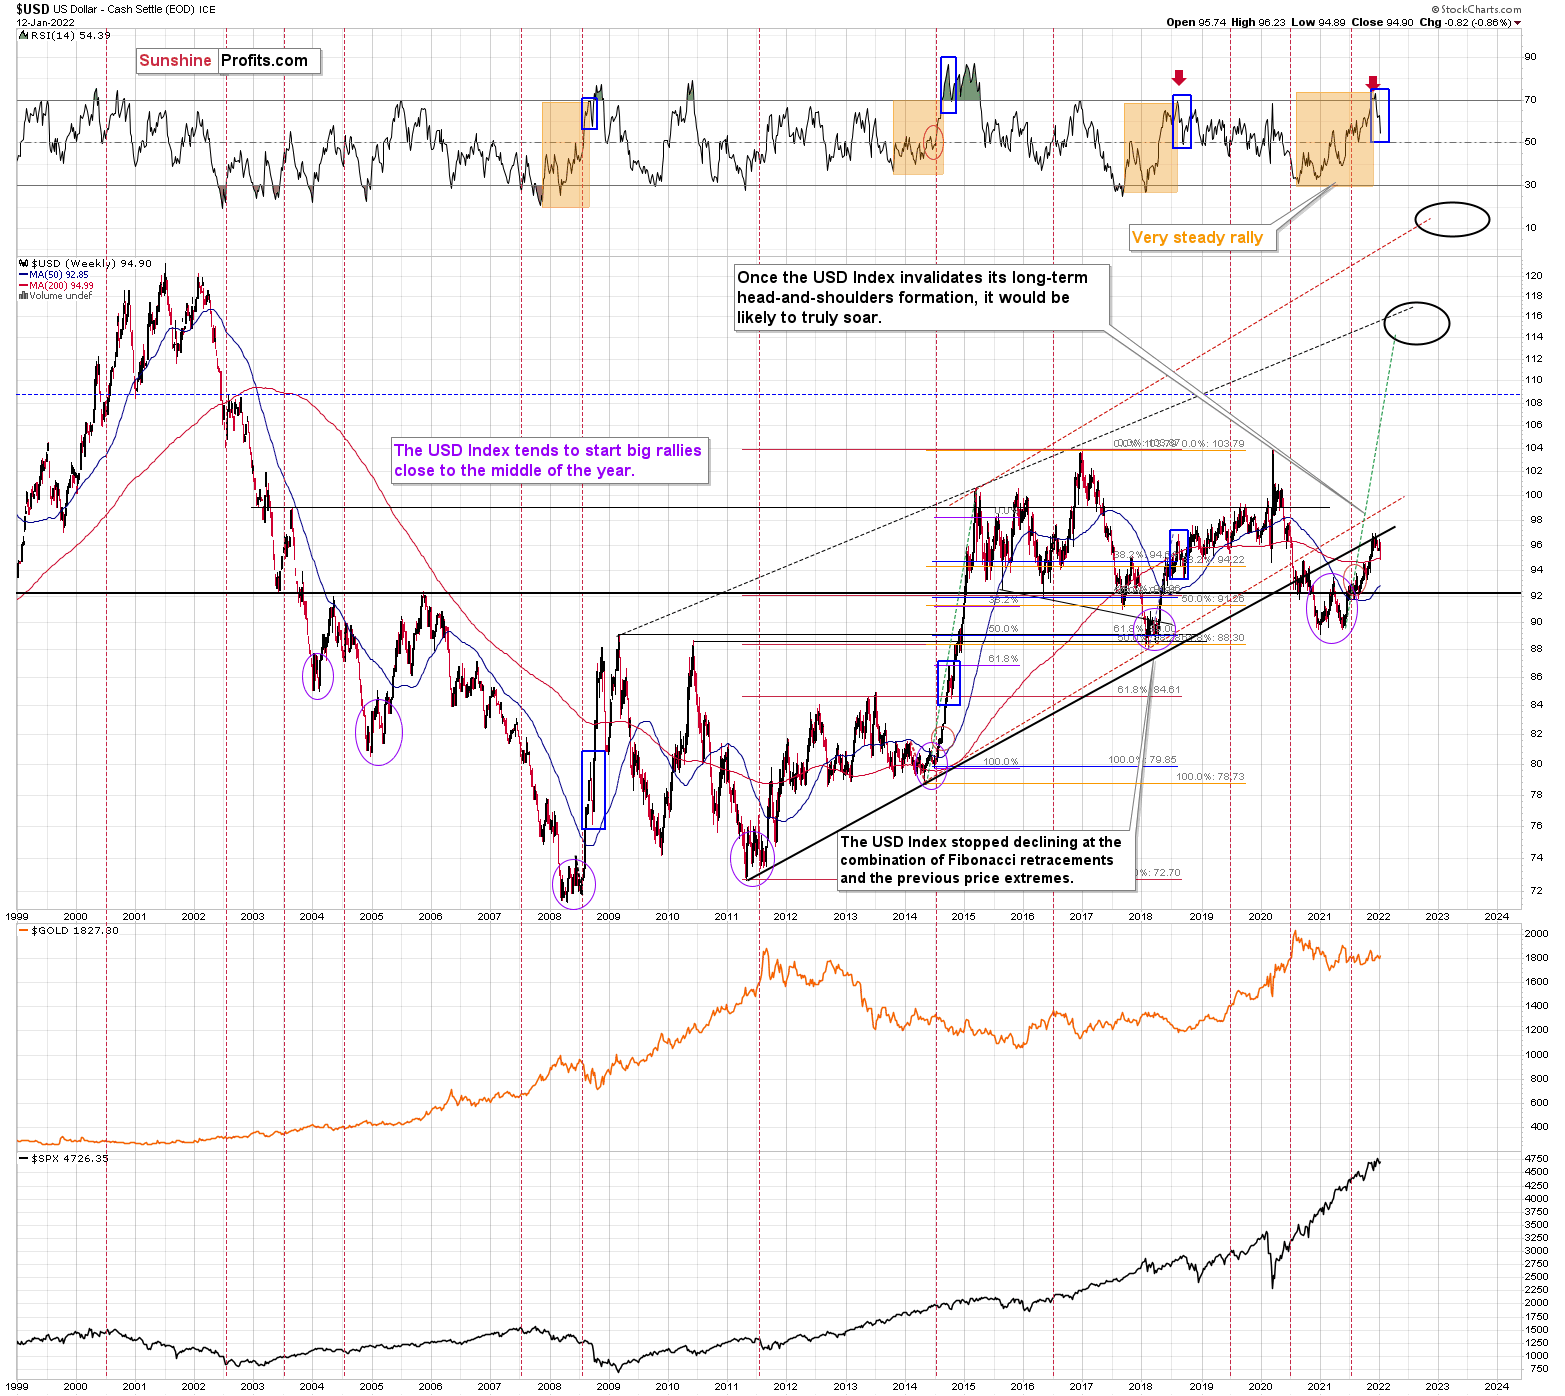
Also, please note that the recent medium-term rally has been calmer than any major upswing witnessed over the last 20 years, where the USD Index’s RSI has hit 70. I marked the recent rally in the RSI with an orange rectangle, and I did the same with the second-least and third-least volatile of the medium-term upswings.
The sharp rallies in 2008 and 2014 were of much larger magnitudes. And in those historical analogies, the USD Index continued its surge for some time without suffering any material corrections.
As a result, the short-term outlook is more of a coin flip.
Consequently, the current decline is not unexpected, it’s rather normal.
I marked additional situations on the above chart with orange rectangles – these were the recent cases when the RSI based on the USD Index moved from very low levels to or above 70. In all three previous cases, there was some corrective downswing after the initial part of the decline, but once it was over – and the RSI declined somewhat – the big rally returned and the USD Index moved to new highs.
I marked those declines in the RSI with blue rectangles, and I did the same thing for the current decline. As you can see, the size of the move lower is currently analogous to previous short-term corrections that were then followed by higher prices. This means that it’s quite likely over or very close to being over, and the medium-term rally can return any day now.
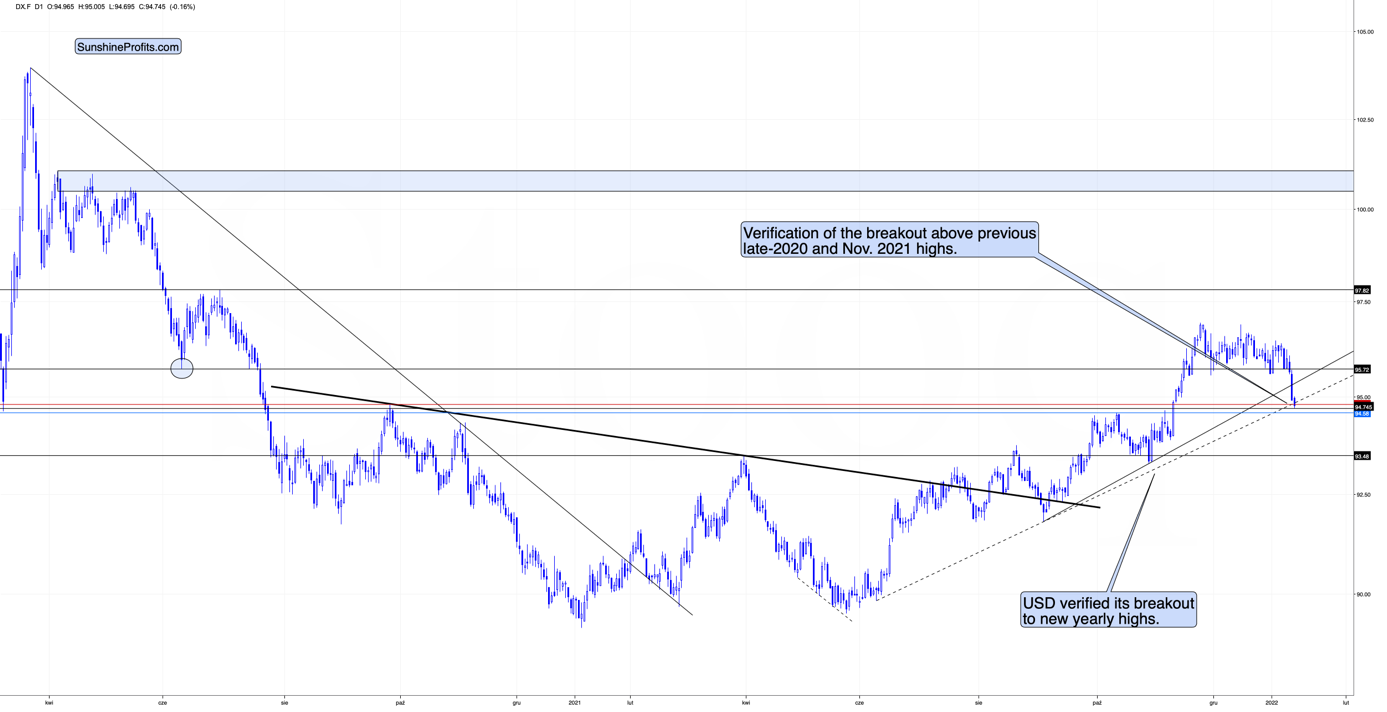
Moving back to USD’s short-term chart, we see that the USD Index just (in overnight trading, so the move is not even close to being confirmed) moved a little below USDX’s rising support line based on the previous June and October 2021 lows. At the same time, the USDX is slightly below its late-2020 top and slightly above its November 2021 top.
In light of the situation on the long-term USDX chart (as discussed above), this combination of support levels is likely to trigger a rebound and the continuation of the medium-term rally.
At the beginning of 2021, I wrote that the year was likely to be bullish for the USD Index, and my forecast for gold (and the rest of the precious metals sector) was bullish – against that of almost every one of my colleagues.
The USD Index ended 2021 about 6% higher, gold was down about 3.5%, silver was down almost 12%, the GDX ETF was down by about 9.5%, and the GDXJ ETF (proxy for junior mining stocks, my primary tool for shorting the precious metals sector in 2021 – I wasn’t shorting gold at any point in 2021) was down by about 21%.
What about this year? It’s a tough call to say how the entire year will go, but it seems to me that the USD Index will move higher, and we’ll see both in the PMs: a massive decline, and then a huge rally. It’s very likely to be a year to remember for anyone interested in trading gold, silver, and/or mining stocks and/or investing in them.
Let’s get back to the current situation.
The USD Index declined to fresh 2022 lows – well below the previous January lows, and also below the December and late-November lows. How did gold respond?
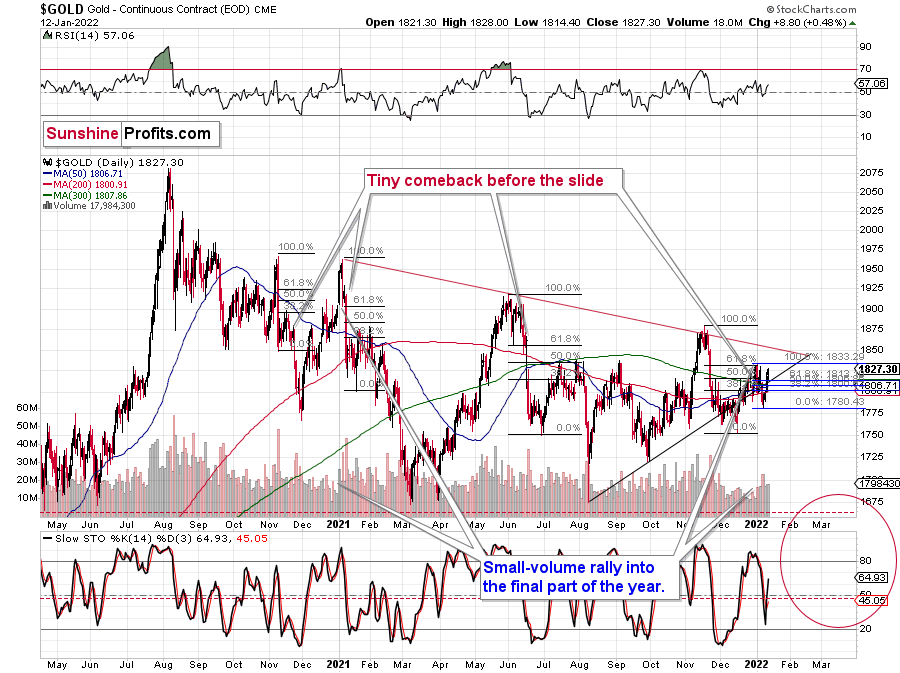
Gold rallied – but just by a mere $8.80. While gold got close to its early-January high, it didn’t manage to move above it. 2022 is still a down year for gold. Also, gold is clearly below its November 2021 highs, when it was trading close to $1,900.
Is gold showing strength here?
Absolutely not.
Gold is showing the opposite of strength. It’s weak and unwilling to react to the USD’s weakness. That’s exactly what I want to see as a bearish indication if I plan on entering a short position in the precious metals sector or when I’m timing an exit of a long position, or as a confirmation of a bearish narrative in general.
So, yes, of course I want to say that yesterday’s rally in gold was a bearish development. That’s the case, because gold should have rallied so much more, given what happened in the USD Index. Today’s overnight action makes the bearish case even clearer. The USDX is down a bit, but gold is down too, anyway. It simply doesn’t want to rally. Gold wants to decline instead.
Mining stocks and silver behaved similarly to gold yesterday – they didn’t move to, let alone above, their previous 2022 highs. Consequently, they confirm the indications for the gold vs. USD dynamic – they don’t point to something else.
Summing up, the outlook for silver, gold, and mining remains bearish for the medium term, and this week’s rally seems to be nothing more than a counter-trend breather.
Having said that, let’s take a look at the markets from a more fundamental point of view.
The Training Wheels Are Coming Off
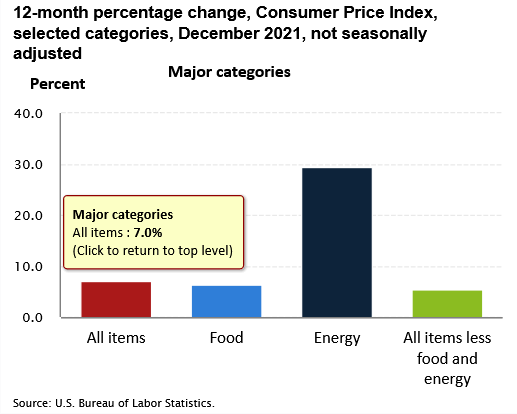
After the headline Consumer Price Index (CPI) surged by 7% year-over-year (YoY) on Jan. 12, the inflationary peak still awaits us. While investors are in denial over how the eventual deceleration will come to fruition, the Fed’s hawkish battle with inflation will likely surprise market participants in the coming months.
Please see below:
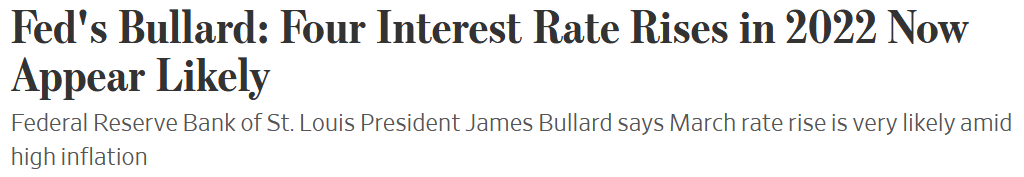
To explain, after Powell, Bostic, Mester, and George sounded the hawkish alarm on Jan. 11, St. Louis Fed President James Bullard upped the ante. Speaking to the Wall Street Journal (WSJ) on Jan. 12, Bullard said that a liftoff in March is likely, and added: “I actually now think we should maybe go to four hikes in 2022.”
“We want to bring inflation under control in a way that does not disrupt the real economy,” he said. “But we are also firm in our desire to get inflation to return to 2% over the medium term.”
Please see below:
 Source: WSJ
Even more revealing, Fed Governor Lael Brainard (soon to be Vice Chair) said in her prepared remarks for a Senate hearing on Jan. 13 that fighting inflation is now the Fed’s "most important task".
Please see below:
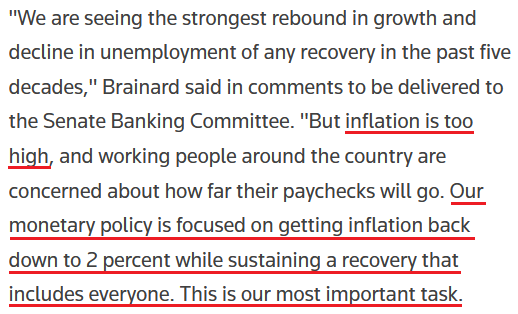 Source: Reuters
In addition, the Fed released its latest Beige Book on Jan. 12. While the report revealed that pricing pressures “decelerated a bit,” inflation is still far from settled. An excerpt from the report reads:
“Contacts from most Federal Reserve Districts reported solid growth in prices charged to customers, but some also noted that price increases had decelerated a bit from the robust pace experienced in recent months. Wholesale and materials prices contributed to pricing pressures across a wide range of industries, spanning service providers and goods producers.”
What’s more, with wage inflation grabbing the baton from goods inflation, the wage-price spiral requires the Fed to act. In its absence, CPI prints should continue to rise in 2022.
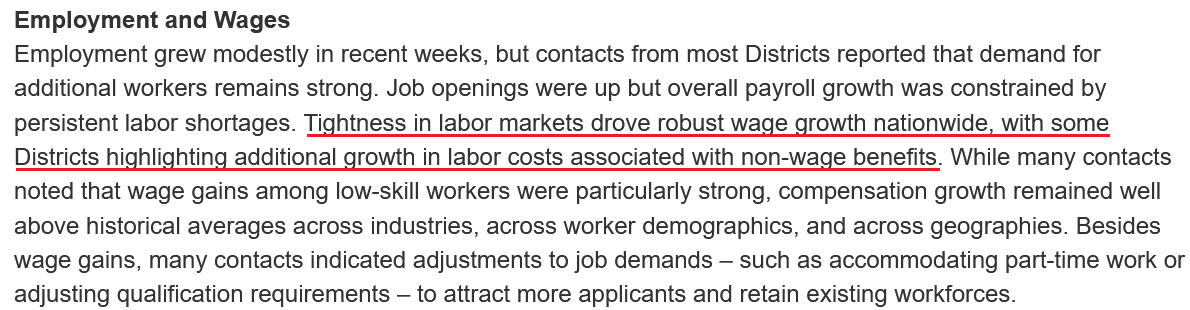 Source: U.S. Fed
Another important factor is that inflation has become political and could derail Joe Biden’s presidency. As a result, Democrats realize that continuing down this road is akin to signing their own death warrants.
To explain, I wrote on Nov. 18:
The political component shouldn’t be ignored. U.S. President Joe Biden’s approval ratings keep hitting new lows along with consumer confidence. Thus, is it in his best interest to maintain the status quo? Of course not. That’s why he’s been so forceful on inflation over the last few weeks. Essentially, if he (and/or the Fed) does nothing, he’ll likely lose the next presidential election and the Democrats will likely lose control of Congress. However, if he tames inflation, then he’s a hero. And left with those two options, which one do you think he’ll choose?
To that point, after Quinnipiac University released its latest national poll on Jan. 12, the institution found that the percentage of Americans who approve of Biden’s presidency hit a record low of 33%. For context, the last seven Quinnipiac national polls have seen the metric come in at 49%, 46%, 42%, 38%, 37%, 36%, and now, 33%.
Please see below:
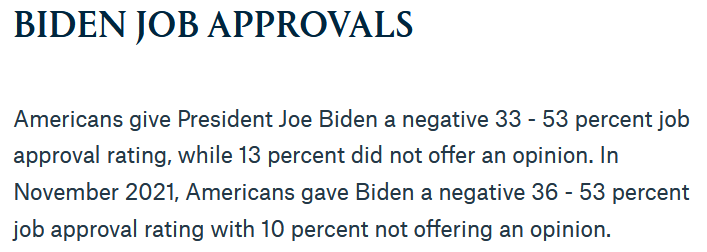 Source: Quinnipiac University
Moreover, when looking at things from Biden's point of view, do you think he's happy with the current state of play? With his approval ratings stuck in a vicious downward spiral, what does he have to lose by switching gears and making inflation public enemy no. 1? Thus, investors' belief that the Fed won't tighten monetary policy lacks credibility. History shows that the PMs perform extremely poorly when tightening cycles commence.
Continuing the theme, with investors still underestimating the seismic shift that's unfolding right in front of them, Bob Michele, CIO and Head of the Global Fixed Income, Currency & Commodities (GFICC) group at J.P. Morgan Asset Management, told clients on Jan. 11 that the Fed won't pivot this time around.
"We disagree and think the Fed would let the markets drop much further if their primary concern was battling inflation," he wrote. "The strike of any put is likely to be declines of 15%-30% in equities, not 2%-3%."
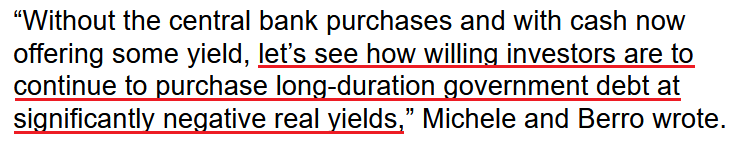
Moreover, with Michele expecting the U.S. 10-Year Treasury yield to trade in a range of 1.875% to 2.375% (and possibly as high as 3%) over the medium term, he added that "as yields rise, asset valuations, not just within fixed income but more broadly, are negatively impacted by higher discounting rates."
Thus, while the Fed has been handing investors kid gloves for more than a decade, the training wheels should come off in 2022. With the central bank's balance sheet poised to flip from purchases to sales, bond bulls may find it difficult to continue purchasing once the elephant leaves the room.
 Source: Bloomberg
To that point, if the U.S. 10-Year Treasury yield declines in 2022, it will defy nearly 40 years of historical precedent.
Please see below:
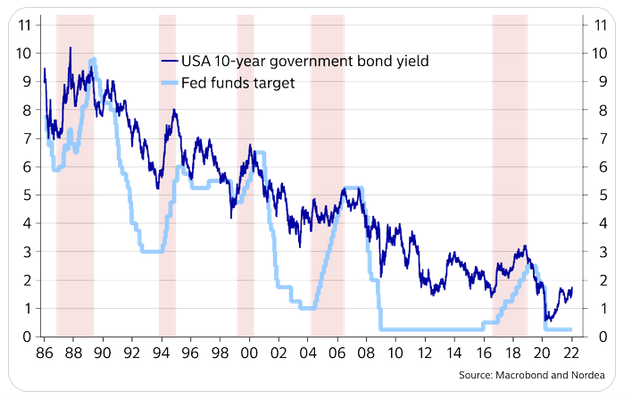
To explain, the dark blue line above tracks the U.S. 10-Year Treasury yield, while the light blue line above tracks the U.S. Federal Funds Rate. If you analyze the latter's ascents starting in 1987, 1993, 1999, 2004, and 2017, you will see that the U.S. 10-Year Treasury yield always rallies when the Fed increases the U.S. Federal Funds Rate.
Moreover, the U.S. 10-Year Treasury yield doesn't usually peak until after the Fed finishes its rate hike cycle. For example, if you focus your attention on the light blue line's highs, notice how the U.S. 10-Year Treasury yield keeps rising until the Fed stops hiking. With a rate hike in March likely a done deal and Fed officials projecting anywhere from two to four rate hikes in 2022, is this time really different?
Finally, Charlie McElligott, Managing Director of Cross-Asset Macro Strategy at Nomura, told clients on Jan. 11 that Fed officials have "made their bed". Since they've gone too far down the hawkish road, a dovish pivot is likely wishful thinking. The house call at Nomura states:
“We continue to expect four rate hikes this year (Mar, Jun, Sep, Dec) and a balance sheet runoff announcement in July, effective August. We think monthly caps on Treasury and MBS runoff will start at $12bn and $8bn before scaling up to $60bn and $40bn, respectively, by December. We think the Fed will slow to a pace of two hikes per year in 2023 and 2024 before hitting a terminal rate of 2.00-2.25%.”
The bottom line? With investors still misreading the tea leaves, they’ve been conditioned to play chicken with the Fed. However, with inflation now a political issue, the dynamic is being reversed. Before, the party in power would encourage dovish policy to boast about the economy and gain re-election. However, now, inflation is hurting the party in power, and dovish policy is causing incumbents to lose support. As a result, don’t be surprised if the Fed breaks investors’ hearts over the medium term.
In conclusion, the PMs rallied on Jan. 12 and the USD Index was a major casualty. However, investors are misreading the fundamentals. The Fed’s hawkish stance is bullish for the U.S. dollar, and rising U.S. Treasury yields further support the argument. Moreover, with reformed doves now spreading their hawkish wings, Fed officials aren’t playing around anymore. As such, the PMs will likely learn this lesson the hard way over the medium term.
Overview of the Upcoming Part of the Decline
- It seems to me that the corrective upswing is over, and that gold, silver, and mining stocks are now likely to continue their medium-term decline.
- It seems that the first (bigger) stop for gold will be close to its previous 2021 lows, slightly below $1,700. Then it will likely correct a bit, but it’s unclear if I want to exit or reverse the current short position based on that – it depends on the number and the nature of the bullish indications that we get at that time.
- After the above-mentioned correction, we’re likely to see a powerful slide, perhaps close to the 2020 low ($1,450 - $1,500).
- If we see a situation where miners slide in a meaningful and volatile way while silver doesn’t (it just declines moderately), I plan to – once again – switch from short positions in miners to short positions in silver. At this time, it’s too early to say at what price levels this could take place, and if we get this kind of opportunity at all – perhaps with gold close to $1,600.
- I plan to exit all remaining short positions once gold shows substantial strength relative to the USD Index while the latter is still rallying. This may be the case with gold close to $1,350 - $1,400. I expect silver to fall the hardest in the final part of the move. This moment (when gold performs very strongly against the rallying USD and miners are strong relative to gold after its substantial decline) is likely to be the best entry point for long-term investments, in my view. This can also happen with gold close to $1,375, but at the moment it’s too early to say with certainty.
- As a confirmation for the above, I will use the (upcoming or perhaps we have already seen it?) top in the general stock market as the starting point for the three-month countdown. The reason is that after the 1929 top, gold miners declined for about three months after the general stock market started to slide. We also saw some confirmations of this theory based on the analogy to 2008. All in all, the precious metals sector is likely to bottom about three months after the general stock market tops.
- The above is based on the information available today, and it might change in the following days/weeks.
You will find my general overview of the outlook for gold on the chart below:
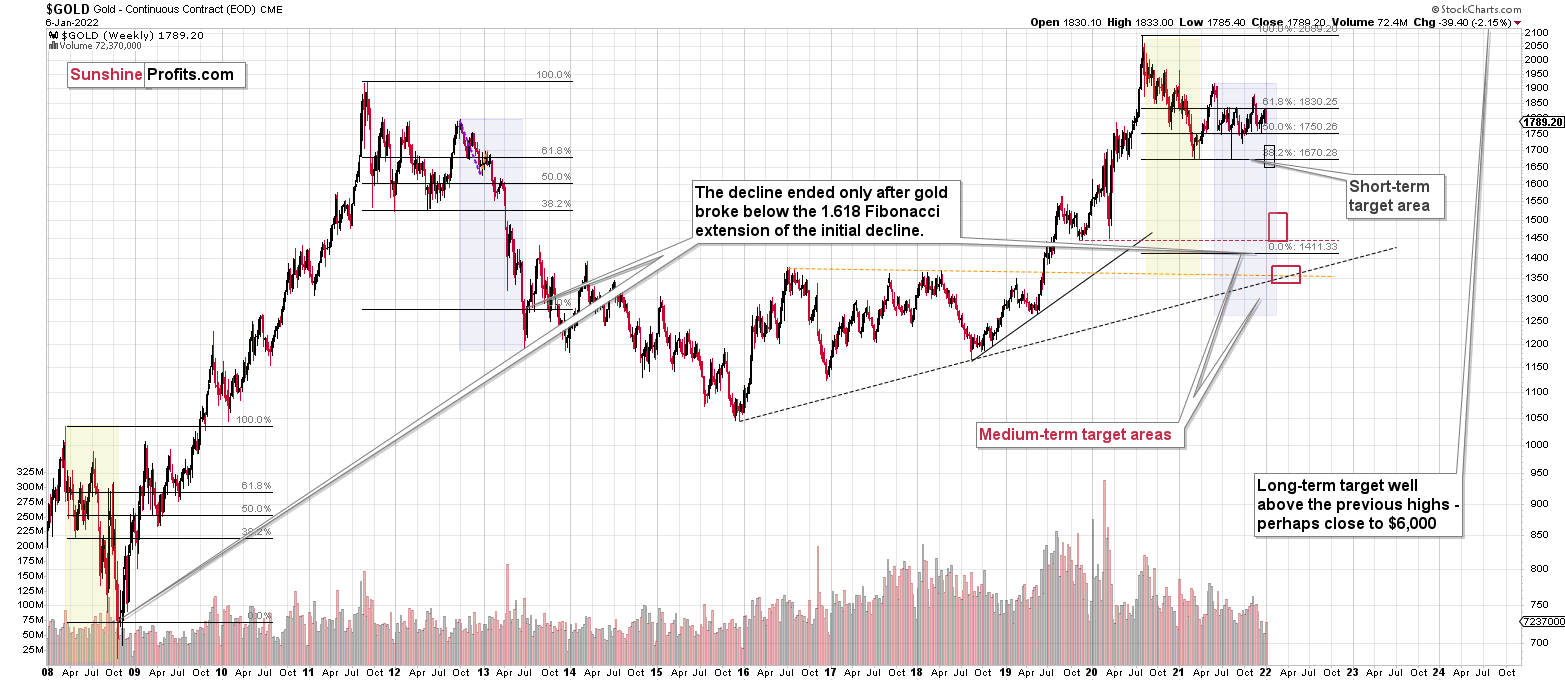
Please note that the above timing details are relatively broad and “for general overview only” – so that you know more or less what I think and how volatile I think the moves are likely to be – on an approximate basis. These time targets are not binding or clear enough for me to think that they should be used for purchasing options, warrants or similar instruments.
Summary
Summing up, it seems to me that the corrective upswing is over, and that gold, silver, and mining stocks are now likely to continue their medium-term decline. I continue to think that junior mining stocks are currently likely to decline the most out of all parts of the precious metals sector.
From the medium-term point of view, the key two long-term factors remain the analogy to 2013 in gold and the broad head and shoulders pattern in the HUI Index. They both suggest much lower prices ahead.
It seems that our profits from the short positions are going to become truly epic in the following months.
After the sell-off (that takes gold to about $1,350 - $1,500), I expect the precious metals to rally significantly. The final part of the decline might take as little as 1-5 weeks, so it's important to stay alert to any changes.
Most importantly, please stay healthy and safe. We made a lot of money last March and this March, and it seems that we’re about to make much more on the upcoming decline, but you have to be healthy to enjoy the results.
As always, we'll keep you - our subscribers - informed.
To summarize:
Trading capital (supplementary part of the portfolio; our opinion): Full speculative short positions (300% of the full position) in junior mining stocks are justified from the risk to reward point of view with the following binding exit profit-take price levels:
Mining stocks (price levels for the GDXJ ETF): binding profit-take exit price: $35.73; stop-loss: none (the volatility is too big to justify a stop-loss order in case of this particular trade)
Alternatively, if one seeks leverage, we’re providing the binding profit-take levels for the JDST (2x leveraged) and GDXD (3x leveraged – which is not suggested for most traders/investors due to the significant leverage). The binding profit-take level for the JDST: $16.18; stop-loss for the JDST: none (the volatility is too big to justify a SL order in case of this particular trade); binding profit-take level for the GDXD: $32.08; stop-loss for the GDXD: none (the volatility is too big to justify a SL order in case of this particular trade).
For-your-information targets (our opinion; we continue to think that mining stocks are the preferred way of taking advantage of the upcoming price move, but if for whatever reason one wants / has to use silver or gold for this trade, we are providing the details anyway.):
Silver futures downside profit-take exit price: $19.12
SLV profit-take exit price: $17.72
ZSL profit-take exit price: $41.38
Gold futures downside profit-take exit price: $1,683
HGD.TO – alternative (Canadian) inverse 2x leveraged gold stocks ETF – the upside profit-take exit price: $12.48
HZD.TO – alternative (Canadian) inverse 2x leveraged silver ETF – the upside profit-take exit price: $30.48
Long-term capital (core part of the portfolio; our opinion): No positions (in other words: cash
Insurance capital (core part of the portfolio; our opinion): Full position
Whether you already subscribed or not, we encourage you to find out how to make the most of our alerts and read our replies to the most common alert-and-gold-trading-related-questions.
Please note that we describe the situation for the day that the alert is posted in the trading section. In other words, if we are writing about a speculative position, it means that it is up-to-date on the day it was posted. We are also featuring the initial target prices to decide whether keeping a position on a given day is in tune with your approach (some moves are too small for medium-term traders, and some might appear too big for day-traders).
Additionally, you might want to read why our stop-loss orders are usually relatively far from the current price.
Please note that a full position doesn't mean using all of the capital for a given trade. You will find details on our thoughts on gold portfolio structuring in the Key Insights section on our website.
As a reminder - "initial target price" means exactly that - an "initial" one. It's not a price level at which we suggest closing positions. If this becomes the case (like it did in the previous trade), we will refer to these levels as levels of exit orders (exactly as we've done previously). Stop-loss levels, however, are naturally not "initial", but something that, in our opinion, might be entered as an order.
Since it is impossible to synchronize target prices and stop-loss levels for all the ETFs and ETNs with the main markets that we provide these levels for (gold, silver and mining stocks - the GDX ETF), the stop-loss levels and target prices for other ETNs and ETF (among other: UGL, GLL, AGQ, ZSL, NUGT, DUST, JNUG, JDST) are provided as supplementary, and not as "final". This means that if a stop-loss or a target level is reached for any of the "additional instruments" (GLL for instance), but not for the "main instrument" (gold in this case), we will view positions in both gold and GLL as still open and the stop-loss for GLL would have to be moved lower. On the other hand, if gold moves to a stop-loss level but GLL doesn't, then we will view both positions (in gold and GLL) as closed. In other words, since it's not possible to be 100% certain that each related instrument moves to a given level when the underlying instrument does, we can't provide levels that would be binding. The levels that we do provide are our best estimate of the levels that will correspond to the levels in the underlying assets, but it will be the underlying assets that one will need to focus on regarding the signs pointing to closing a given position or keeping it open. We might adjust the levels in the "additional instruments" without adjusting the levels in the "main instruments", which will simply mean that we have improved our estimation of these levels, not that we changed our outlook on the markets. We are already working on a tool that would update these levels daily for the most popular ETFs, ETNs and individual mining stocks.
Our preferred ways to invest in and to trade gold along with the reasoning can be found in the how to buy gold section. Furthermore, our preferred ETFs and ETNs can be found in our Gold & Silver ETF Ranking.
As a reminder, Gold & Silver Trading Alerts are posted before or on each trading day (we usually post them before the opening bell, but we don't promise doing that each day). If there's anything urgent, we will send you an additional small alert before posting the main one.
Thank you.
Przemyslaw Radomski, CFA
Founder, Editor-in-chief

