
tools spotlight

-
Gold Withstands the Storm. Will Miners Drag It off the Raft?
February 11, 2022, 9:08 AMIn line with bearish bets, miners have thrown a match. Gold, however, doesn’t want to leave the ring without a fight. How long will it stay high?
While gold remains relatively firm despite stock market turbulence, rising real yields, and bearish technical indicators, even a confluence of headwinds hasn’t been able to knock the yellow metal off its lofty perch. However, mining stocks haven’t been so lucky. With my short position in the GDXJ ETF offering a great risk-reward proposition, the junior gold miners’ underperformance has played out exactly as I expected.
Moreover, with major spikes in volume preceding predictable sell-offs (follow the vertical dashed lines below), I’ve warned on several occasions that the GDX ETF is prone to tipping its hand – we saw this volume spike in January, which was the 2022 top (as of today). In addition, with mining investors’ power drying up by the day, the medium-term looks equally unkind.
Please see below:
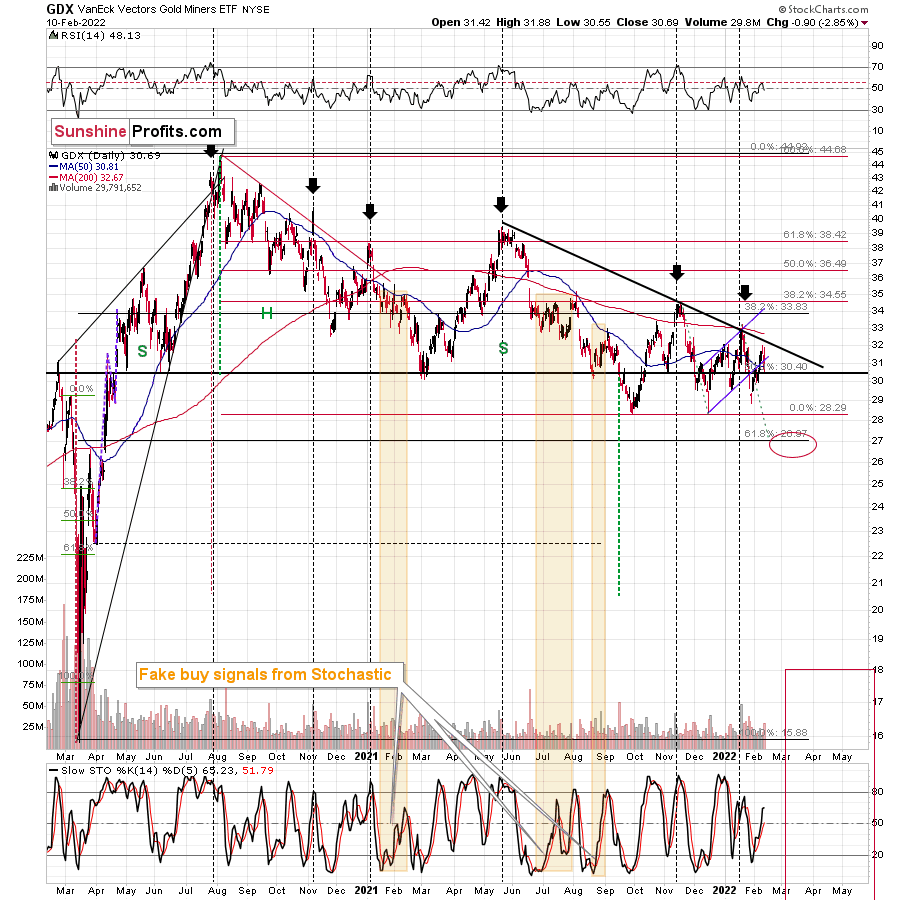
On Wednesday, gold miners fell. Even though they declined by just $0.06, it was profound. The miners were following gold higher during the early part of Wednesday’s (Feb. 9) session, but they lost strength close to the middle thereof and were back down before the closing bell.
If the gold price reversed and then declined during the day, that would have been normal. However, gold stayed up.
This tells us that the buying power has either dried up or is drying up.
When everyone who wanted to get into the market is already in it, the price can do only one thing (regardless of bullish factors) – fall. Those who are already in can then sell. Monitoring the markets for this kind of cross-sector performance is one of the more important gold trading tips.
Look, I’m not saying that declines now are “guaranteed”. There are no guarantees in the markets. There might be buyers that haven’t considered mining stocks that would now enter the market, but history tells us that this is unlikely. Instead, declines are very likely to follow.
Yesterday’s big daily decline confirmed my above comments. Gold miners declined much more than gold did, and they did so at above-average volume. The latter indicates that “down” is the true direction in which the precious metals market is heading.
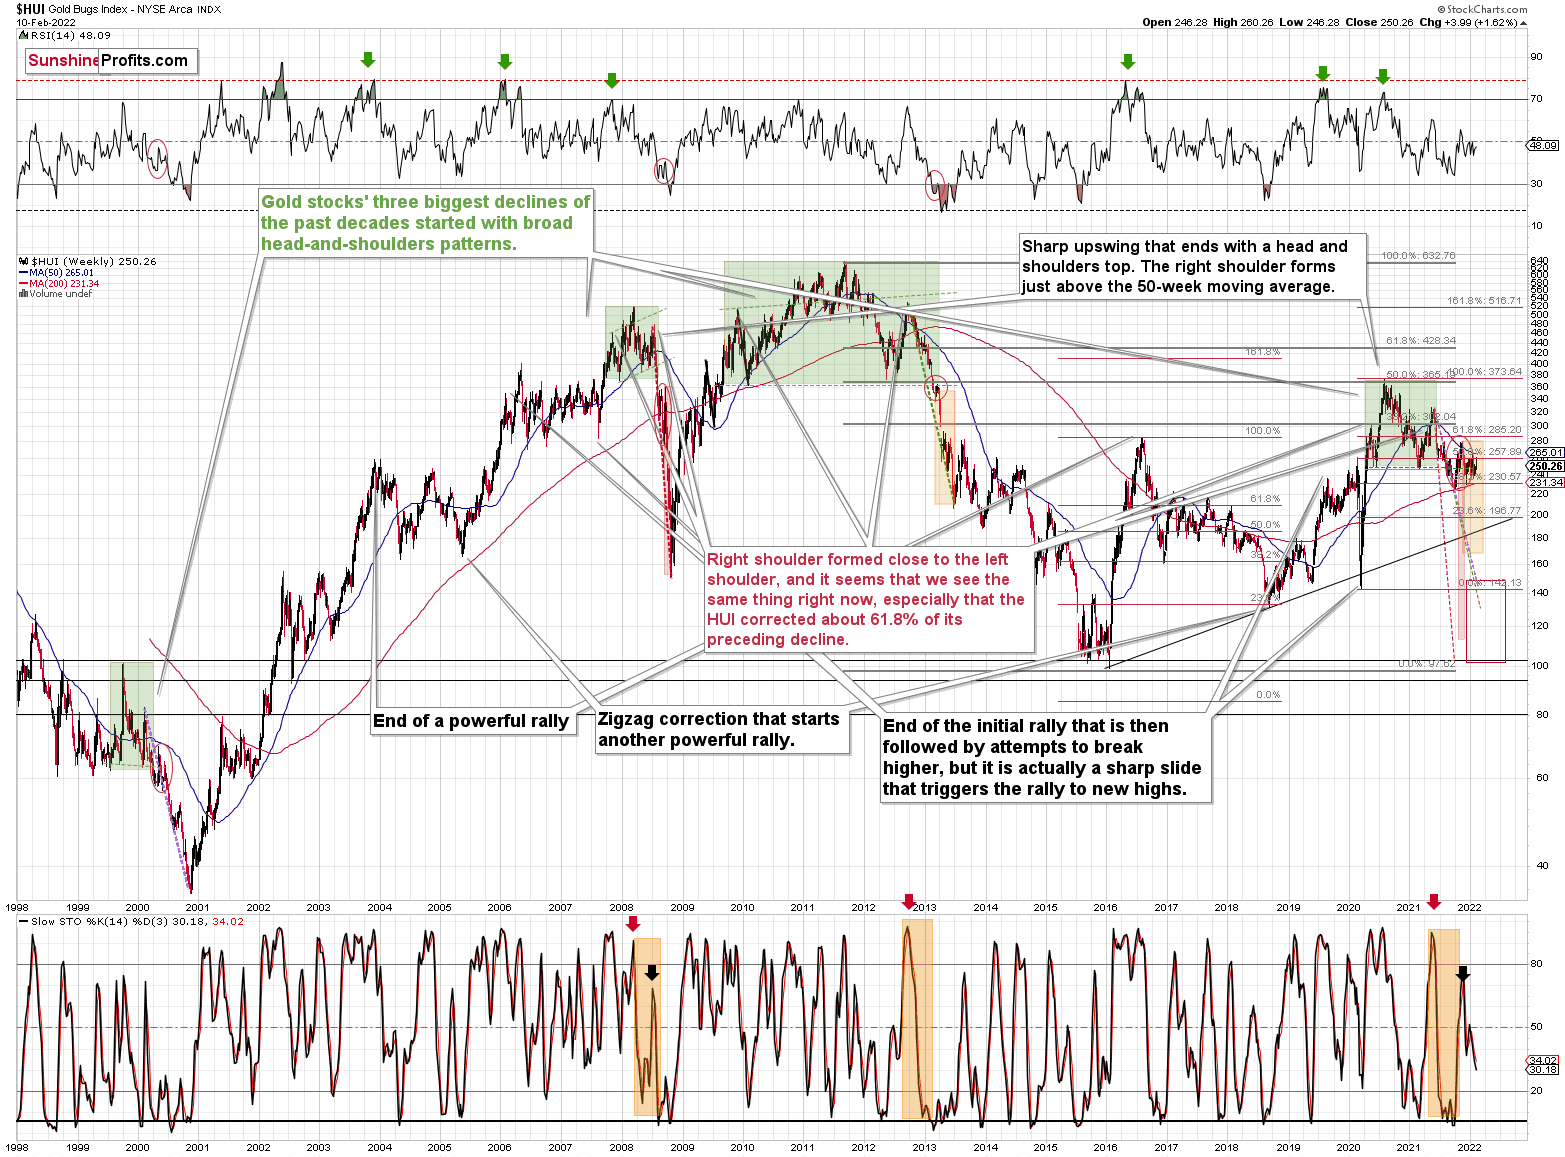
To that point, the HUI Index provides clues from a longer-term perspective. When we analyze the weekly chart, it highlights investors’ anxiety. For example, after hitting an intraweek high of roughly 260, the HUI Index ended the Feb. 10 session at roughly 250 – just 3.99 up from last Friday – that’s an intraweek reversal.
Furthermore, with the index still in a medium-term downtrend, shades of 2013 still profoundly bearish, and sharp declines often preceded by broad head and shoulders patterns (marked with green), there are several negatives confronting the HUI Index. As such, a sharp drawdown will likely materialize sooner rather than later.
Please see below:
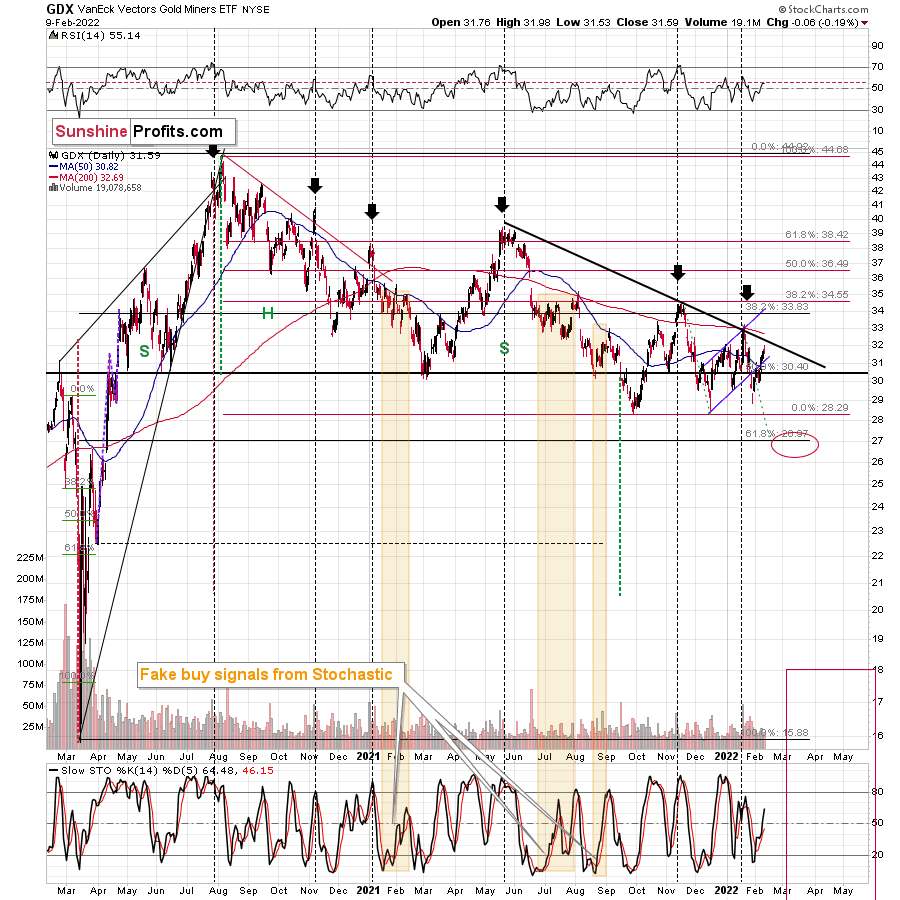
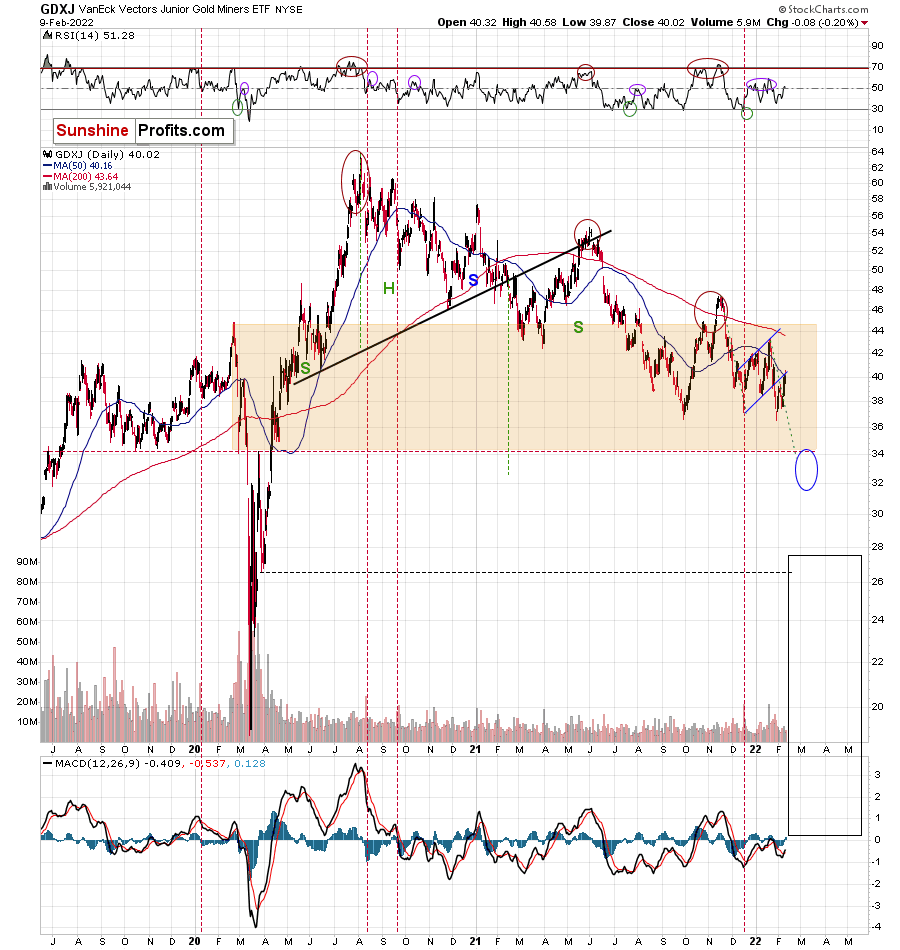
Finally, the GDXJ ETF is the gift that keeps on giving. For example, with lower highs and lower lows being part of the junior miners’ roughly one-and-a-half-year journey, false breakouts have confused many investors. However, while I’ve been warning about the weakness for some time, more downside is likely on the horizon. To explain, I wrote on Feb. 10:
I emphasized before that juniors hadn’t moved above their 50-day moving average, and that they stayed below their rising blue resistance line. Consequently – I wrote – the downtrend in them remained clearly intact.
Yesterday’s reversal served as a perfect confirmation of the above. The previous breakdowns were verified in one of the most classic ways. The silver price has been quite strong recently, which is also something that we see close to the local tops.
The reversals in mining stocks, the situation in gold, outperformance of silver, AND the situation in the USD Index (the medium-term support held) together paint a very bearish picture for the precious metals market in the short and medium term.
All in all, if the weakness continues, I expect the GDXJ ETF to challenge the $32 to $34 range. However, please note that this is my expectation for a short-term bottom. While the GDXJ ETF may record a corrective upswing at this level, the downtrend should continue thereafter, and the junior miners should fall further over the medium term.

In conclusion, gold showcased its steady hand throughout the recent volatility. However, mining stocks have cracked under the pressure. With the latter’s underperformance often a bearish omen for the former, the yellow metal’s mettle may be tested over the medium term. As such, while the long-term outlooks for gold, silver, and mining stocks remain profoundly bullish, a final climax will likely unfold before their secular uptrends continue.
Thank you for reading our free analysis today. Please note that the above is just a small fraction of the full analyses that our subscribers enjoy on a regular basis. They include multiple premium details such as the interim targets for gold and mining stocks that could be reached in the next few weeks. We invite you to subscribe now and read today’s issue right away.
Sincerely,
Przemyslaw Radomski, CFA
Founder, Editor-in-chief -
Gold Miners Lost Their Power: Bearish Scenario Confirmed
February 10, 2022, 8:47 AMThe market was up, but mining stocks chose to reverse. Meanwhile, gold sent a clear signal to investors. So, when everyone buys, what happens?
The gold mining stocks and silver mining stocks have reversed, even though gold didn’t. The top for the former is likely in.
Most developments regarding the precious metals and their immediate surroundings were a continuation of what we had seen in the previous days, but one thing was different. That one thing is particularly informative. It has trading implications, too.
Without further ado, let’s jump into mining stocks.
Gold miners fell. Even though they declined by just $0.06, it was profound. The miners were following gold higher during the early part of yesterday’s (Feb. 9) session, but they lost strength close to the middle thereof and were back down before the closing bell.
If the gold price reversed and then declined during the day, that would have been normal. However, gold stayed up.
It’s fairer to compare GDX to GLD than to compare GDX to gold continuous futures contracts, as the former have the same closing hours, so let’s take a look at what GLD did yesterday.
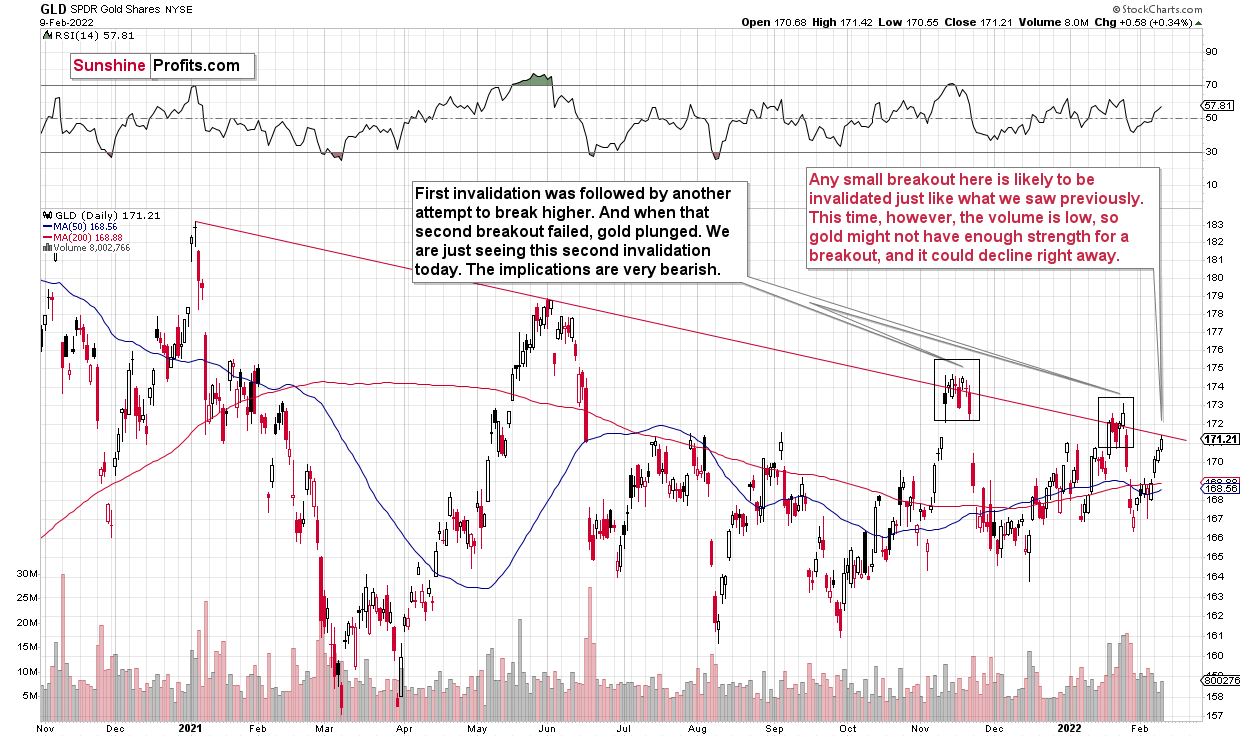
There was no reversal. GLD simply stopped at its declining medium-term resistance line. Also, the general stock market was up yesterday. Consequently, gold mining stocks had no good reason to decline. In fact, they “should have” rallied. They didn’t – they reversed instead.
This tells us that the buying power has either dried up or is drying up.
When everyone who wanted to get into the market is already in it, the price can do only one thing (regardless of bullish factors) – fall. Those who are already in can then sell. Monitoring the markets for this kind of cross-sector performance is one of the more important gold trading tips.
Look, I’m not saying that declines now are “guaranteed”. There are no guarantees in the markets. There might be buyers that haven’t considered mining stocks that would now enter the market, but history tells us that this is unlikely. Instead, declines are very likely to follow.
Let’s focus on the GLD ETF chart one more time.
As I wrote earlier, it approached its declining medium-term resistance line. Any small breakout here is likely to be invalidated just like what we saw previously in November 2021 and January 2022. This time, however, the volume is low, so gold might not have enough strength for a breakout, and it could decline right away.
Junior mining stocks provide us with a perfect confirmation of the bearish narrative.
I emphasized before that juniors hadn’t moved above their 50-day moving average, and that they stayed below their rising blue resistance line. Consequently – I wrote – the downtrend in them remained clearly intact.
Yesterday’s reversal served as a perfect confirmation of the above. The previous breakdowns were verified in one of the most classic ways. The silver price has been quite strong recently, which is also something that we see close to the local tops.
The reversals in mining stocks, the situation in gold, AND the situation in the USD Index together paint a very bearish picture for the precious metals market in the short and medium term.
By “the situation in the USD Index”, I’m referring to the fact that it’s after its early-month reversal and right above its rising medium-term support line that was not successfully broken.
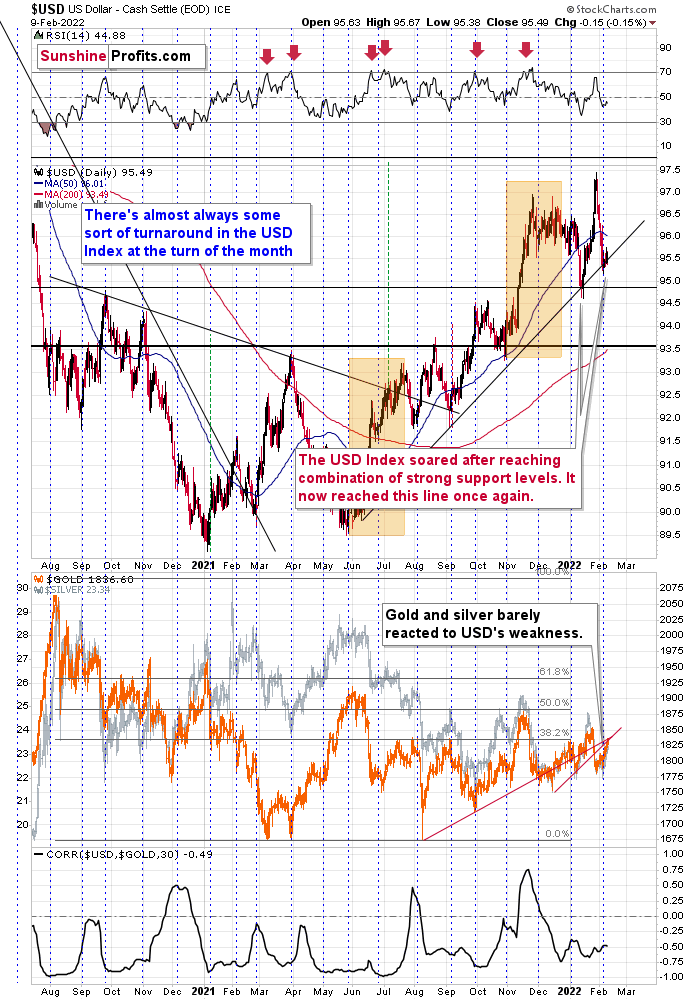
Since the USD Index remains above its rising medium-term support line, the trend remains up. Therefore, higher – not lower – USD Index values are to be expected.
All in all, it seems that gold, silver, and mining stocks are going to decline in the coming weeks (quite possibly days) and that we won’t have to wait too long for the next big decline to start.
Thank you for reading our free analysis today. Please note that the above is just a small fraction of the full analyses that our subscribers enjoy on a regular basis. They include multiple premium details such as the interim targets for gold and mining stocks that could be reached in the next few weeks. We invite you to subscribe now and read today’s issue right away.
Sincerely,
Przemyslaw Radomski, CFA
Founder, Editor-in-chief -
To Gold's Chagrin, US Economy Remains Healthy – Interest Rates a Threat
February 9, 2022, 9:47 AMWhile the PMs attempt to defy fundamental gravity, U.S. Treasury yields continue to march higher. With the U.S. 10-Year Treasury yield hitting another 2022 high of 1.97% on Feb. 8, rising interest rates remain a fundamental headwind for gold, silver and mining stocks.
Please see below:
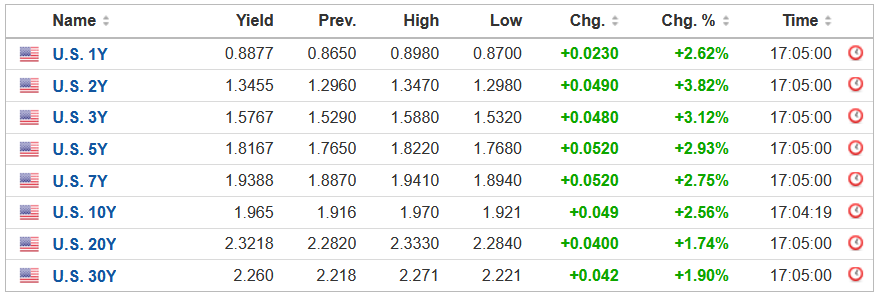 Source: Investing.com
To that point, with the Treasury benchmark hovering near a key positioning level, sustained momentum could lead to frantic hedging and push the U.S. 10-Year Treasury yield even higher. To explain, mortgage-bond investors hedge their positions by shorting U.S. Treasuries or purchasing interest rate swaps. In a nutshell: when interest rates rise, the goal is to offset the losses on long mortgage bond positions by making money on short U.S. Treasury positions.
With 1.95% as a critical level, Citigroup strategists William O’Donnell and Edward Acton told clients that they “saw no strong fingerprints” of hedging on Feb. 4. However, “a breach of 1.95% in 10’s might spur some.” As a result, if institutional investors start fearing another ‘taper tantrum,’ we may witness an extreme move higher.
Moreover, while the PMs take solace in investors’ belief that the Fed will come to the rescue, this time really is different. For one, the Fed often rescues investors when trouble materializes in the riskiest corners of the credit market. However, with volatility only present in the stock market, the ‘Fed put’ is likely much lower than current levels.
Please see below:
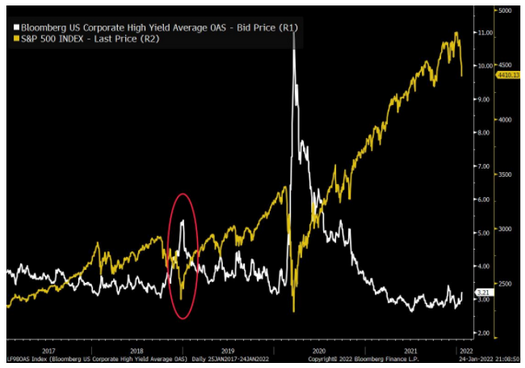
Not Coming to the Rescue
To explain, the yellow line above tracks the S&P 500, while the white line above tracks Bloomberg’s high-yield option-adjusted spread. For context, when the white line is rising, it means that investors require higher interest rates to compensate for the perceived default risk. Conversely, when the white line is falling, investors accept lower interest rates as default is less likely.
If you analyze the red circle near the middle of the chart, you can see that the Fed flipped from hawkish to dovish in late 2018 after high-yield credit markets freaked out (depicted by the white line rising sharply). Similarly, the Fed fired its QE bazooka when the white line went to the moon during the coronavirus crisis.
However, if you analyze the right side of the chart, you can see that the white line remained relatively calm even as the S&P 500 sold off. As a result, it will likely take more stock market weakness before the Fed changes its tone.
Second, I’ve warned on numerous occasions that the U.S. economy remains on solid footing. Since a bullish U.S. economy is bearish for the PMs and the NASDAQ Composite, the more economic growth increases, the more the Fed keeps its foot on the hawkish accelerator.
To that point, while the Omicron variant has hurt in-person activity, the latest data from the U.S. Bureau of Economic Analysis (BEA) shows that Americans are still swiping their debit and credit cards.
Please see below:
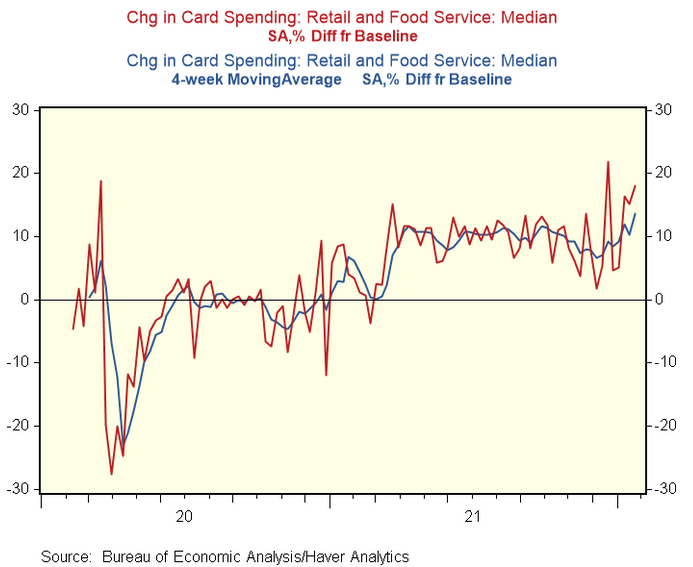
To explain, the red and blue lines above track the baseline and four-week moving average percentage changes in Americans’ debit and credit card spending. If you analyze the right side of the chart, you can see that consumer spending remains on the up and up.
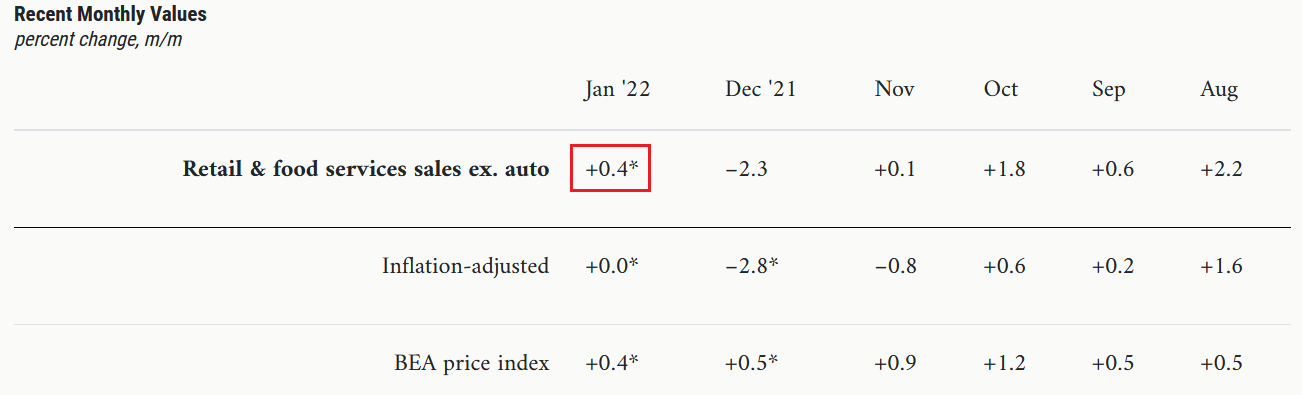
As further evidence, the Chicago Fed’s Advance Retail Trade Summary (CARTS) tracks U.S. retail sales every week. In a nutshell: it tries to predict the government data that comes out each month. After correctly predicting a decline in December, the Chicago Fed expects U.S. retail sales to increase by 0.40% month-over-month (MoM) in January.
Please see below:
 Source: Chicago Fed
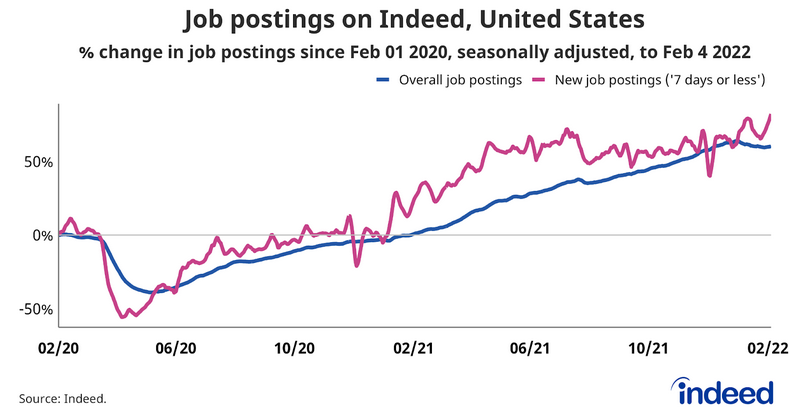
Third, Indeed released its latest U.S. job openings report on Feb. 8. An excerpt read:
“It seems like the worst of the Omicron surge’s impact might have passed. New job postings (those on Indeed for 7 days or less) are at a series high. As of February 4, new postings are 82.2% above pre-pandemic baseline, up 13 percentage points since last week.” Moreover, “job postings in all occupational sectors are above pre-pandemic baseline, especially human resources and software development.”
Please see below:
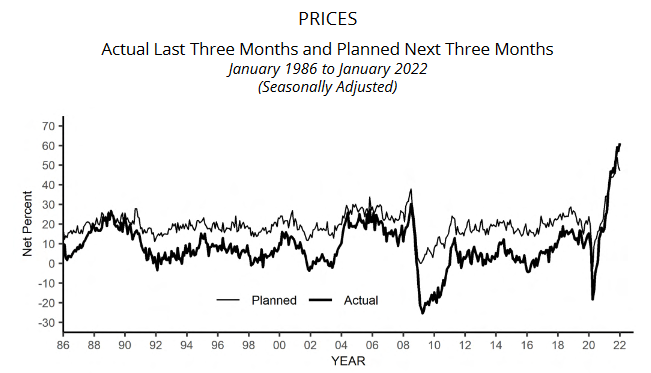
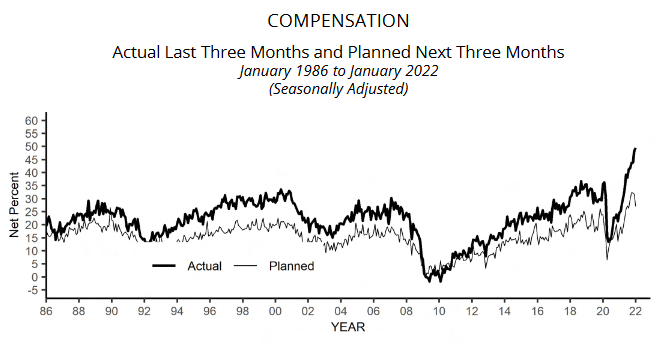
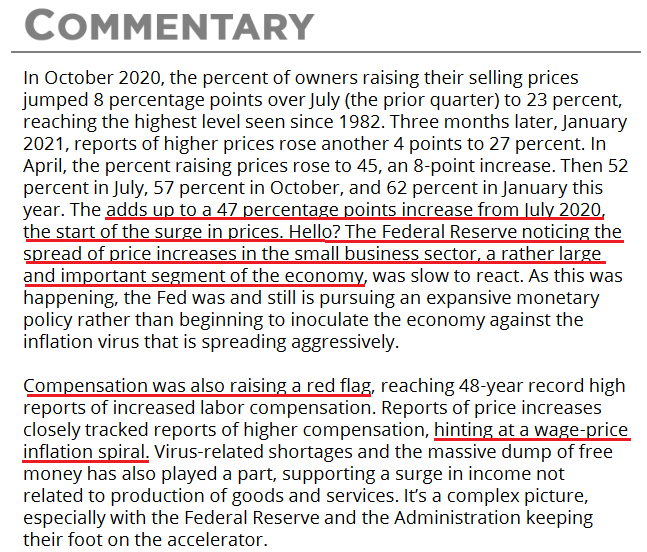
Fourth, the NFIB released its Small Business Optimism Index on Feb. 8. While the headline index declined from 98.9 in December to 97.1 in January, NFIB Chief Economist Bill Dunkelberg said that “more small business owners started the New Year raising prices in an attempt to pass on higher inventory, supplies, and labor costs. In addition to inflation issues, owners are also raising compensation at record high rates to attract qualified employees to their open positions.”
To that point, an excerpt from the report read:
“The net percent of owners raising average selling prices increased 4 points to a net 61 percent seasonally adjusted, the highest reading since Q4 1974.”
Please see below:
 Source: NFIB
As for wage inflation:
“Seasonally adjusted, a net 50 percent reported raising compensation, up 2 points from December and a 48-year record high reading.”
Please see below:
 Source: NFIB
On top of that, while I sounded the inflationary alarm throughout all of 2021, the mainstream finally realizes that inflation is far from “transitory.”
 Source: NFIB
Speaking of wage inflation, Goldman Sachs’ Wage Tracker is also at record highs.
Please see below:
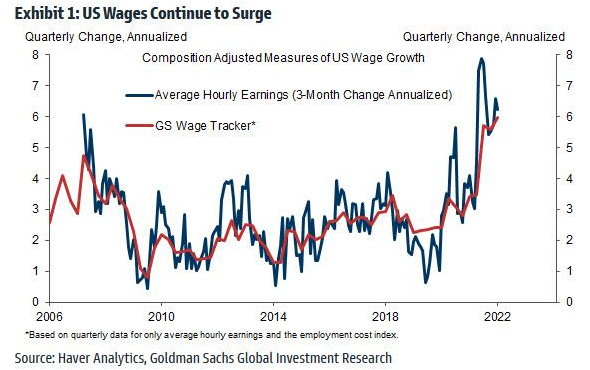
To explain, the blue line above tracks the three-month annualized change in average hourly earnings, while the red line above tracks Goldman Sachs' Wage Tracker. If you analyze the right side of the chart, you can see that the latter is now at an all-time high.
To that point, Goldman Sachs' Chief Economist, Jan Hatzius, warned clients that the wage tracker has "accelerated to a 6% annualized rate over the past 2-3 quarters" and that "the broadening of wage and price pressures across the advanced economies implies that growth needs to slow and financial conditions need to tighten at an earlier stage of the recovery than previously expected."
The bottom line? While the PMs assume that all is well on Wall Street, the outperformance of commodities in January only enhances the inflationary pressures. With weak data needed for the Fed to perform a dovish 180, the strength of the U.S. labor market signals the exact opposite. Moreover, while investors assumed that the end of enhanced unemployment benefits would kill consumer spending, there is still plenty of cash (too much) in the system. As a result, the Fed should remain on its hawkish warpath, and higher U.S. Treasury yields and a stronger USD Index will likely be the end result.
In conclusion, the PMs rallied on Feb. 8, as tepid optimism from the S&P 500 helped uplift sentiment. However, while investors hope that the Fed won't drop the hawkish hammer, the reality is that the U.S. economy remains on solid footing. As a result, the Fed should raise interest rates at its March monetary policy meeting. Moreover, with history revealing that U.S. Treasury yields and the USD Index are often the main beneficiaries of the Fed's rate-hike cycle, another re-enactment should be unkind to the PMs.
Thank you for reading our free analysis today. Please note that the above is just a small fraction of the full analyses that our subscribers enjoy on a regular basis. They include multiple premium details such as the interim targets for gold and mining stocks that could be reached in the next few weeks. We invite you to subscribe now and read today’s issue right away.
Sincerely,
Przemyslaw Radomski, CFA
Founder, Editor-in-chief -
Rooting For the Euro? Bad News: The USDX Is Still Strong
February 8, 2022, 9:37 AMWhile the EUR/USD held on to its ECB-induced gains, the bearish fundamental realities confronting the currency pair were confirmed on Feb. 7. To explain, while euro bulls think that the ECB will have a hawkish awakening, I warned on Feb. 4 that the prospect is much more semblance than substance.
I wrote:
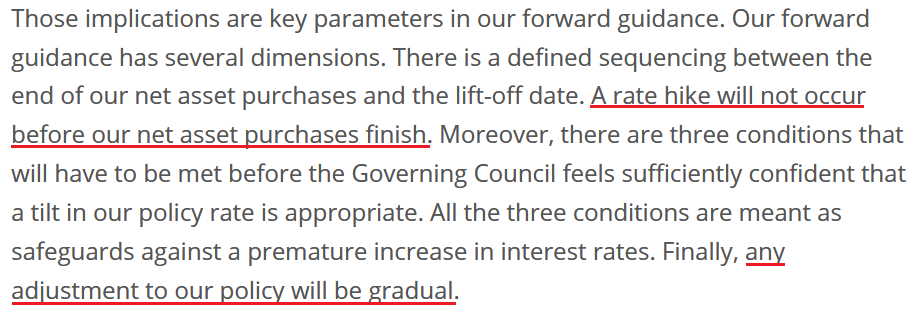
With the ECB’s monetary policy statement reading that “from October onwards, the Governing Council will maintain net asset purchases under the APP at a monthly pace of €20 billion for as long as necessary to reinforce the accommodative impact of its policy rates,” how can the ECB raise interest rates if it still plans to purchase bonds past October 2022? Think about it: Lagarde said that “we will look at net asset purchases first.” And if ending QE is the first step in the process, then the ECB is nowhere near the second step.
To that point, ECB President Christine Lagarde told the European Parliament committee on Feb. 7: “There are no signals that inflation will be persistently and significantly above our target over the medium term, which would require measurable tightening.”
She added: “We have to bear in mind that demand conditions in the Euro Area do not show the same signs of overheating that can be observed in other major economies. This increases the likelihood that the current price pressures will subside before becoming entrenched, enabling us to deliver on our 2% target over the medium term.”
For context, investors have priced in two ECB rate hikes in 2022. However, with the central bank still planning to purchase bonds “from October onwards” and Lagarde saying that rate hikes will only be considered thereafter, short-term sentiment should crumble over the medium term.
Please see below:
 Source: ECB
On the flip side, U.S. inflation is materially outperforming the Eurozone. With the pricing pressures depressing consumer confidence and hurting U.S. President Joe Biden’s re-election prospects, the Fed doesn’t have time for “gradual” adjustments.
Please see below:
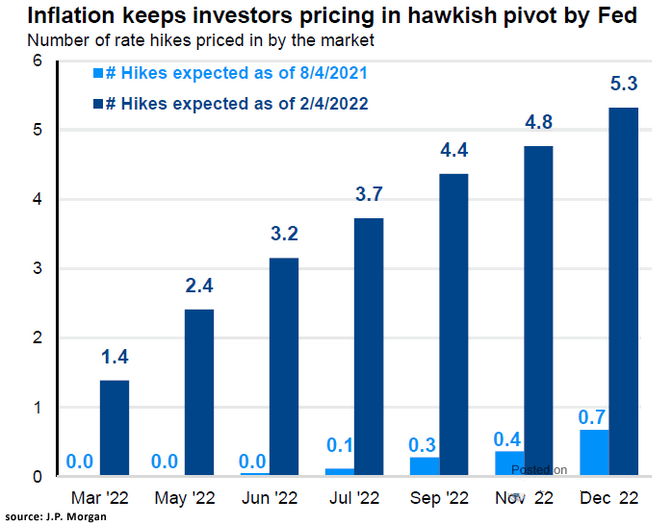
To explain, the light and dark blue bars above track the number of Fed rate hikes priced in during different time periods and 2022 dates. If you analyze the light blue bar furthest to the right, you can see that investors expected less than one rate hike by December 2022 on Aug. 4. However, fast forward six months, and the dark blue bar furthest to the right shows that investors expect more than five rate hikes by December 2022 as of Feb. 4.
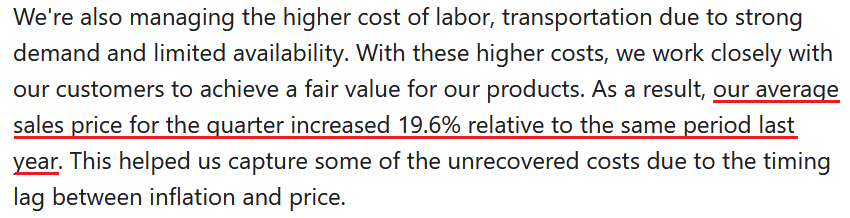
Expanding on inflation, Tyson Foods – the largest food company in the U.S. – released its first-quarter earnings on Feb. 7. CEO Donnie King said during the Q1 conference call:
“In the quarter, our cost of goods sold was up 18% relative to the same period last year. We are seeing higher costs across our supply chain, including higher input costs such as feed and ingredients. We're also managing the higher cost of labor and transportation due to strong demand and limited availability.”
Moreover, CFO Stewart Glendinning added:
“We saw continued inflation across the business, in some instances, up 20% to 30%. Notable examples were labor, grain costs, live cattle and hog costs, and freight costs.”
How is the company responding to the inflationary pressures?
 Source: Tyson Foods/The Motley Fool
Some Things Never Change
Thus, with relative inflation tilted heavily in the U.S.’s direction, the Fed has much less wiggle room to remain dovish. As a result, while I’ve stated this on numerous occasions, the Fed and the ECB are worlds apart. To that point, I highlighted on Feb. 4 how Eurozone core inflation decelerated in January and how the media’s alignment of U.S. and Eurozone inflation dynamics lacks fundamental credibility.
I wrote:
 Source: Eurostat
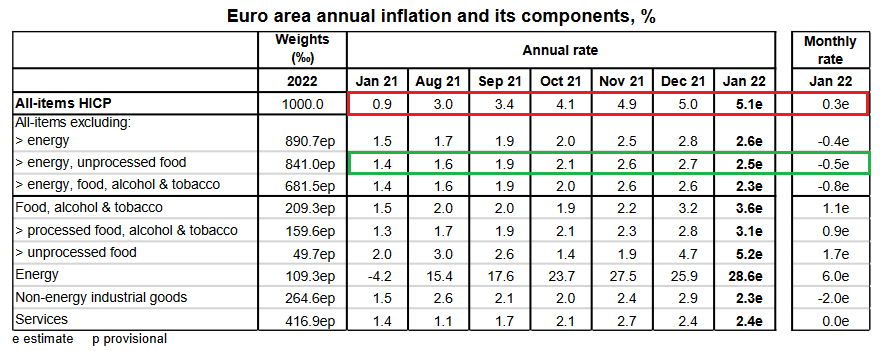
 To explain, follow the trajectory of the red rectangle above. As you can see, headline inflation (which includes food and energy) went from a 0.9% year-over-year (YoY) increase in January 2021 to a 5.1% YoY increase in January 2022. Pretty troublesome, huh?
However, if you focus your attention on the green rectangle, you can see that Eurozone core inflation (which excludes food and energy) declined from 2.7% YoY in December 2021 to 2.5% YoY in January 2022. As a result, while investors assume that abnormally high headline inflation will elicit a hawkish response from the ECB, the reality is that oil & gas remains the region’s only problem.
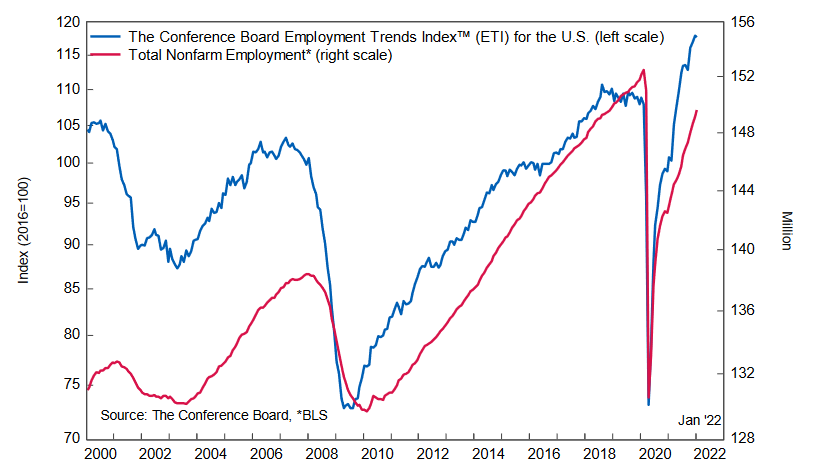
Also noteworthy, the second half of the Fed’s dual mandate is to ensure a healthy U.S. labor market. Whether it’s nonfarm payrolls, nonfarm job openings, or NFIB employment data, it’s not hard to find a job in the U.S. Thus, when combining inflationary pressures with employment outperformance, there is little reason for the Fed to perform a dovish 180.
As evidence, The Confidence Board released its Employment Trends Index (ETI) on Feb. 7. While the index declined from 117.94 in December (an upward revision) to 117.64 in January, Frank Steemers, Senior Economist at The Conference Board, said:
“It appears that the Omicron variant did not impact job growth as much as initially feared. Solid job growth is likely to continue over the next months."
Moreover, he added:
“Employers appear to be managing these pandemic disruptions better, even as many workers called in sick or had to quarantine in January. On the other hand, employers are still trying hard to hold on to their workers in a tight labor market. Hiring and retention continues to be a challenge which we do not expect to dissipate anytime soon, especially for employers of manual labor and services.”
For context, “a tight labor market” and “retention” issues only increase wage inflation. However, the important point is that the U.S. labor market remains healthy enough for the Fed to forge ahead with rate hikes.
Please see below:
Finally, while the EUR/USD attempts to defy fundamental gravity, the currency pair’s sell-off in 2021 was likely far from capitulation. As a result, there is plenty of room for speculators to recalibrate their positions.
Please see below:
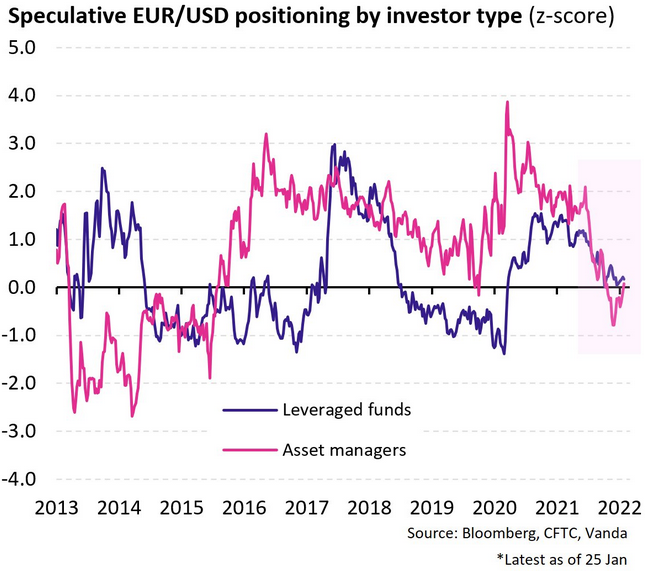
To explain, the blue and purple lines above track the speculative EUR/USD positioning of leveraged funds and asset managers. If you analyze the right side of the chart, you can see that both are roughly flat (near zero). However, if you focus your attention on the blue line, you can see that leveraged funds’ EUR/USD shorts were much higher during the periods from 2014 to 2020 (depicted by the blue line falling below zero).
Similarly, asset managers’ EUR/USD shorts were also much higher from 2013 through 2015 (depicted by the purple line falling below zero). As such, bearish EUR/USD sentiment still has room to increase, and neutral positioning means that a short-squeeze is unlikely to occur.
The bottom line? While the USD Index’s recent weakness may seem troubling, the greenback’s fundamentals remain robust. Despite the short-term sentiment shift, several corrective downswings occurred throughout the USD Index’s bullish journey in 2021. Moreover, with the Fed still well ahead of the ECB, harsh reality should confront the EUR/USD over the medium term.
In conclusion, the PMs rallied on Feb. 7, as commodities were in style once again. However, with the U.S. 10-Year Treasury yield gunning for 2% and the USD Index poised for a recovery, a reversal of fortunes will likely occur over the medium term. As a result, lower lows should confront the PMs over the next few months.
Thank you for reading our free analysis today. Please note that the above is just a small fraction of the full analyses that our subscribers enjoy on a regular basis. They include multiple premium details such as the interim targets for gold and mining stocks that could be reached in the next few weeks. We invite you to subscribe now and read today’s issue right away.
Sincerely,
Przemyslaw Radomski, CFA
Founder, Editor-in-chief


Gold Investment News
Delivered To Your Inbox
Free Of Charge
Bonus: A week of free access to Gold & Silver StockPickers.
Gold Alerts
More-
Status
New 2024 Lows in Miners, New Highs in The USD Index
January 17, 2024, 12:19 PM -
Status
Soaring USD is SO Unsurprising – And SO Full of Implications
January 16, 2024, 8:40 AM -
Status
Rare Opportunity in Rare Earth Minerals?
January 15, 2024, 2:06 PM

