

Briefly: in our opinion, full (300% of the regular position size) speculative short positions in junior mining stocks are justified from the risk/reward point of view at the moment of publishing this Alert.
The gold mining stocks and silver mining stocks have reversed, even though gold didn’t. The top of the former is likely in.
Most developments regarding the precious metals and their immediate surroundings were a continuation of what we had seen in the previous days, but one thing was different. This one thing is particularly informative. It has trading implications, too.
Without further ado, let’s jump into mining stocks.
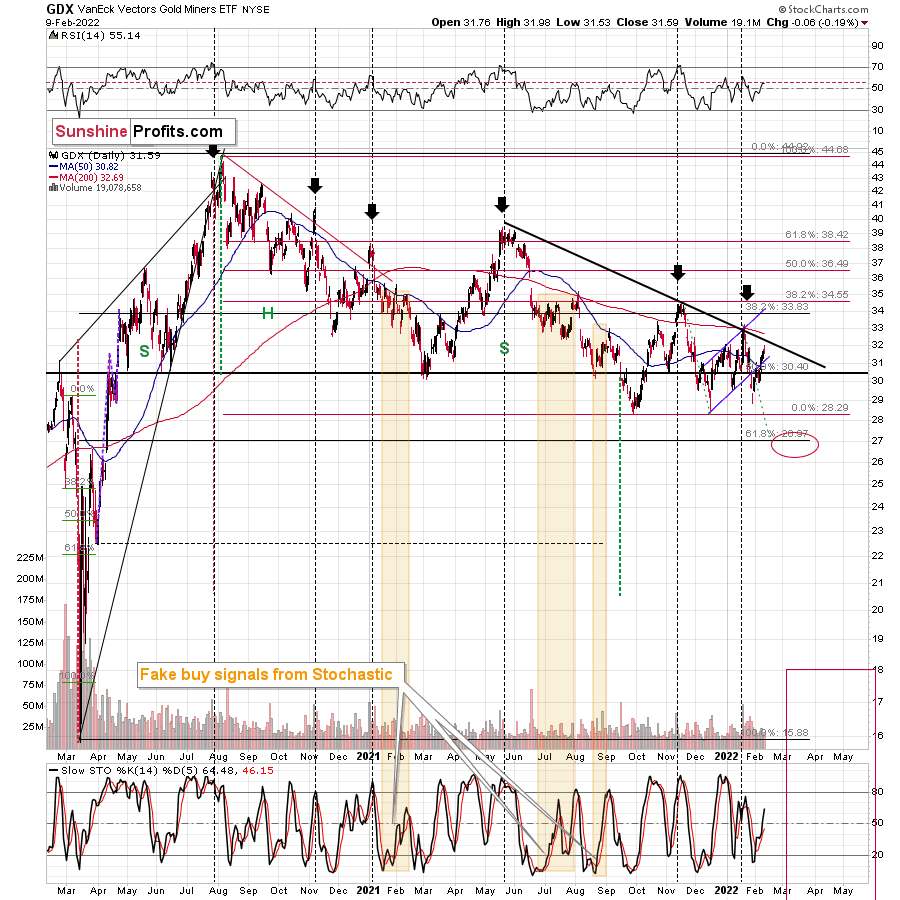
Gold miners fell. Even though they declined by just $0.06, it was profound. Gold miners were following gold higher during the early part of yesterday’s (Feb. 9) session, but they lost strength close to the middle thereof and were back down before the closing bell.
If the gold price reversed and then declined during the day, that would have been normal. However, gold stayed up.
It’s fairer to compare GDX to GLD than to compare GDX to gold continuous futures contracts, as the former have the same closing hours, so let’s take a look at what GLD did yesterday.
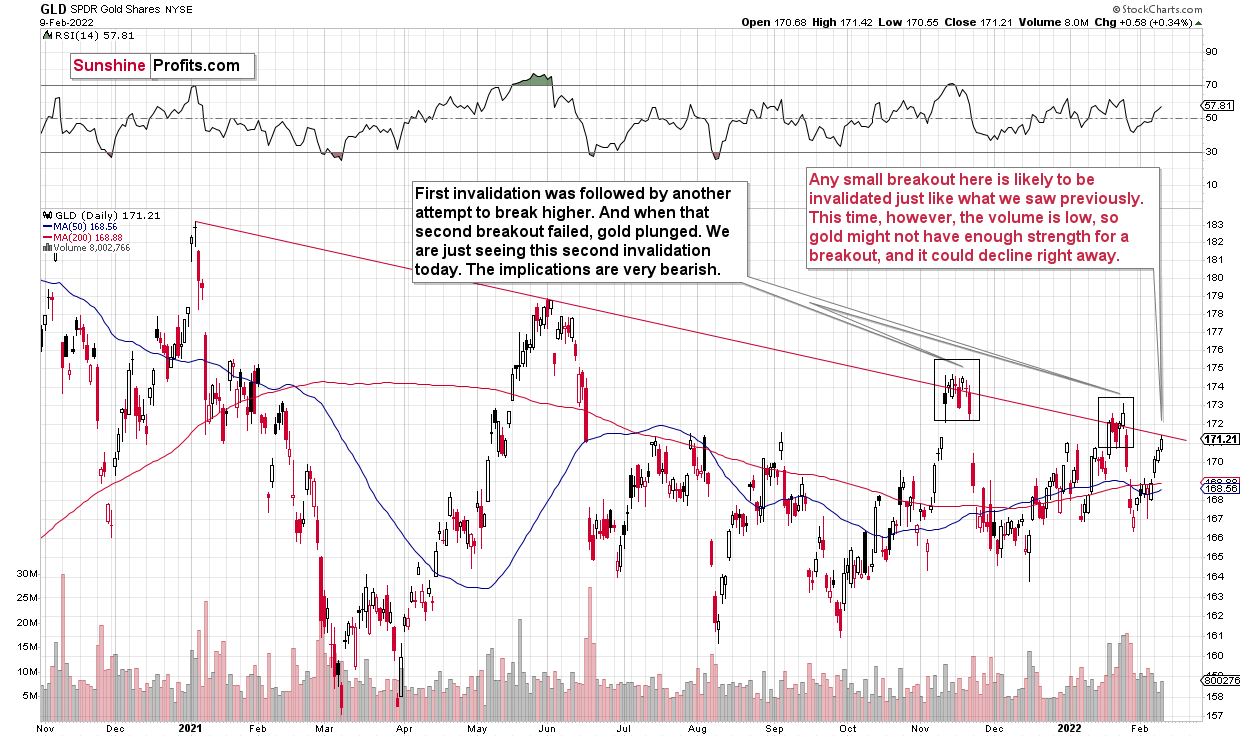
There was no reversal. GLD simply stopped at its declining medium-term resistance line. Also, the general stock market was up yesterday. Consequently, gold mining stocks had no good reason to decline. In fact, they “should have” rallied. They didn’t – they reversed instead.
This tells us that the buying power has either dried up or is drying up.
When everyone who wanted to get into the market is already in it, the price can do only one thing (regardless of bullish factors) – fall. Those who are already in can then sell. Monitoring the markets for this kind of cross-sector performance is one of the more important gold trading tips.
Look, I’m not saying that declines now are “guaranteed”. There are no guarantees in the markets. There might be buyers that haven’t considered mining stocks that would now enter the market, but history tells us that this is unlikely. Instead, declines are very likely to follow.
Let’s focus on the GLD ETF chart one more time.
As I wrote earlier, it approached its declining medium-term resistance line. Any small breakout here is likely to be invalidated just like what we saw previously in November 2021 and January 2022. This time, however, the volume is low, so gold might not have enough strength for a breakout, and it could decline right away.
Junior mining stocks provide us with a perfect confirmation of the bearish narrative.
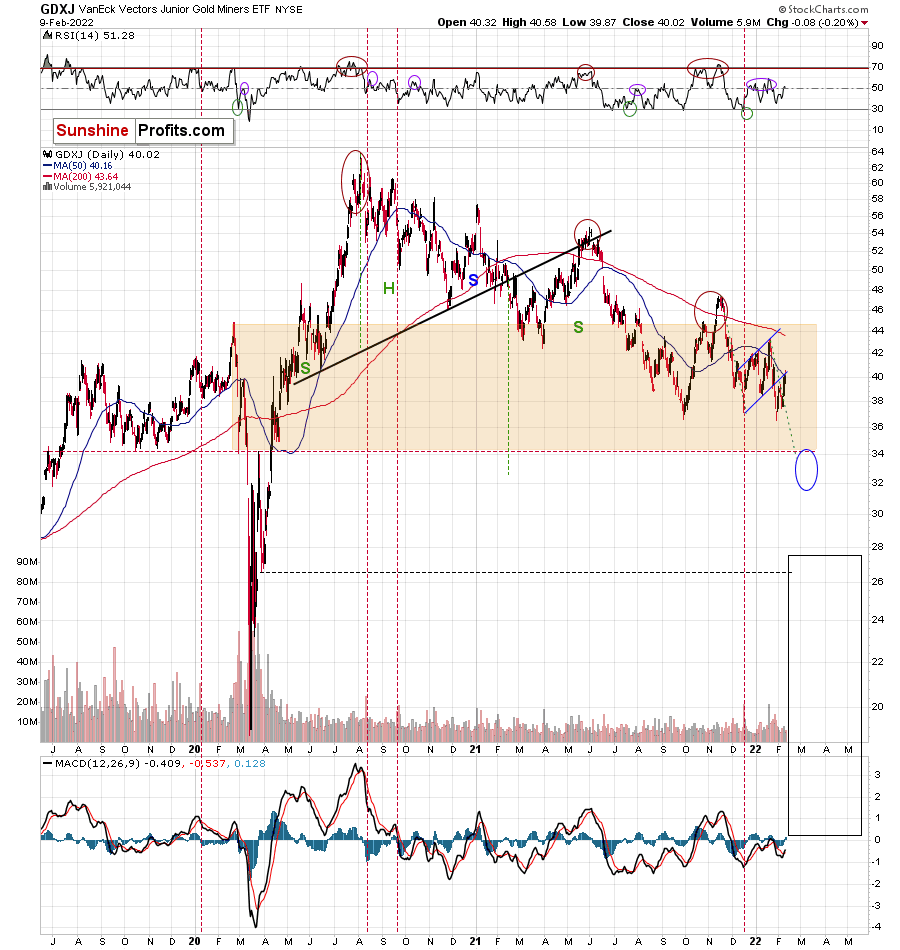
I emphasized before that juniors hadn’t moved above their 50-day moving average, and that they stayed below their rising blue resistance line. Consequently – I wrote – the downtrend in them remained clearly intact.
Yesterday’s reversal served as a perfect confirmation of the above. The previous breakdowns were verified in one of the most classic ways. The silver price has been quite strong recently, which is also something that we see close to the local tops.
The reversals in mining stocks, the situation in gold, AND the situation in the USD Index together paint a very bearish picture for the precious metals market in the short and medium term.
By “the situation in the USD Index”, I mean the fact that it’s after its early-month reversal and right above its rising medium-term support line that was not successfully broken.
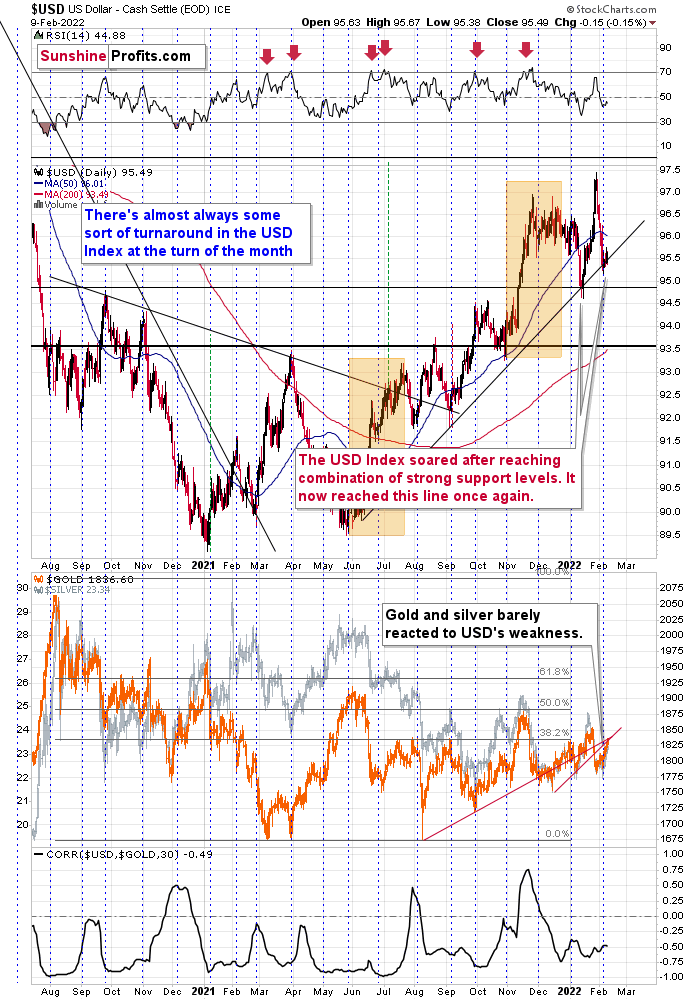
Since the USD Index remains above its rising medium-term support line, the trend remains up. Therefore, higher – not lower – USD Index values are to be expected.
All in all, it seems that gold, silver, and mining stocks are going to decline in the coming weeks (quite possibly days) and that we won’t have to wait too long for the next big decline to start.
Having said that, let’s take a look at the markets from a more fundamental point of view.
It’s Not a Lie if You Believe It
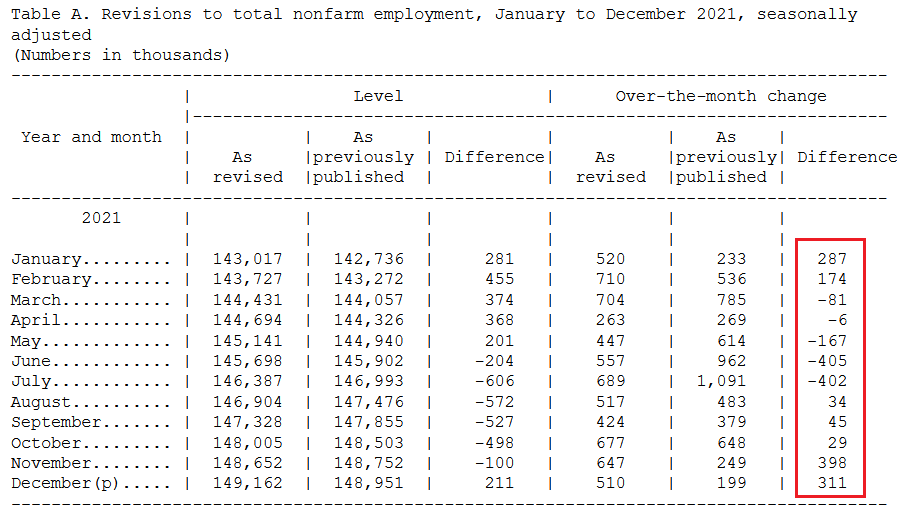
While a bullish U.S. economy contributes to our bearish fundamental thesis for the PMs, U.S. nonfarm payrolls have elicited some confusion. For example, the Feb. 4 print included significant upward and downward revisions, with the net result showing more than 200,000 additional job gains in 2021.
To explain, I wrote on Feb. 7:
The U.S. Bureau of Labor Statistics (BLS) revealed that “the over-the-month employment change for November and December 2021 combined is 709,000 higher than previously reported, while the over-the-month employment change for June and July 2021 combined is 807,000 lower. Overall, the 2021 over-the-year change is 217,000 higher than previously reported.”
Thus, the U.S. added more than 700,000 combined jobs in November and December than previously reported, and the net gain in 2021 was more than 200,000.
Please see below:
 Source: BLS
To that point, if you focus your attention on the red rectangle on the right side of the chart above, you can see that downward revisions of 167,000, 405,000 and 402,000 occurred in May, June, and July. Conversely, upward revisions of 398,000 and 311,000 occurred in November and December. As a result, hundreds of thousands of job gains and losses were reassigned, and skepticism has arisen about the real truth.
For example, a subscriber referred us to a blog post that stated the following:
“In my lifetime of reviewing data and analytics, I have never reviewed a level of statistical manipulation that even comes close to this. Well, at least not since the 1980’s junk bond valuations used for corporate restructuring and asset removal. What the BLS produced today will likely go down in the annals of actuarial history as one of the most comprehensively fraudulent manipulations of labor and statistics in history.”
However, please note that a conservative columnist wrote the article, and political passions can cloud judgment. For context, our goal is to provide objective analysis, and we don’t root for or against the U.S. economy. We simply call it how we see it.
Second, please remember that it doesn’t matter whether the data is accurate or not. What matters is how investors react. Since the majority of market participants trust the BLS, its data releases move markets.
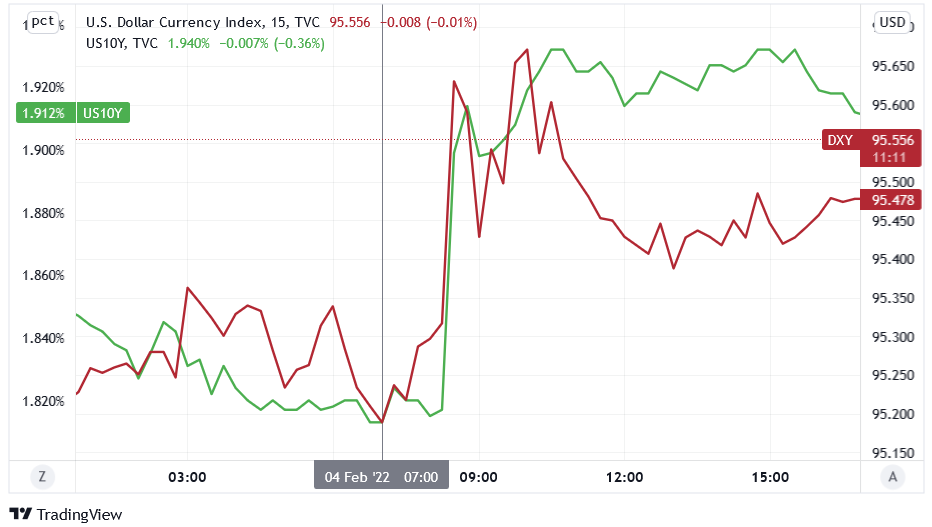
For example, BLS data influences the USD Index, U.S. Treasury yields, and therefore, the PMs. Please have a look at the sharp moves higher by the USD Index (the red line) and the U.S. 10-Year Treasury yield (the green line) following the payroll release on Feb. 4:
Furthermore, as a more accurate depiction of a healthy U.S. labor market, we analyze job openings. For example, when employment opportunities are abundant, the probability of a consumer credit crisis remains low. As long as that’s the case, the U.S. economy should remain on solid footing.
To explain, I wrote on Feb. 2:
The BLS revealed on Feb. 1 that U.S. job openings came in at 10.925 million, ahead of the 10.300 million expected. Moreover, there are now 4.606 million more job openings in the U.S. than citizens unemployed.
Please see below:
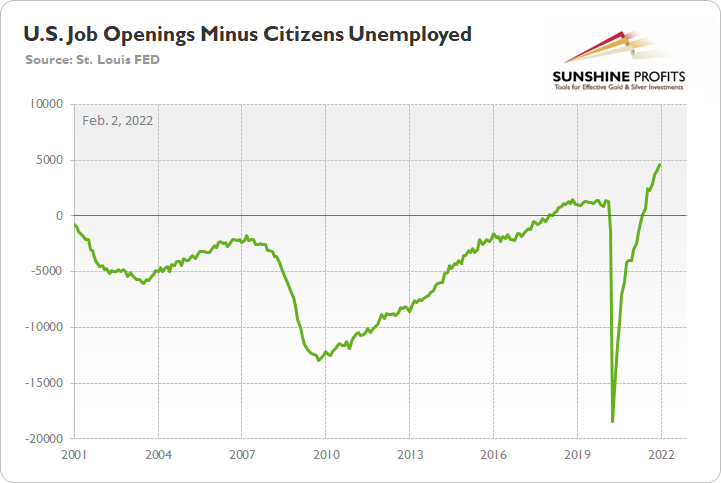
To explain, the green line above subtracts the number of unemployed U.S. citizens from the number of U.S. job openings. If you analyze the right side of the chart, you can see that the epic collapse has completely reversed.
Thus, if you analyze the chart above, you can see that job openings relative to unemployed U.S. citizens are at an all-time high. As such, there are more than enough jobs available to employ the entire U.S. labor force. Moreover, while not all prospects will find all of the job openings suitable, the important point is that if Americans struggle financially, they should be able to earn a salary somewhere.
All in all, please remember that market sentiment plays an important role and sometimes, investors’ interpretations of fundamental data are more important than the fundamental data itself. As a result, whether the BLS cooked the books or not, the release only provides more fundamental fuel for the Fed to raise interest rates in the coming months.
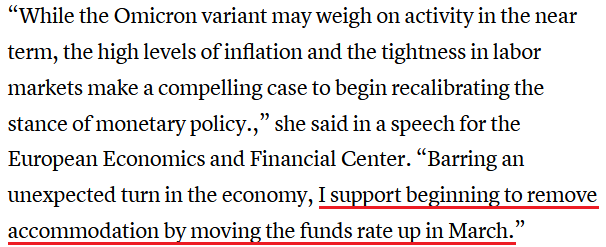
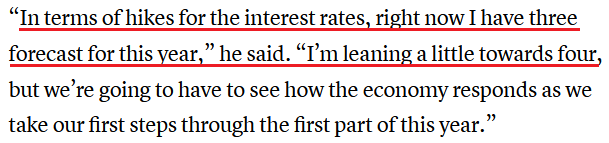
Speaking of the Fed, Cleveland Fed President Loretta Mester commented on potential rate hikes on Feb. 9. She said: “Each meeting is going to be in play. We’re going to assess conditions, we’re going to assess how the economy’s evolving, we’re going to be looking at the risks, and we’re going to be removing accommodation.”
As a result:
 Source: CNBC
Likewise, Atlanta Fed President Raphael Bostic said on Feb. 9: “I think that we should really be looking into ways to remove that excess liquidity that the market has shown us exists so that we can then get into decisions about what the use of the balance sheet should look like in terms of a menu of tightening our policy.”
As a result:
 Source: CNBC
Similarly, while the general stock market rallied on Feb. 9, investors priced in a 50% chance of six rate hikes by the Fed by December 2022.
Please see below:
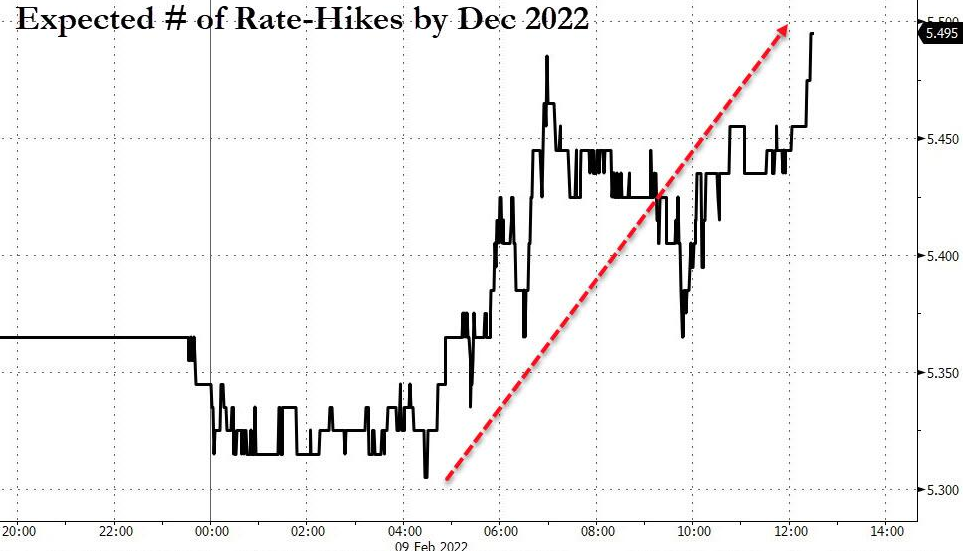 Source: Bloomberg/Zero Hedge
On top of that, Goldman Sachs also upped its U.S. 10-Year Treasury yield projection on Feb. 9. Moreover, the investment bank expects another 30 to 35 basis point increase in the U.S. 10-Year real yield. The note to clients read:
“Most of the bond selloff should, in our view, come from an increase in real yields. We expect 2y real yields to rise by another 100bp by the end of the year, and 10y real yields to rise by another 30-35bp, both in addition to already substantial increases seen this year. The increases, particularly at the front end, reflect both the pull forward of liftoff and front loading of rate hikes, as well as an expectation that inflation will soften from current elevated levels over time.”
Please see below:
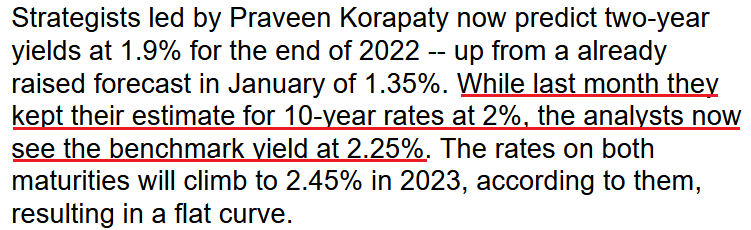 Source: Bloomberg
Finally, while the Consumer Price Index (CPI) may or may not outperform expectations today, the reality is that inflation remains materially outside of the Fed’s comfort zone. While some measures of goods inflation have slowed recently, wage inflation remains problematic.
Please see below:
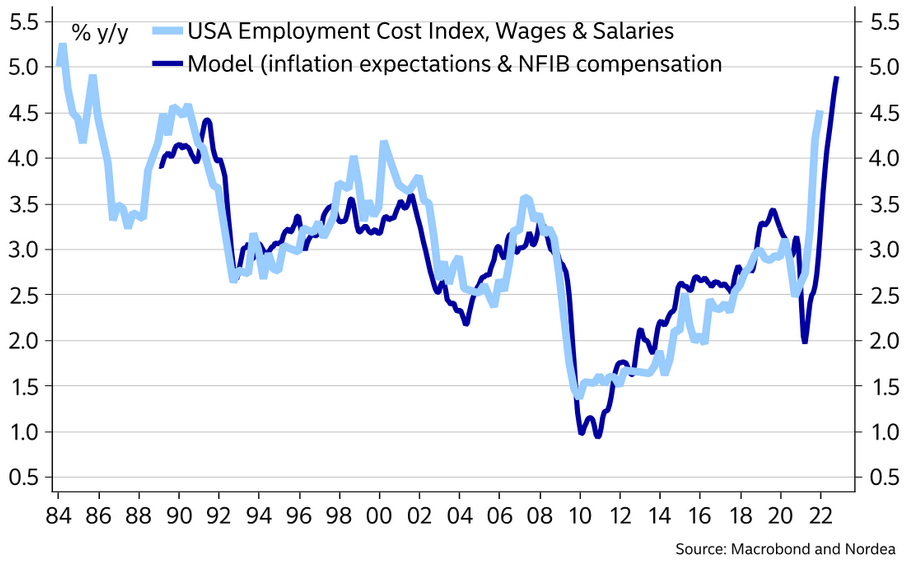
To explain, the light blue line above tracks the year-over-year (YoY) percentage change in the U.S. Employment Cost Index (ECI), while the dark blue line above tracks the YoY percentage change in Nordea’s model-implied value. If you analyze the right side of the chart, you can see that the ECI still has room to move higher. As a result, persistent inflation should allow the Fed to forge ahead with rate hikes in the coming months, and history has shown that the PMs perform poorly in these fundamental environments.
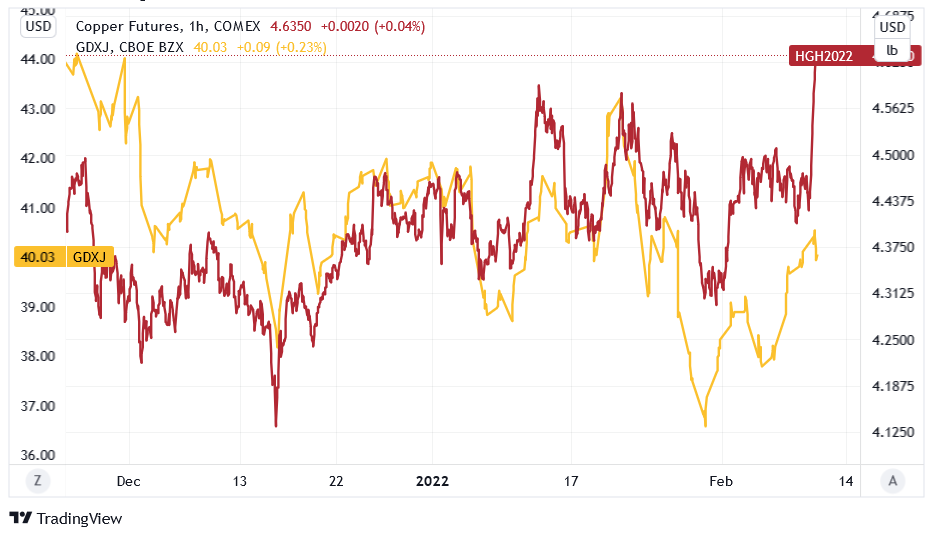
The bottom line? Since U.S. economic growth should remain resilient, the Fed should continue on its hawkish warpath. With the Fed telegraphing what should occur in the coming months, prior rate-hike cycles have been unkind to the PMs. To that point, please have a look at the GDXJ ETF’s one-hour relative performance. While the general stock market rallied and copper soared on Feb. 9 (the red line below), the GDXJ ETF (the gold line below) did not. As a result, even the daily risk-on rally (focus your attention on the right side of the chart) couldn’t stimulate any real momentum.
In conclusion, the PMs were mixed on Feb. 9, as the USD Index continues its consolidation. However, the fundamentals that drove the dollar higher remain intact, and a sharp reversal should occur over the medium term. Moreover, while U.S. Treasury yields may consolidate after their feverish run, a resilient U.S. economy and sticky inflation should support their continued uptrends. As a result, more pain should confront the PMs over the next few months.
Overview of the Upcoming Part of the Decline
- It seems to me that the corrective upswing is now over, and that gold, silver, and mining stocks are now likely to continue their medium-term decline.
- It seems that the first (bigger) stop for gold will be close to its previous 2021 lows, slightly below $1,700. Then it will likely correct a bit, but it’s unclear if I want to exit or reverse the current short position based on that – it depends on the number and the nature of the bullish indications that we get at that time.
- After the above-mentioned correction, we’re likely to see a powerful slide, perhaps close to the 2020 low ($1,450 - $1,500).
- If we see a situation where miners slide in a meaningful and volatile way while silver doesn’t (it just declines moderately), I plan to – once again – switch from short positions in miners to short positions in silver. At this time, it’s too early to say at what price levels this could take place, and if we get this kind of opportunity at all – perhaps with gold close to $1,600.
- I plan to exit all remaining short positions once gold shows substantial strength relative to the USD Index while the latter is still rallying. This may be the case with gold close to $1,350 - $1,400. I expect silver to fall the hardest in the final part of the move. This moment (when gold performs very strongly against the rallying USD and miners are strong relative to gold after its substantial decline) is likely to be the best entry point for long-term investments, in my view. This can also happen with gold close to $1,375, but at the moment it’s too early to say with certainty.
- As a confirmation for the above, I will use the (upcoming or perhaps we have already seen it?) top in the general stock market as the starting point for the three-month countdown. The reason is that after the 1929 top, gold miners declined for about three months after the general stock market started to slide. We also saw some confirmations of this theory based on the analogy to 2008. All in all, the precious metals sector is likely to bottom about three months after the general stock market tops.
- The above is based on the information available today, and it might change in the following days/weeks.
You will find my general overview of the outlook for gold on the chart below:
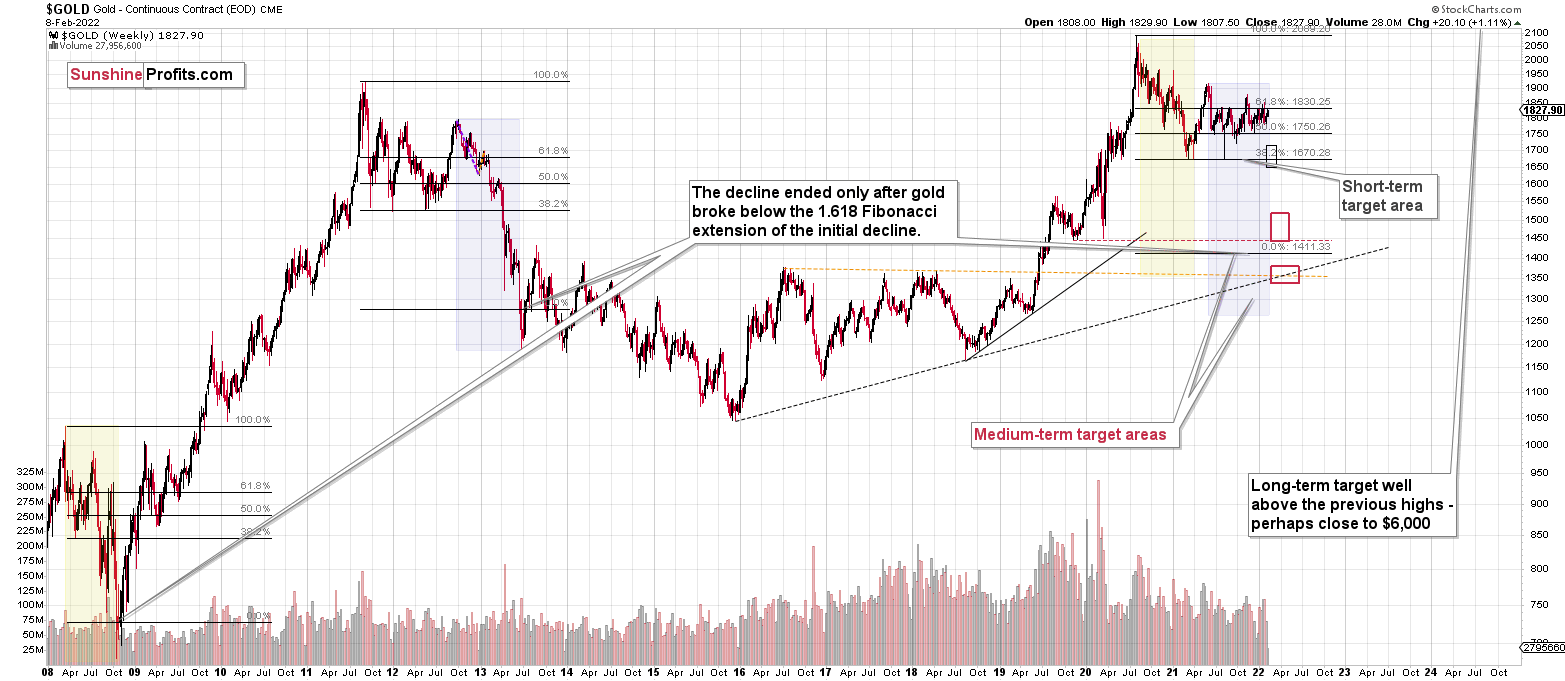
Please note that the above timing details are relatively broad and “for general overview only” – so that you know more or less what I think and how volatile I think the moves are likely to be – on an approximate basis. These time targets are not binding or clear enough for me to think that they should be used for purchasing options, warrants or similar instruments.
Summary
Summing up, it seems to me that the corrective upswing is over, or that we won’t have to wait too long for it to be over. Let’s keep in mind that there are triangle-vertex-based reversals in mid- and late-February, so even if we see more back-and-forth trading soon, it’s likely that the decline resumes later this month.
I continue to think that junior mining stocks are currently likely to decline the most out of all the parts of the precious metals sector.
From the medium-term point of view, the two key long-term factors remain the analogy to 2013 in gold and the broad head and shoulders pattern in the HUI Index. They both suggest much lower prices ahead.
It seems that our profits from the short positions are going to become truly epic in the coming months.
After the sell-off (that takes gold to about $1,350 - $1,500), I expect the precious metals to rally significantly. The final part of the decline might take as little as 1-5 weeks, so it's important to stay alert to any changes.
Most importantly, please stay healthy and safe. We made a lot of money last March and this March, and it seems that we’re about to make much more on the upcoming decline, but you have to be healthy to enjoy the results.
As always, we'll keep you - our subscribers - informed.
To summarize:
Trading capital (supplementary part of the portfolio; our opinion): Full speculative short positions (300% of the full position) in junior mining stocks are justified from the risk to reward point of view with the following binding exit profit-take price levels:
Mining stocks (price levels for the GDXJ ETF): binding profit-take exit price: $34.63; stop-loss: none (the volatility is too big to justify a stop-loss order in case of this particular trade)
Alternatively, if one seeks leverage, we’re providing the binding profit-take levels for the JDST (2x leveraged) and GDXD (3x leveraged – which is not suggested for most traders/investors due to the significant leverage). The binding profit-take level for the JDST: $14.98; stop-loss for the JDST: none (the volatility is too big to justify a SL order in case of this particular trade); binding profit-take level for the GDXD: $25.48; stop-loss for the GDXD: none (the volatility is too big to justify a SL order in case of this particular trade).
For-your-information targets (our opinion; we continue to think that mining stocks are the preferred way of taking advantage of the upcoming price move, but if for whatever reason one wants / has to use silver or gold for this trade, we are providing the details anyway.):
Silver futures downside profit-take exit price: $19.12
SLV profit-take exit price: $17.72
ZSL profit-take exit price: $38.28
Gold futures downside profit-take exit price: $1,683
HGD.TO – alternative (Canadian) inverse 2x leveraged gold stocks ETF – the upside profit-take exit price: $11.79
HZD.TO – alternative (Canadian) inverse 2x leveraged silver ETF – the upside profit-take exit price: $29.48
Long-term capital (core part of the portfolio; our opinion): No positions (in other words: cash
Insurance capital (core part of the portfolio; our opinion): Full position
Whether you already subscribed or not, we encourage you to find out how to make the most of our alerts and read our replies to the most common alert-and-gold-trading-related-questions.
Please note that we describe the situation for the day that the alert is posted in the trading section. In other words, if we are writing about a speculative position, it means that it is up-to-date on the day it was posted. We are also featuring the initial target prices to decide whether keeping a position on a given day is in tune with your approach (some moves are too small for medium-term traders, and some might appear too big for day-traders).
Additionally, you might want to read why our stop-loss orders are usually relatively far from the current price.
Please note that a full position doesn't mean using all of the capital for a given trade. You will find details on our thoughts on gold portfolio structuring in the Key Insights section on our website.
As a reminder - "initial target price" means exactly that - an "initial" one. It's not a price level at which we suggest closing positions. If this becomes the case (like it did in the previous trade), we will refer to these levels as levels of exit orders (exactly as we've done previously). Stop-loss levels, however, are naturally not "initial", but something that, in our opinion, might be entered as an order.
Since it is impossible to synchronize target prices and stop-loss levels for all the ETFs and ETNs with the main markets that we provide these levels for (gold, silver and mining stocks - the GDX ETF), the stop-loss levels and target prices for other ETNs and ETF (among other: UGL, GLL, AGQ, ZSL, NUGT, DUST, JNUG, JDST) are provided as supplementary, and not as "final". This means that if a stop-loss or a target level is reached for any of the "additional instruments" (GLL for instance), but not for the "main instrument" (gold in this case), we will view positions in both gold and GLL as still open and the stop-loss for GLL would have to be moved lower. On the other hand, if gold moves to a stop-loss level but GLL doesn't, then we will view both positions (in gold and GLL) as closed. In other words, since it's not possible to be 100% certain that each related instrument moves to a given level when the underlying instrument does, we can't provide levels that would be binding. The levels that we do provide are our best estimate of the levels that will correspond to the levels in the underlying assets, but it will be the underlying assets that one will need to focus on regarding the signs pointing to closing a given position or keeping it open. We might adjust the levels in the "additional instruments" without adjusting the levels in the "main instruments", which will simply mean that we have improved our estimation of these levels, not that we changed our outlook on the markets. We are already working on a tool that would update these levels daily for the most popular ETFs, ETNs and individual mining stocks.
Our preferred ways to invest in and to trade gold along with the reasoning can be found in the how to buy gold section. Furthermore, our preferred ETFs and ETNs can be found in our Gold & Silver ETF Ranking.
As a reminder, Gold & Silver Trading Alerts are posted before or on each trading day (we usually post them before the opening bell, but we don't promise doing that each day). If there's anything urgent, we will send you an additional small alert before posting the main one.
Thank you.
Przemyslaw Radomski, CFA
Founder, Editor-in-chief

