

Briefly: in our opinion, full (300% of the regular position size) speculative short positions in junior mining stocks are justified from the risk/reward point of view at the moment of publishing this Alert.
Yesterday seems to have been one of those a-lot-happened-but-a-little-changed sessions. For example, looking at the silver price’s jump by $0.60 in just one day – in isolation – might make one think that things are heating up for the precious metals sector, and that it’s about time to back up the truck with silver bars. Gold bars don’t seem to be such a bad idea, either.
However – as always – it’s important not to forget about the forest while looking at a single tree. In the case of the precious metals sector, it means checking the silver price’s “immediate surroundings”. The most important context is provided by the key precious metal – gold. Let’s take a look at both.
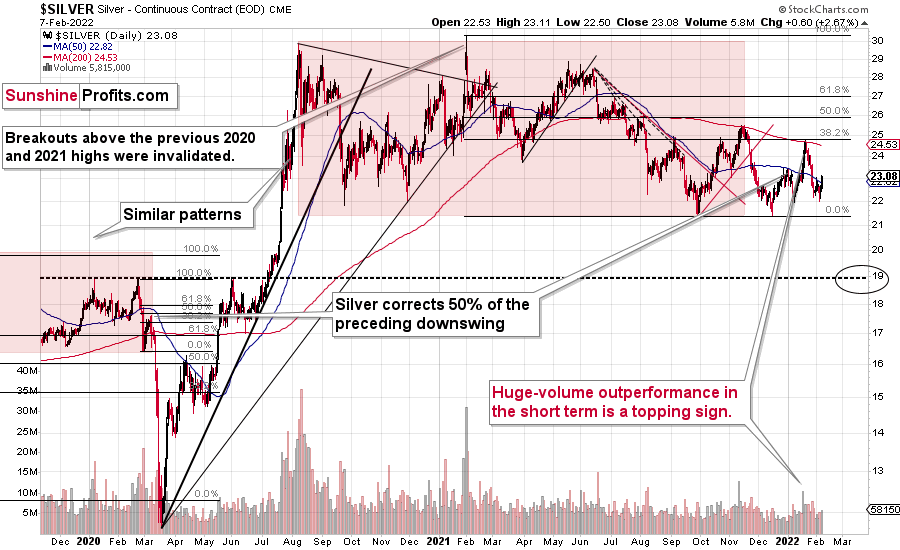
As I discussed above, silver soared by $0.60, which is 2.67%. One could say that it “finally” moved, because that came after several days of back-and-forth movement, when silver largely ignored what was happening in the rest of the precious metals sector.
This – by itself – is the key takeaway from the silver market. Not the volume readings, not the move back above the 50-day moving average (silver is known for fake breakouts, by the way), and not the recent bounce off the previous yearly lows.
Why would silver’s sudden strong performance be that important?
Enter gold.
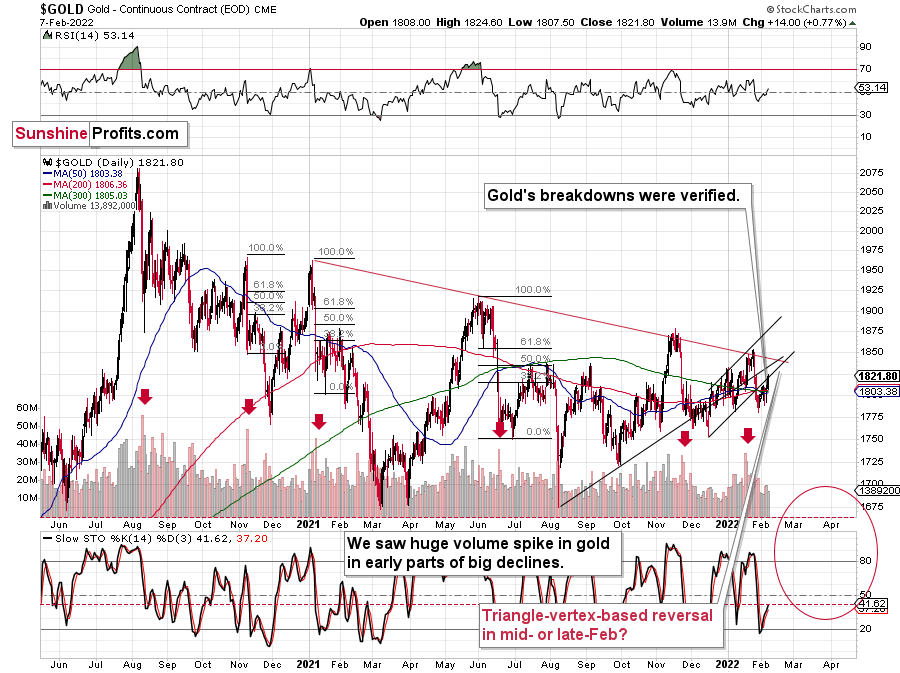
Gold rallied by just 0.77%, and that was one of the 6-day (with 1-day exception) streak of daily rallies. It was not a sudden jump in the gold price.
What does it mean? It means that gold is rallying in a rather normal (corrective) manner, while silver jumped rather suddenly.
In other words, silver is catching up with gold on a short-term basis.
If you’ve been following my analyses for some time (or have been analyzing the precious metals market for a long time), you likely know about the specific characteristics of the precious metals market. Namely, one of the gold trading tips to watch for is silver’s sudden outperformance of gold. That’s when the investing public gets excited, and (due to that) that’s when tops are formed. There are numerous reasons why this happens – one of them is that silver is a much smaller market than gold, and its availability is very limited to many institutions. On the other hand, theories of manipulating the price of silver and its availability make it particularly appealing to individual investors.
I don’t want to go into the validity of all claims related to silver (but I can say that I do expect silver to soar much more than gold in the following years, but not before it falls significantly), but to emphasize that there were tens – if not hundreds – of cases, when silver’s short-term outperformance was a great indication of a price top.
We’ve just seen this indication once again.
Gold is testing its previously broken support/resistance line, and the same goes for mining stocks.
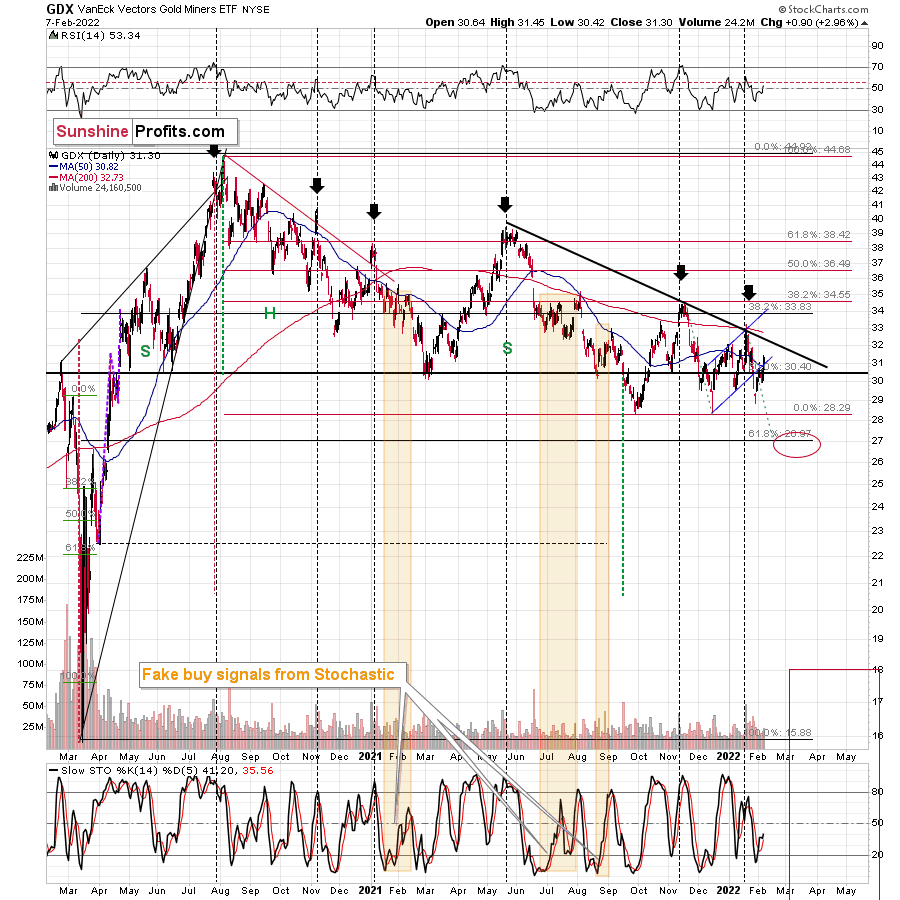
The GDX ETF moved above its 50-day moving average and above its rising blue resistance line. That’s bullish at first sight, but please note that mining stocks have moved a little above their 50-day moving average many times in the past – right before declining. Consequently, I don’t view this “breakout” as bullish. The examples include the early-August 2021, the early-September 2021, the early 2021, October 2020, and the November 2020 tops.
While the GDX ETF moved a bit above its rising blue support line, GDXJ – a proxy for junior mining stocks – didn’t.
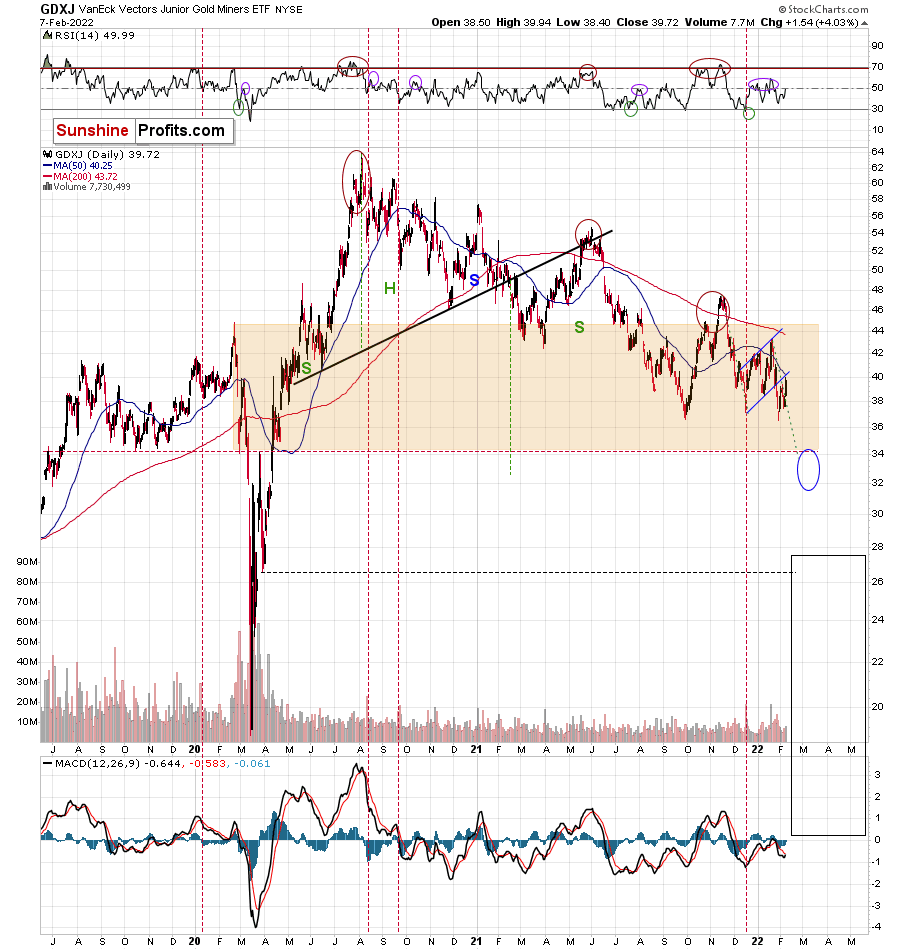
Juniors didn’t move above their 50-day moving average either.
Consequently, I don’t think it’s fair to say that the outlook is any less bearish than it’s been in the previous weeks.
Also, please consider what happened when juniors previously moved to new lows. Back in July 2021, when GDXJ moved below its previous yearly lows, it invalidated this breakdown and rallied more or less as much as GDXJ rallied recently. However, that was a fake rally that ended just below the 50-day moving average. A sharp price drop followed.
History rhymes, and the implications for the current situation are bearish.
Last, but definitely not the least, let’s not forget about the key context for all the above that’s provided by the USD Index.
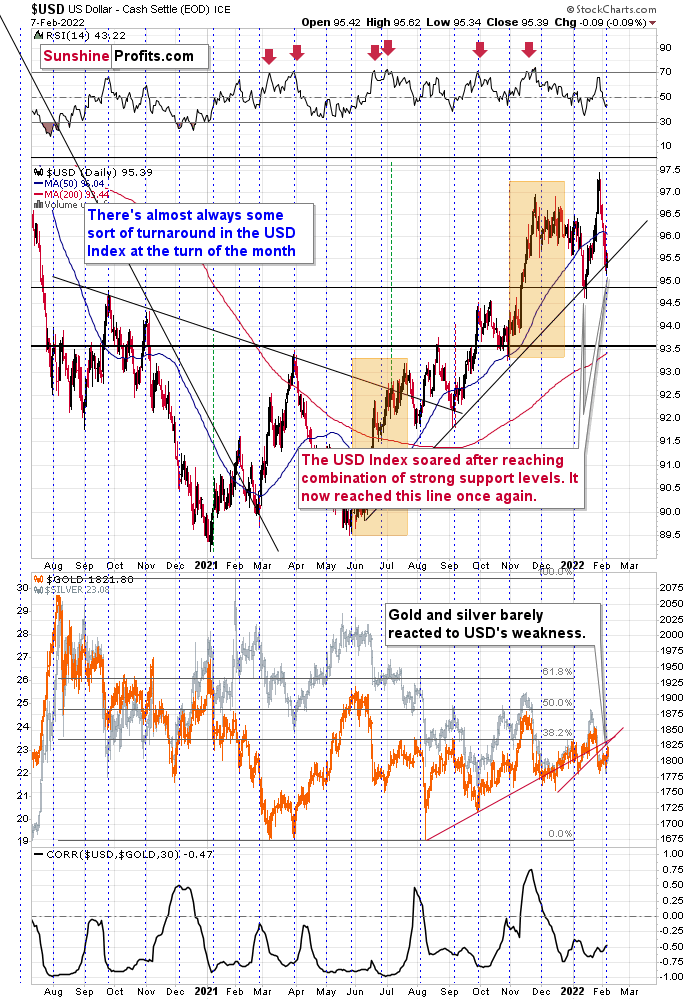
The USD Index remains above its rising medium-term support line, so the trend remains up. Therefore, higher – not lower – USD Index values are to be expected.
Especially given USD’s tendency to turn around at the turn of the month – it seems that we saw a local bottom in early February.
All in all, it seems that they (gold, silver, and mining stocks) are going to decline in the coming weeks and that we won’t have to wait too long for the decline to start.
Having said that, let’s take a look at the markets from a more fundamental point of view.
Some Things Never Change
While the EUR/USD held on to its ECB-induced gains, the bearish fundamental realities confronting the currency pair were confirmed on Feb. 7. To explain, while euro bulls think that the ECB will have a hawkish awakening, I warned on Feb. 4 that the prospect is much more semblance than substance.
I wrote:
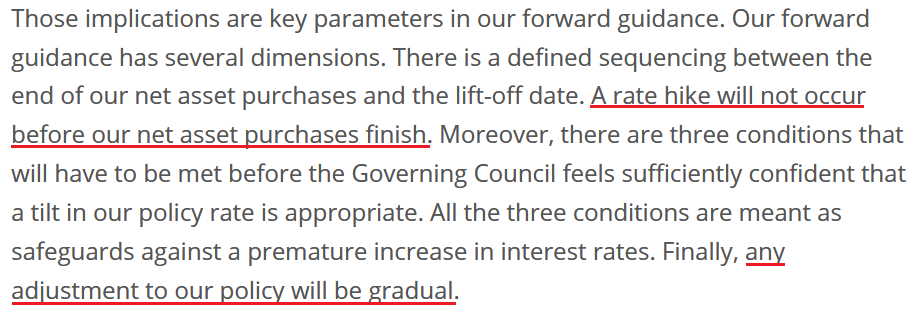
With the ECB’s monetary policy statement reading that “from October onwards, the Governing Council will maintain net asset purchases under the APP at a monthly pace of €20 billion for as long as necessary to reinforce the accommodative impact of its policy rates,” how can the ECB raise interest rates if it still plans to purchase bonds past October 2022? Think about it: Lagarde said that “we will look at net asset purchases first.” And if ending QE is the first step in the process, then the ECB is nowhere near the second step.
To that point, ECB President Christine Lagarde told the European Parliament committee on Feb. 7: “There are no signals that inflation will be persistently and significantly above our target over the medium term, which would require measurable tightening.”
She added: “We have to bear in mind that demand conditions in the Euro Area do not show the same signs of overheating that can be observed in other major economies. This increases the likelihood that the current price pressures will subside before becoming entrenched, enabling us to deliver on our 2% target over the medium term.”
For context, investors have priced in two ECB rate hikes in 2022. However, with the central bank still planning to purchase bonds “from October onwards” and Lagarde saying that rate hikes will only be considered thereafter, short-term sentiment should crumble over the medium term.
Please see below:
 Source: ECB
On the flip side, U.S. inflation is materially outperforming the Eurozone. With the pricing pressures depressing consumer confidence and hurting U.S. President Joe Biden’s re-election prospects, the Fed doesn’t have time for “gradual” adjustments.
Please see below:
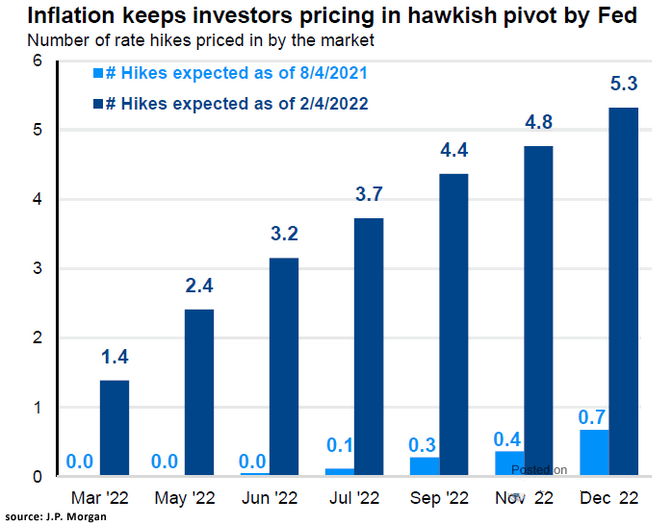
To explain, the light and dark blue bars above track the number of Fed rate hikes priced in during different time periods and 2022 dates. If you analyze the light blue bar furthest to the right, you can see that investors expected less than one rate hike by December 2022 on Aug. 4. However, fast forward six months, and the dark blue bar furthest to the right shows that investors expect more than five rate hikes by December 2022 as of Feb. 4.
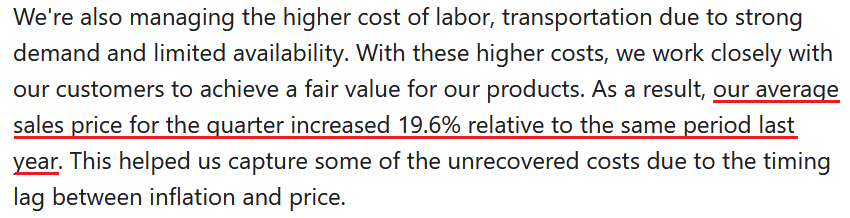
Expanding on inflation, Tyson Foods – the largest food company in the U.S. – released its first-quarter earnings on Feb. 7. CEO Donnie King said during the Q1 conference call:
“In the quarter, our cost of goods sold was up 18% relative to the same period last year. We are seeing higher costs across our supply chain, including higher input costs such as feed and ingredients. We're also managing the higher cost of labor and transportation due to strong demand and limited availability.”
Moreover, CFO Stewart Glendinning added:
“We saw continued inflation across the business, in some instances, up 20% to 30%. Notable examples were labor, grain costs, live cattle and hog costs, and freight costs.”
How is the company responding to the inflationary pressures?
 Source: Tyson Foods/The Motley Fool
Thus, with relative inflation tilted heavily in the U.S.’s direction, the Fed has much less wiggle room to remain dovish. As a result, while I’ve stated this on numerous occasions, the Fed and the ECB are worlds apart. To that point, I highlighted on Feb. 4 how Eurozone core inflation decelerated in January and how the media’s alignment of U.S. and Eurozone inflation dynamics lacks fundamental credibility.
I wrote:
 Source: Eurostat
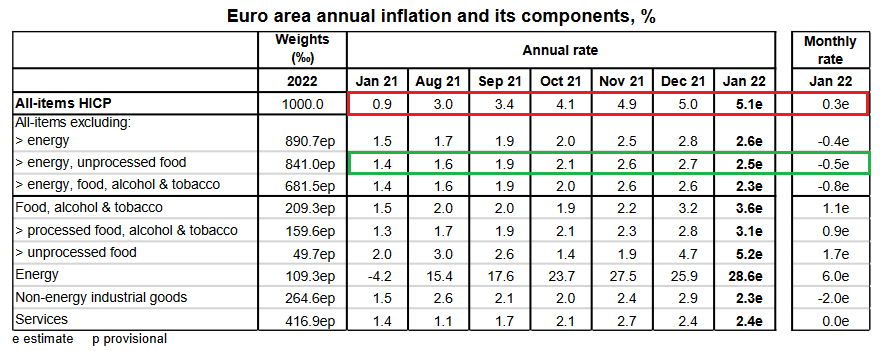
To explain, follow the trajectory of the red rectangle above. As you can see, headline inflation (which includes food and energy) went from a 0.9% year-over-year (YoY) increase in January 2021 to a 5.1% YoY increase in January 2022. Pretty troublesome, huh?
However, if you focus your attention on the green rectangle, you can see that Eurozone core inflation (which excludes food and energy) declined from 2.7% YoY in December 2021 to 2.5% YoY in January 2022. As a result, while investors assume that abnormally high headline inflation will elicit a hawkish response from the ECB, the reality is that oil & gas remains the region’s only problem.
Also noteworthy, the second half of the Fed’s dual mandate is to ensure a healthy U.S. labor market. Whether it’s nonfarm payrolls, nonfarm job openings, or NFIB employment data, it’s not hard to find a job in the U.S. Thus, when combining inflationary pressures with employment outperformance, there is little reason for the Fed to perform a dovish 180.
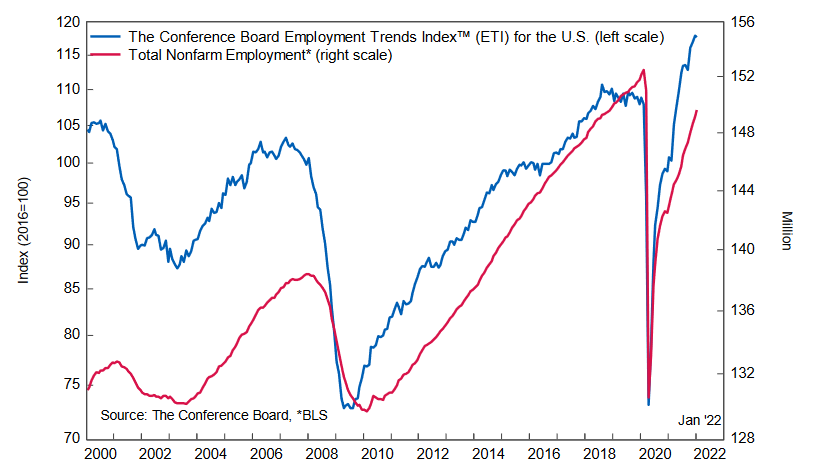
As evidence, The Confidence Board released its Employment Trends Index (ETI) on Feb. 7. While the index declined from 117.94 in December (an upward revision) to 117.64 in January, Frank Steemers, Senior Economist at The Conference Board, said:
“It appears that the Omicron variant did not impact job growth as much as initially feared. Solid job growth is likely to continue over the next months."
Moreover, he added:
“Employers appear to be managing these pandemic disruptions better, even as many workers called in sick or had to quarantine in January. On the other hand, employers are still trying hard to hold on to their workers in a tight labor market. Hiring and retention continues to be a challenge which we do not expect to dissipate anytime soon, especially for employers of manual labor and services.”
For context, “a tight labor market” and “retention” issues only increase wage inflation. However, the important point is that the U.S. labor market remains healthy enough for the Fed to forge ahead with rate hikes.
Please see below:
Finally, while the EUR/USD attempts to defy fundamental gravity, the currency pair’s sell-off in 2021 was likely far from capitulation. As a result, there is plenty of room for speculators to recalibrate their positions.
Please see below:
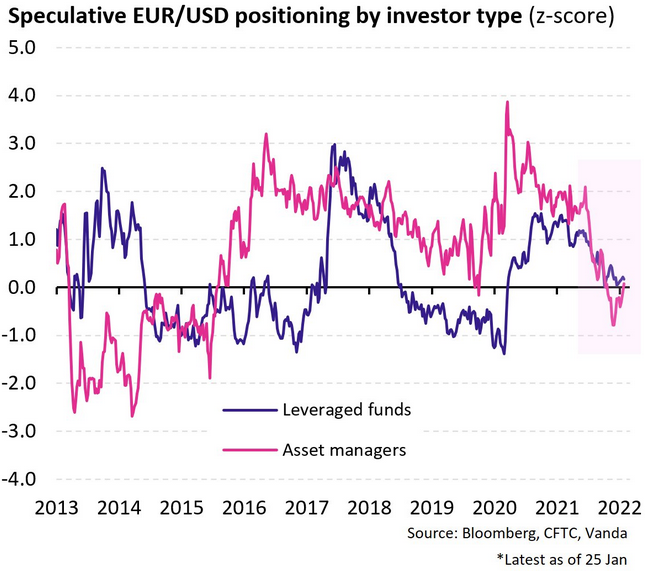
To explain, the blue and purple lines above track the speculative EUR/USD positioning of leveraged funds and asset managers. If you analyze the right side of the chart, you can see that both are roughly flat (near zero). However, if you focus your attention on the blue line, you can see that leveraged funds’ EUR/USD shorts were much higher during the periods from 2014 to 2020 (depicted by the blue line falling below zero).
Similarly, asset managers’ EUR/USD shorts were also much higher from 2013 through 2015 (depicted by the purple line falling below zero). As such, bearish EUR/USD sentiment still has room to increase, and neutral positioning means that a short-squeeze is unlikely to occur.
The bottom line? While the USD Index’s recent weakness may seem troubling, the greenback’s fundamentals remain robust. Despite the short-term sentiment shift, several corrective downswings occurred throughout the USD Index’s bullish journey in 2021. Moreover, with the Fed still well ahead of the ECB, harsh reality should confront the EUR/USD over the medium term.
In conclusion, the PMs rallied on Feb. 7, as commodities were in style once again. However, with the U.S. 10-Year Treasury yield gunning for 2% and the USD Index poised for a recovery, a reversal of fortunes will likely occur over the medium term. As a result, lower lows should confront the PMs over the next few months.
Overview of the Upcoming Part of the Decline
- It seems to me that the corrective upswing is now over, and that gold, silver, and mining stocks are now likely to continue their medium-term decline.
- It seems that the first (bigger) stop for gold will be close to its previous 2021 lows, slightly below $1,700. Then it will likely correct a bit, but it’s unclear if I want to exit or reverse the current short position based on that – it depends on the number and the nature of the bullish indications that we get at that time.
- After the above-mentioned correction, we’re likely to see a powerful slide, perhaps close to the 2020 low ($1,450 - $1,500).
- If we see a situation where miners slide in a meaningful and volatile way while silver doesn’t (it just declines moderately), I plan to – once again – switch from short positions in miners to short positions in silver. At this time, it’s too early to say at what price levels this could take place, and if we get this kind of opportunity at all – perhaps with gold close to $1,600.
- I plan to exit all remaining short positions once gold shows substantial strength relative to the USD Index while the latter is still rallying. This may be the case with gold close to $1,350 - $1,400. I expect silver to fall the hardest in the final part of the move. This moment (when gold performs very strongly against the rallying USD and miners are strong relative to gold after its substantial decline) is likely to be the best entry point for long-term investments, in my view. This can also happen with gold close to $1,375, but at the moment it’s too early to say with certainty.
- As a confirmation for the above, I will use the (upcoming or perhaps we have already seen it?) top in the general stock market as the starting point for the three-month countdown. The reason is that after the 1929 top, gold miners declined for about three months after the general stock market started to slide. We also saw some confirmations of this theory based on the analogy to 2008. All in all, the precious metals sector is likely to bottom about three months after the general stock market tops.
- The above is based on the information available today, and it might change in the following days/weeks.
You will find my general overview of the outlook for gold on the chart below:
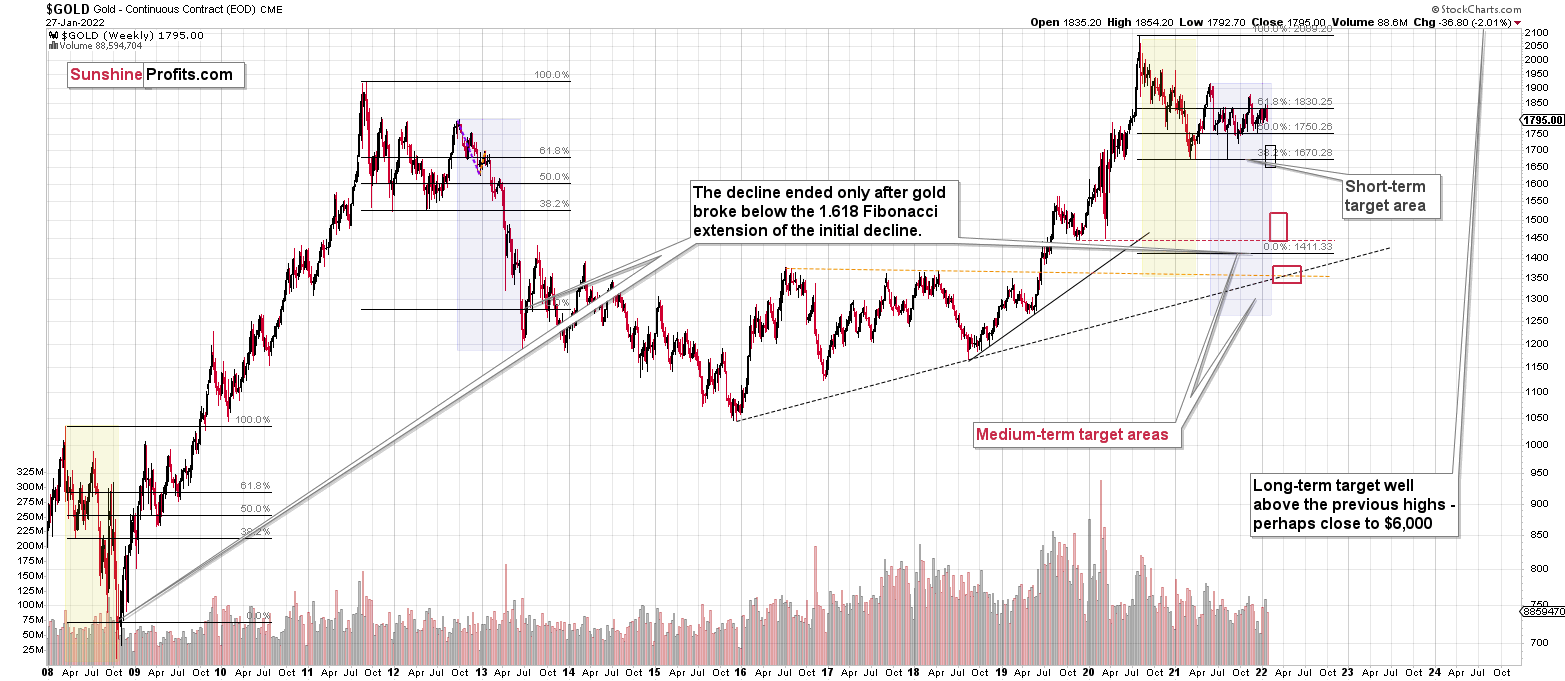
Please note that the above timing details are relatively broad and “for general overview only” – so that you know more or less what I think and how volatile I think the moves are likely to be – on an approximate basis. These time targets are not binding or clear enough for me to think that they should be used for purchasing options, warrants or similar instruments.
Letters to the Editor
Q: It appears to me that GDX and GDXJ look poised to test the 200-day moving averages based on what I see - above 20 day SMA, positive 20/50 cross nearing, and a positive macd cross due to occur shortly. RSI and Slow Stochastics also have room to run to the upside. Are you seeing the same or do you believe a breakdown will occur in the very short term again?
Thank you again for your analysis.
A: Thanks for the question! In the main part of today’s analysis, I commented on the 50-day moving average. As far as Slow Stochastic indicator is concerned, I marked with orange rectangles the situations when it provided fake buy signals. There were also true buy signals, but overall, the efficiency of this indication is low, so it’s not concerning in my view. The RSI is close to the middle of its trading range in both GDX and GDXJ, so it has room to move both: up and down. The medium-term trend in GDX and GDXJ is down, so the odds are that this tells us that they are ready to decline once again.
Summary
Summing up, it seems to me that the corrective upswing is over, or that we won’t have to wait too long for it to be over. Let’s keep in mind that there are triangle-vertex-based reversals in mid- and late-February, so even if we see more back-and-forth trading soon, it’s likely that the decline resumes later this month.
I continue to think that junior mining stocks are currently likely to decline the most out of all the parts of the precious metals sector.
From the medium-term point of view, the two key long-term factors remain the analogy to 2013 in gold and the broad head and shoulders pattern in the HUI Index. They both suggest much lower prices ahead.
It seems that our profits from the short positions are going to become truly epic in the coming months.
After the sell-off (that takes gold to about $1,350 - $1,500), I expect the precious metals to rally significantly. The final part of the decline might take as little as 1-5 weeks, so it's important to stay alert to any changes.
Most importantly, please stay healthy and safe. We made a lot of money last March and this March, and it seems that we’re about to make much more on the upcoming decline, but you have to be healthy to enjoy the results.
As always, we'll keep you - our subscribers - informed.
To summarize:
Trading capital (supplementary part of the portfolio; our opinion): Full speculative short positions (300% of the full position) in junior mining stocks are justified from the risk to reward point of view with the following binding exit profit-take price levels:
Mining stocks (price levels for the GDXJ ETF): binding profit-take exit price: $34.63; stop-loss: none (the volatility is too big to justify a stop-loss order in case of this particular trade)
Alternatively, if one seeks leverage, we’re providing the binding profit-take levels for the JDST (2x leveraged) and GDXD (3x leveraged – which is not suggested for most traders/investors due to the significant leverage). The binding profit-take level for the JDST: $14.98; stop-loss for the JDST: none (the volatility is too big to justify a SL order in case of this particular trade); binding profit-take level for the GDXD: $25.48; stop-loss for the GDXD: none (the volatility is too big to justify a SL order in case of this particular trade).
For-your-information targets (our opinion; we continue to think that mining stocks are the preferred way of taking advantage of the upcoming price move, but if for whatever reason one wants / has to use silver or gold for this trade, we are providing the details anyway.):
Silver futures downside profit-take exit price: $19.12
SLV profit-take exit price: $17.72
ZSL profit-take exit price: $38.28
Gold futures downside profit-take exit price: $1,683
HGD.TO – alternative (Canadian) inverse 2x leveraged gold stocks ETF – the upside profit-take exit price: $11.79
HZD.TO – alternative (Canadian) inverse 2x leveraged silver ETF – the upside profit-take exit price: $29.48
Long-term capital (core part of the portfolio; our opinion): No positions (in other words: cash
Insurance capital (core part of the portfolio; our opinion): Full position
Whether you already subscribed or not, we encourage you to find out how to make the most of our alerts and read our replies to the most common alert-and-gold-trading-related-questions.
Please note that we describe the situation for the day that the alert is posted in the trading section. In other words, if we are writing about a speculative position, it means that it is up-to-date on the day it was posted. We are also featuring the initial target prices to decide whether keeping a position on a given day is in tune with your approach (some moves are too small for medium-term traders, and some might appear too big for day-traders).
Additionally, you might want to read why our stop-loss orders are usually relatively far from the current price.
Please note that a full position doesn't mean using all of the capital for a given trade. You will find details on our thoughts on gold portfolio structuring in the Key Insights section on our website.
As a reminder - "initial target price" means exactly that - an "initial" one. It's not a price level at which we suggest closing positions. If this becomes the case (like it did in the previous trade), we will refer to these levels as levels of exit orders (exactly as we've done previously). Stop-loss levels, however, are naturally not "initial", but something that, in our opinion, might be entered as an order.
Since it is impossible to synchronize target prices and stop-loss levels for all the ETFs and ETNs with the main markets that we provide these levels for (gold, silver and mining stocks - the GDX ETF), the stop-loss levels and target prices for other ETNs and ETF (among other: UGL, GLL, AGQ, ZSL, NUGT, DUST, JNUG, JDST) are provided as supplementary, and not as "final". This means that if a stop-loss or a target level is reached for any of the "additional instruments" (GLL for instance), but not for the "main instrument" (gold in this case), we will view positions in both gold and GLL as still open and the stop-loss for GLL would have to be moved lower. On the other hand, if gold moves to a stop-loss level but GLL doesn't, then we will view both positions (in gold and GLL) as closed. In other words, since it's not possible to be 100% certain that each related instrument moves to a given level when the underlying instrument does, we can't provide levels that would be binding. The levels that we do provide are our best estimate of the levels that will correspond to the levels in the underlying assets, but it will be the underlying assets that one will need to focus on regarding the signs pointing to closing a given position or keeping it open. We might adjust the levels in the "additional instruments" without adjusting the levels in the "main instruments", which will simply mean that we have improved our estimation of these levels, not that we changed our outlook on the markets. We are already working on a tool that would update these levels daily for the most popular ETFs, ETNs and individual mining stocks.
Our preferred ways to invest in and to trade gold along with the reasoning can be found in the how to buy gold section. Furthermore, our preferred ETFs and ETNs can be found in our Gold & Silver ETF Ranking.
As a reminder, Gold & Silver Trading Alerts are posted before or on each trading day (we usually post them before the opening bell, but we don't promise doing that each day). If there's anything urgent, we will send you an additional small alert before posting the main one.
Thank you.
Przemyslaw Radomski, CFA
Founder, Editor-in-chief

