
tools spotlight

-
Even Through Geopolitical Smoke, Gold’s Medium-Term Seems Clear
February 17, 2022, 9:01 AMSo, Russia withdrew some of its troops, but in reality it might have not done so. One source says one thing, the other says something different. It doesn’t matter that much, because regardless of whether the troops have moved away from the border with Ukraine or not, it’s likely to happen anyway. Whatever we are seeing and reading now is probably smoke and mirrors. It’s unclear to me what the purpose is, as there are quite a few candidates.
Perhaps Biden is seeing his support wane and wants to be “the successful man of action, defender of Ukraine” – knowing that there was no real threat (come on, the reports that he gets from the U.S. intelligence might be something completely different than what is presented to the public), it’s very easy to claim “success”. Almost as easy as if someone introduced vaccines to an illness when the population was generally achieving group immunity, even though it was not apparent based on official statistics (I’m not referring to any specific illness or vaccines here; perhaps something like that happened recently, perhaps it didn’t; we won’t get official documentation for decades, probably…). This seems the most likely reason, in my view, but there could be others, connected with market manipulation.
It’s rather obvious that with the Ukraine-Russia war looming and WW3-possibility anxiety, gold and oil would soar. Those who knew in advance that the tensions would get so much attention could have easily positioned themselves in those markets. Knowing when the tensions subside (aren’t all the reports that get the spotlight coming from the U.S.? Or almost all of them?) presents another opportunity. If you had huge long positions in both of the above (and nice profits, in particular in the case of crude oil), and wanted to exit them without triggering a sharp slide, you could easily do so provided there was strong, “reasonable” buying power, ideally in the investment public, so spread across multiple buyers. All that’s needed for this to work is a good reason for an investment the public would like to buy. That’s where the supposed invasion scenario fits in.
What about today’s rally in gold, along with the extra narrative about Putin not retreating his forces?
It’s quite a nice (by that I mean “effective”) way for U.S. intelligence to save face after a failed prediction of an invasion that just didn’t happen yesterday. Providing a deadline works if one wants to create a sense of urgency and trigger action – and it worked. We’re probably seeing the “milking the very last of this opportunity” now. There’s a limited number of things (that would work) that can now be done in order to keep people scared of the conflict if it’s simply not happening and things are getting back to normal. What we’re seeing now are likely the final attempts to both: get the most of the situation, and provide a public relations cover-up so that it all doesn’t look like market/public manipulation.
I may be too skeptical about all this, but I’ve seen these kinds of techniques used so many times in many areas, mostly in marketing and sales, but also when analyzing history books (how the masses were manipulated and so on), that I really take them at their face value. Of course, it’s just my opinion, and I might be wrong. Also, I’m not saying that the U.S. is “the bad guy” here – I’m saying that politicians (from all countries) and various “groups of interest” might want to influence people, events, and narratives to fit their agendas, and it looks like something like that is taking place.
Let’s check what did the above change on the charts.
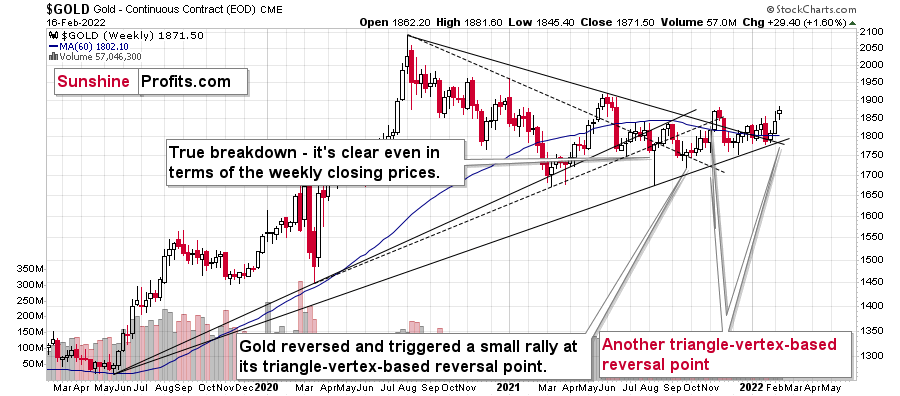
Gold’s weekly chart remains generally unchanged. Gold is visibly up this week, but since this rally is right at its important triangle-vertex-based reversal, its implications are bearish, not bullish.
Interestingly, the above information about the reversal was known in advance, just the exact direction was unclear. Well, it is clear now.
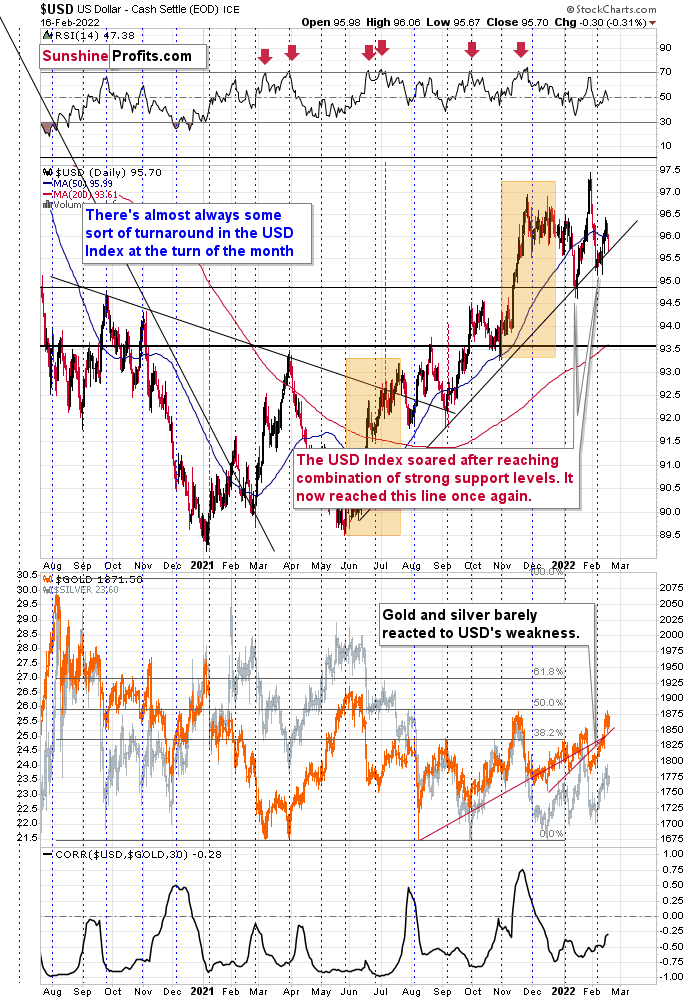
The USD Index is at its medium-term support line. All previous moves to / slightly below it were then followed by rallies, sometimes really big rallies, so we’re likely to see something like that once again.
Such a rally would be the prefect trigger for the triangle-vertex-based reversal in gold and the following slide.
The short-term charts for GLD and GDX are not bullish either, despite the very short-term upswing.
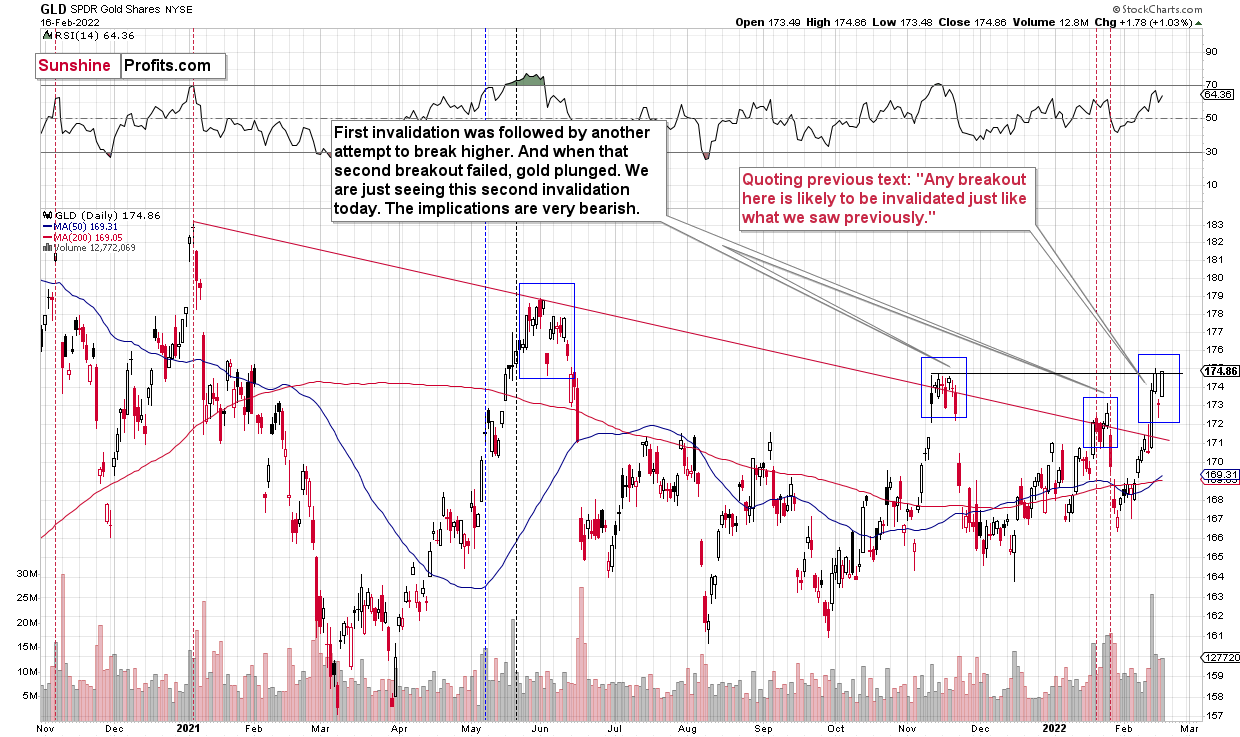
Please note the blue rectangles. It’s common for gold to decline initially, then move back up, and start a massive slide only after the second top. Interestingly, sometimes the second short-term top is below the previous top (June 2021), sometimes it’s close to the previous top (November 2021), and sometimes it’s above the initial top (January 2022).
For now, we see the second top being formed at the level of the previous top, but given today’s pre-market upswing in gold (about $20), GLD is likely to move to new yearly highs before reversing and triggering another powerful slide, just like it happened previously.
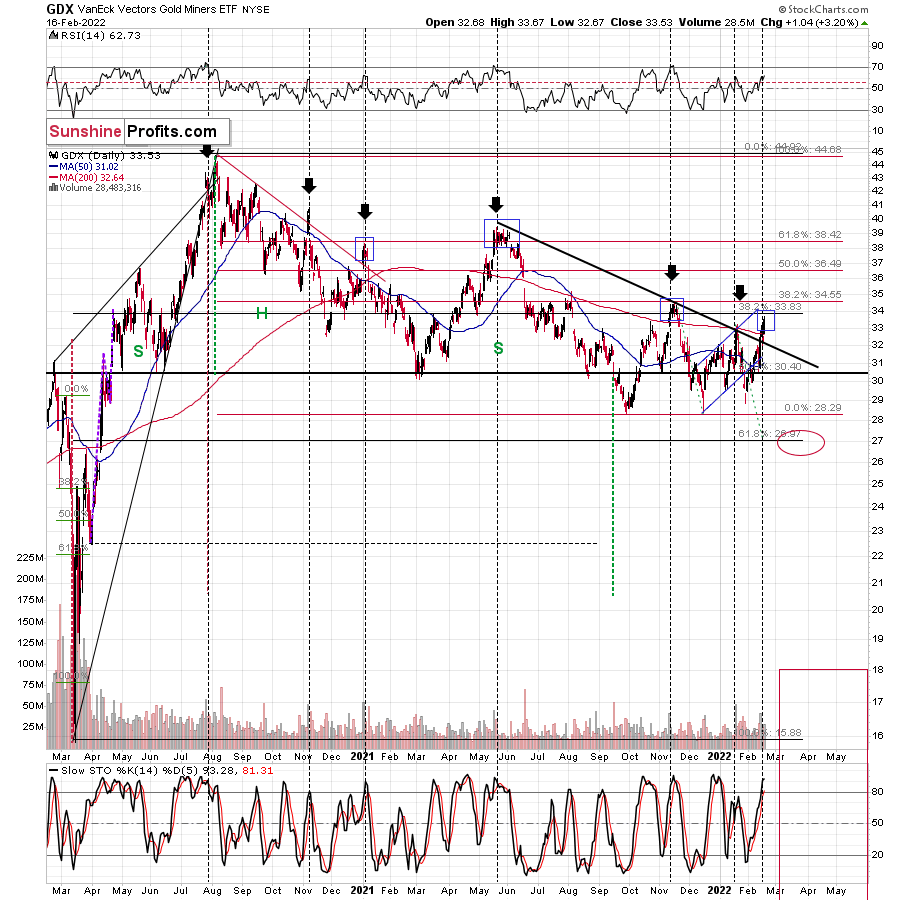
I marked similar situations in the GDX ETF as well, and I also used blue rectangles for them. Broad short-term tops are rather common.
Strong volume accompanied the early parts of the broader short-term tops that I marked. So, the big volume that we saw recently confirms the above.
Yes, the back-and-forth movement that we’ve been seeing is extremely discouraging and boring. No question about it. It’s more boring than the consolidation that we saw in 2013 as the price moves are narrower. However, as the sun always shines after a storm or cloudy days, a much bigger move will stem from this prolonged consolidation.
The bigger the base, the stronger the move.
This huge, boring back-and-forth trading is a giant base – likely for a giant move.
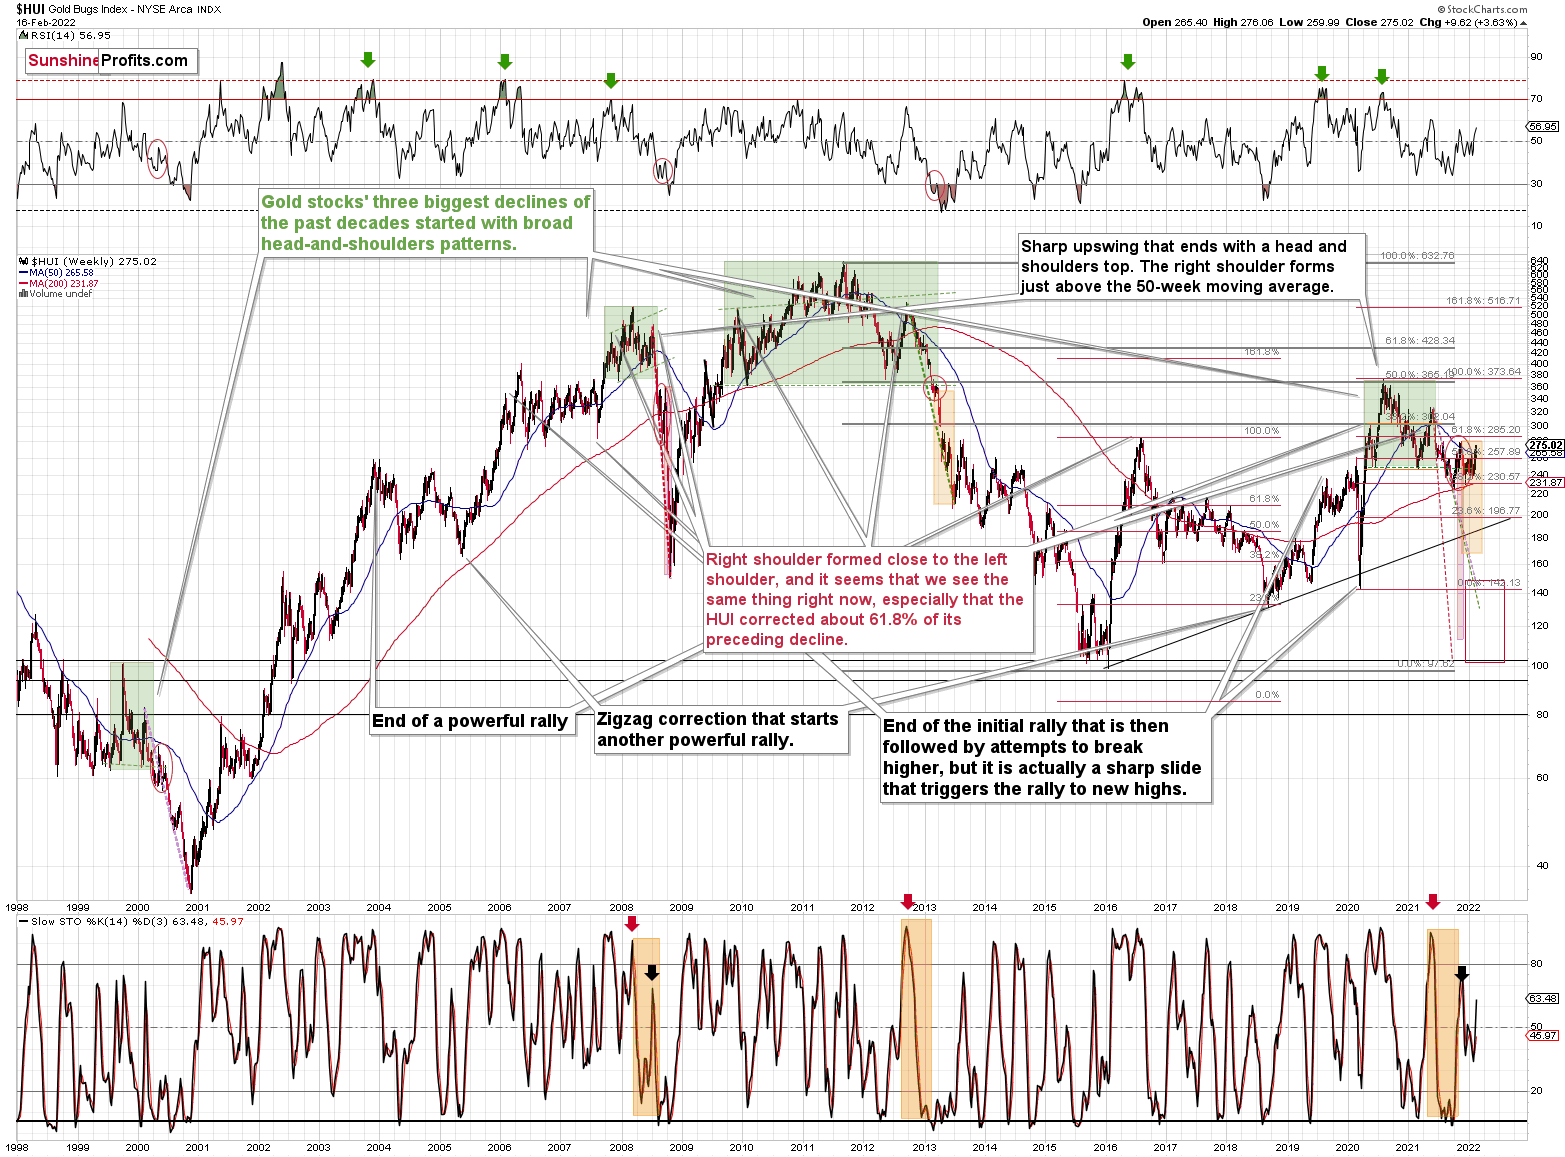
Based on the past patterns (history does rhyme, after all!), we’re about to see something huge. Namely, a profound decline is likely to follow patterns that are similar to what we saw in 2013, 2008, and – to a lesser extent – in 2000.
In my opinion, the wait will be well worth it – at least for those positioned to make the most of this upcoming slide (could be through a short position, but could also be through simply staying away from long positions and getting into them close to the bottom).
Thank you for reading our free analysis today. Please note that the above is just a small fraction of the full analyses that our subscribers enjoy on a regular basis. They include multiple premium details such as the interim targets for gold and mining stocks that could be reached in the next few weeks. We invite you to subscribe now and read today’s issue right away.
Sincerely,
Przemyslaw Radomski, CFA
Founder, Editor-in-chief -
Russia Claims “Drills” Over. Can Gold Resume Bearish Path?
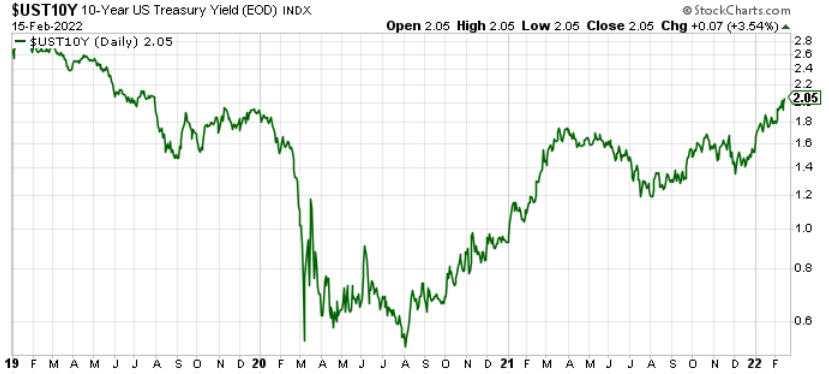
February 16, 2022, 8:39 AMWhile the Russia-Ukraine conflict remains a wild card as the news fluctuates, the hype died down on Feb. 15. For example, with Russia calling some of its troops back after completing their “drills,” the geopolitical risks fizzled. With that, the PMs’ rallies fizzled. Moreover, as cooler heads prevailed, the U.S. 10-Year Treasury yield closed at a new 2022 high.
Please see below:
In addition, with bond market liquidity stuck in a downtrend, the rapid moves in interest rates that we witnessed in 2022 could cause more fundamental problems for the precious metals. For example, Bloomberg’s U.S. Government Securities Liquidity Index – which gauges bond yields’ deviations from a fair-value model – is at levels that coincide with large daily swings. Moreover, market breadth – which is calculated by analyzing the size of bids and offers for U.S. Treasuries – has also fallen materially.
Please see below:
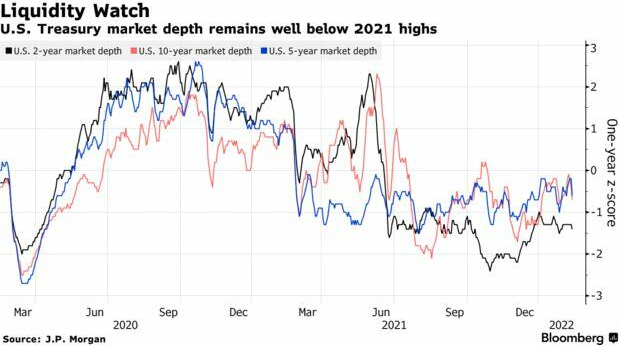
To explain, the black, blue, and pink lines above track the market breadth for the U.S. 2-Year, 5-Year, and 10-Year Treasuries. If you analyze the downtrend, you can see that the size of bids and offers has shrunk over the last several months. As a result, when sell orders hit the market and buyers are nowhere to be found, the prices of U.S. Treasuries plummet and yields increase. Thus, if the activity continues when surging inflation has investors extremely skittish, more mini taper tantrums could erupt in the coming weeks.
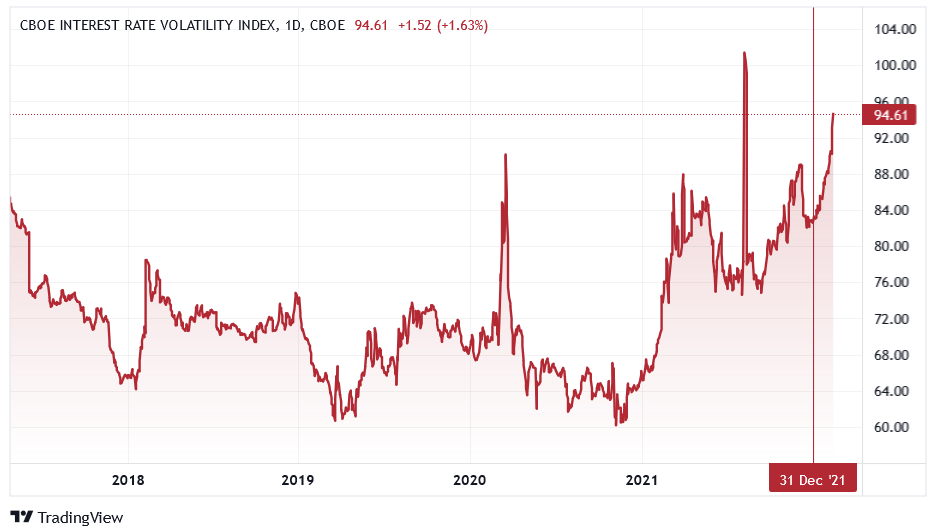
As further evidence, the Cboe Interest Rate Volatility Index (SRVIX) – which uses options on swaps to gauge risk – has rallied hard in 2022. Moreover, the index has surpassed its 2020 highs and only remains below the spike we witnessed in August 2021. As a result, there is plenty of anxiety in the bond market right now.
Please see below:
Headlining the recent uncertainty, the Fed’s next monetary policy meeting is only one month away (Mar. 15/16). Moreover, the date also coincides with a new release of the Fed’s Summary of Economic Projections (SEP). As a result, with inflation’s inability to settle down rattling the Fed and investors, hawkish policy is needed to calm the pricing pressures.
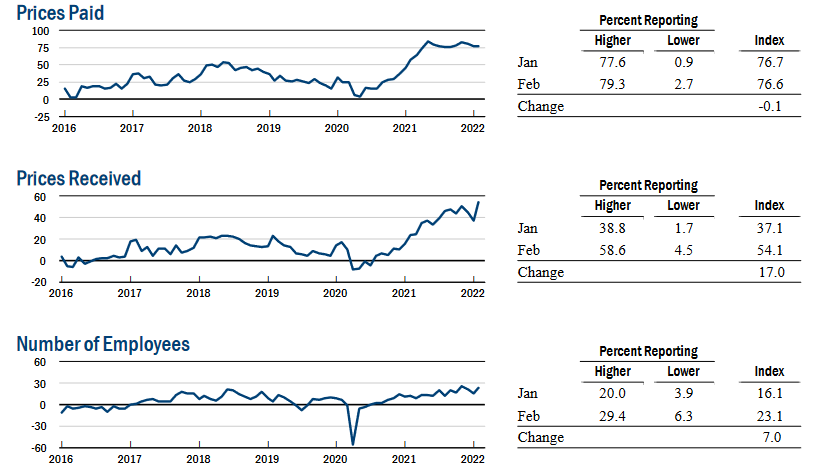
To that point, the New York Fed released its Empire State Manufacturing Index on Feb. 15. While the headline index increased from -0.70 in January to 3.10 in February, the report revealed:
“The index for number of employees climbed seven points to 23.1, indicating solid gains in employment levels, and the average workweek index held steady at 10.9. The prices paid index was little changed at 76.6, while the prices received index rose a steep seventeen points to a record high of 54.1, signaling ongoing substantial increases in both input prices and selling prices.”
As a result, the Fed’s dual mandate (employment and inflation) has been achieved in New York State, and the data supports a hawkish response from the central bank in March.
Please see below:
 Source: New York Fed
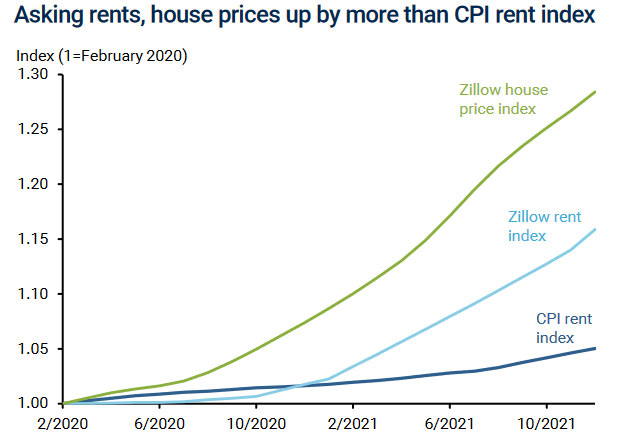
Likewise, the San Francisco Fed released an Economic Letter on rent inflation on Feb. 14. The report revealed:
“Current CPI rent inflation is positively correlated with 1-year lagged Zillow house price inflation, indicating that MSAs with higher Zillow house price inflation in one year are more likely to have higher rent inflation over the following year.”
As a result, the researchers concluded:
“The extraordinarily large increases in two leading indicators of future rent inflation – asking rent inflation and house price inflation – point to significant upside risks to the overall inflation outlook. The potential increases are particularly significant for CPI inflation, which places a larger weight on shelter costs. Still, the potential additions to PCE inflation of about 0.5pp for both 2022 and 2023 are important to consider in light of the Federal Reserve’s 2% inflation target.”
Please see below:
 Source: San Francisco Fed
To explain, the green and light blue lines above track Zillow’s house price and rent indexes, while the dark blue line above tracks the CPI rent index. As you can see, Zillow’s data has materially outperformed the U.S. government’s data since the pandemic struck. As a result, with historical Zillow data often predicting future government data, rent inflation is likely far from its peak, and the headline CPI should remain elevated, putting more pressure on the Fed.
To that point, while the “transitory” camp initially blamed used cars, airfares and hotel accommodations for the inflationary surge, the reality is that pricing pressures have broadened in recent months. Along the way, the percentage of CPI constituents tracking above the Fed’s 2% annual target continues to expand.
Please see below:
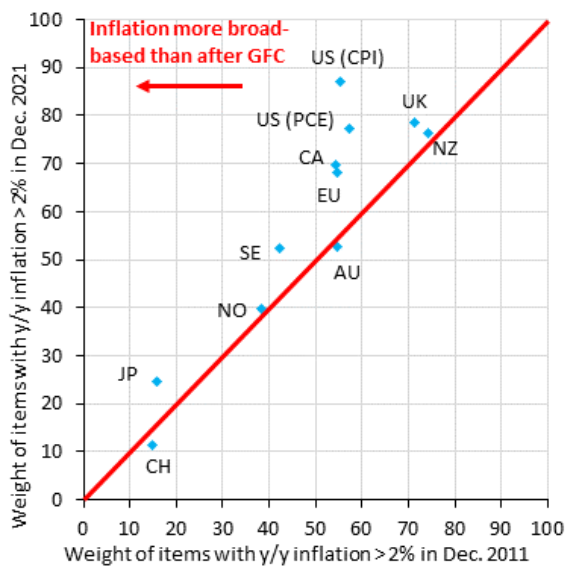 Source: Institute of International Finance (IIF)/Robin Brooks
To explain, the blue diamonds above track the regions and the percentage of their components tracking inflation above 2%. For context, the post-global financial crisis (GFC) data is plotted on the x-axis, the current data is plotted on the y-axis, and the upward-sloping red line depicts the linear trend.
If you analyze the blue diamond at the top half of the middle of the chart labeled “US (CPI),” you can see that nearly 90% of CPI components are tracking above 2%. Conversely, in December 2011 (post-GFC), the figure was closer to 55%. As a result, not only is U.S. inflation outperforming the rest of the world, but it’s also outperforming the precedent set following the GFC. Thus, the Fed has little reason not to raise interest rates in March.
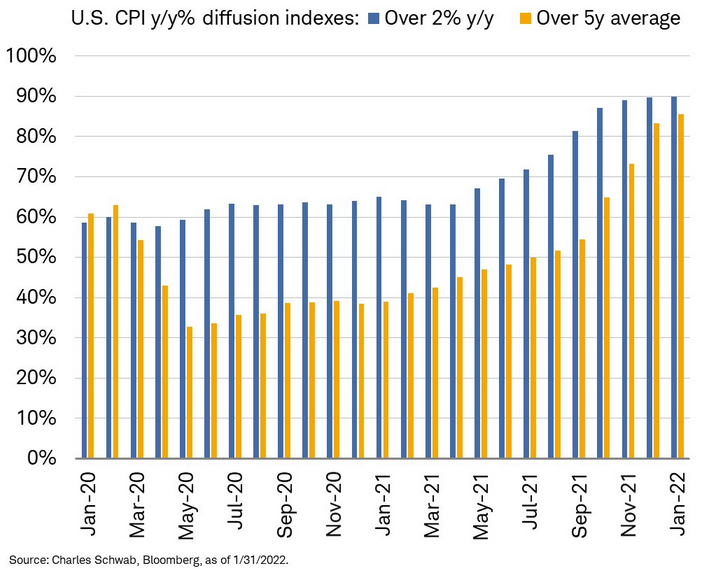
Also noteworthy, Charles Schwab presents the same data for the U.S. chronologically. If you analyze the chart below, you can see that the percentage of components that are tracking inflation above 2% (the blue bars) and the percentage of components above their five-year averages (the orange bars) have been increasing for the last several months. Moreover, with both metrics at or approaching 90% in January 2022, it’s a far cry from the roughly 60% we witnessed in January 2020.
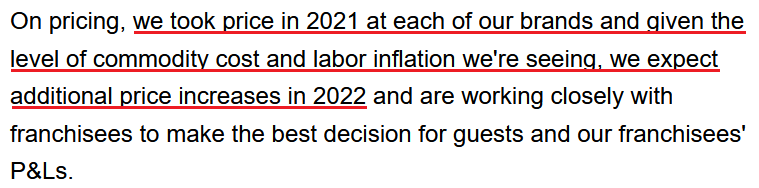
Finally, while the data above presents a bird’s eye view of the inflation story, the merry-go-round continues to circulate on the ground. For example, Restaurant Brands International (RBI) released its fourth-quarter earnings on Feb. 15. For context, RBI is the parent company of Burger King, Tim Hortons, Popeyes, and Firehouse Subs. Despite beating estimates on both the top and bottom lines, CFO Matthew Dunnigan said during the conference call:
“Similar to what others across the industry have noted, we saw a significant increase in commodity volatility as we progress through the quarter, leading to elevated levels of inflation that have similar pass-through effects on both our revenue and expense lines.”
Moreover, CEO Jose Cil added:
“In Canada as well as in the U.S., we've tended to price in line with CPI, and CPI in Canada is – has been probably in '21, about half or even slightly below half of what we've seen in the U.S.”
However, with Cil not waiting for the Fed to solve the problem, he said:
 Source: RBI/Seeking Alpha
The bottom line? While the Russia-Ukraine conflict will likely weigh on markets until there is a definitive resolution, the PMs’ fundamental outlooks continue to worsen as the “peak concern” seems to be behind us. With inflation and employment holding firm, there is little stopping the Fed from raising interest rates. With U.S. Treasury nominal and real yields poised to move higher, history shows that the PMs often move in the opposite direction. As a result, while they remain uplifted, for the time being, sentiment should shift over the medium term.
In conclusion, the PMs declined on Feb. 15, as they gave back some of their geopolitical-risk-induced gains. While the USD Index also suffered, the fundamentals hurting the PMs (a hawkish Fed and higher U.S. Treasury yields) support a stronger greenback. As such, once the Russia-Ukraine conflict is no longer the main driver of the financial markets, the PMs and the USD Index will likely go their separate ways.
Thank you for reading our free analysis today. Please note that the above is just a small fraction of the full analyses that our subscribers enjoy on a regular basis. They include multiple premium details such as the interim targets for gold and mining stocks that could be reached in the next few weeks. We invite you to subscribe now and read today’s issue right away.
Sincerely,
Przemyslaw Radomski, CFA
Founder, Editor-in-chief -
Tension-Blinded Gold Ignores the Real Threats: USDX and Fed
February 15, 2022, 9:34 AMGold continues to benefit from the market turmoil and has apparently forgotten about medium-term problems. Meanwhile, the rising USD and a hawkish Fed await confrontation.
With financial markets whipsawing after every Russia-Ukraine headline, volatility has risen materially in recent days. With whispers of a Russian invasion on Feb. 16 (which I doubt will be realized), the game of hot potato has uplifted the precious metals market.
However, as I noted on Feb. 14, while the developments are short-term bullish, the PMs’ medium-term fundamentals continue to decelerate. For example, while the general stock market remains concerned about a Russian invasion, U.S. Treasury yields rallied on Feb. 14. With risk-off sentiment often born in the bond market, the safety trade benefiting the PMs didn’t materialize in U.S. Treasuries. As a result, bond traders aren’t demonstrating the same level of fear.
Please see below:
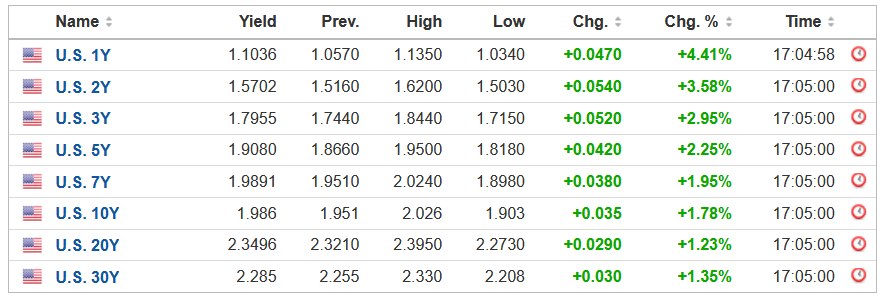 Source: Investing.com
Furthermore, while the potential conflict garners all of the attention, the fundamental issues that upended the PMs in 2021 remain unresolved. For example, with inflation surging, St. Louis Fed President James Bullard said on Feb. 14 that “the last four [Consumer Price Index] reports taken in tandem have indicated that inflation is broadening and possibly accelerating in the U.S. economy.”
“The inflation that we’re seeing is very bad for low- and moderate-income households,” he said. “People are unhappy, consumer confidence is declining. This is not a good situation. We have to reassure people that we’re going to defend our inflation target and we’re going to get back to 2%.”
As a result, Bullard wants a 50 basis point rate hike in March, and four rate hikes by July.
Please see below:
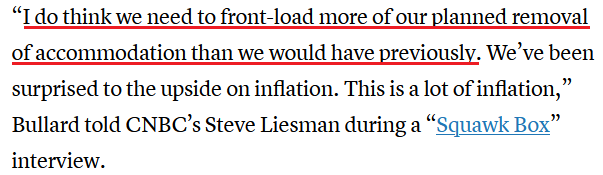 Source: CNBC
Likewise, while San Francisco Fed President Mary Daly is much less hawkish than Bullard, she also supports a rate hike in March.
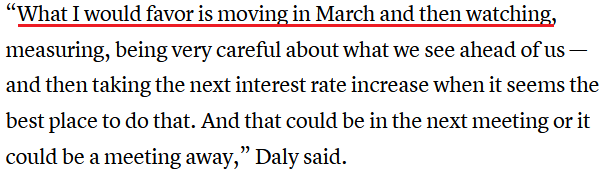 Source: CNBC
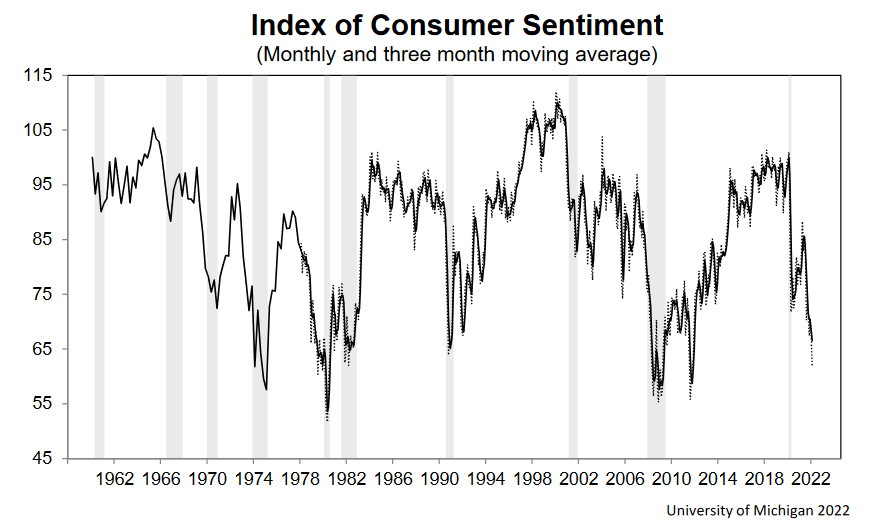
As a result, while the PMs can hide behind the Russia-Ukraine conflict in the short term, their medium-term fundamental outlooks are profoundly bearish. As mentioned, Bullard highlighted inflation’s impact on consumer confidence, and for a good reason. With the University of Michigan releasing its Consumer Sentiment Index on Feb. 11, the report revealed that Americans’ optimism sank to “its worst level in a decade, falling a stunning 8.2% from last month and 19.7% from last February.”
Chief Economist, Richard Curtin said:
“The recent declines have been driven by weakening personal financial prospects, largely due to rising inflation, less confidence in the government's economic policies, and the least favorable long term economic outlook in a decade.”
“The impact of higher inflation on personal finances was spontaneously cited by one-third of all consumers, with nearly half of all consumers expecting declines in their inflation adjusted incomes during the year ahead.”
Please see below:
To that point, I’ve highlighted on numerous occasions that U.S. President Joe Biden’s re-election prospects often move inversely to inflation. With the dynamic still on full display, immediate action is needed to maintain his political survival.
Please see below:
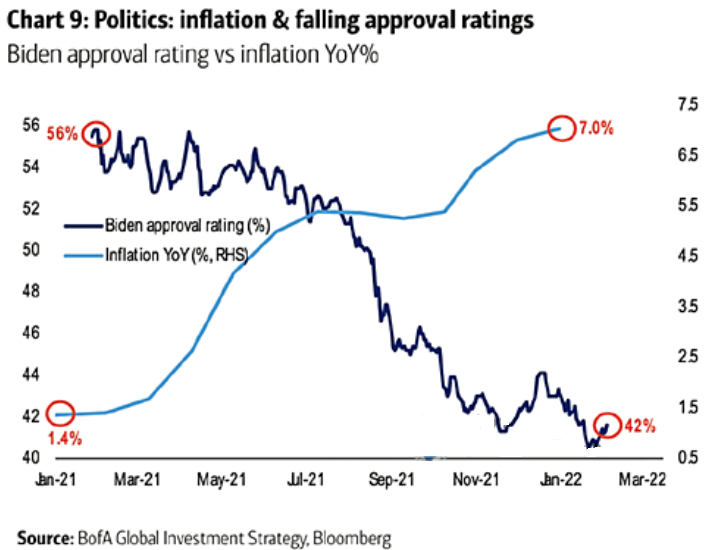
To explain, the light blue line above tracks the year-over-year (YoY) percentage change in inflation, while the dark blue line above tracks Biden’s approval rating. If you analyze the right side of the chart, you can see that the U.S. President remains in a highly perilous position. Moreover, with U.S. midterm elections scheduled for Nov. 8, the Democrats can’t wait nine to 12 months for inflation to calm down. As a result, there is a lot at stake politically in the coming months.
As further evidence, as inflation reduces real incomes and depresses consumer confidence, the Misery Index also hovers near crisis levels.
Please see below:
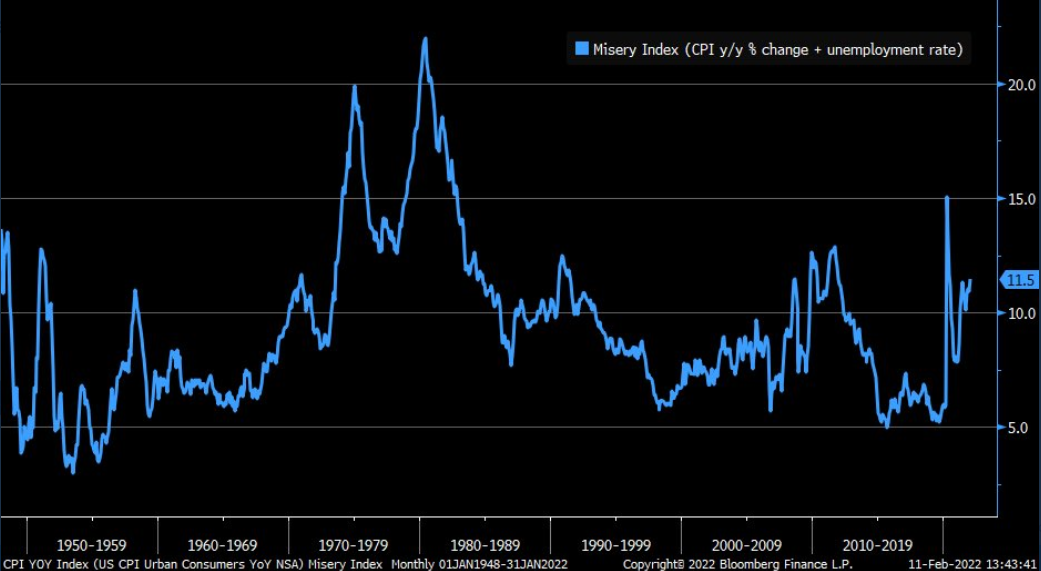
To explain, the blue line above tracks the Misery Index. For context, the index is calculated by subtracting the unemployment rate from the YoY percentage change in the headline CPI. In a nutshell, when inflation outperforms the unemployment rate (the blue line rises), it creates a stagflationary environment in America.
To that point, if you analyze the right side of the chart, you can see that the Misery Index is approaching a level that coincided with the global financial crisis (GFC). As a result, reversing the trend is essential to avoid a U.S. recession.
As such, with inflation still problematic and the writing largely on the wall, the market-implied probability of seven rate hikes by the Fed in 2022 is nearly 93% (as of Feb. 10).
Please see below:
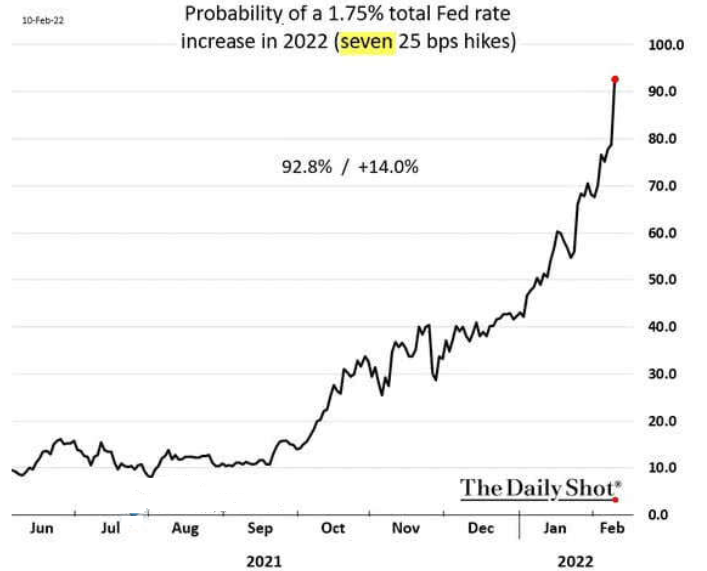
Ironically, while consumers and the bond market fret over inflation, U.S. economic growth remains resilient. While I’ve been warning for months that a bullish U.S. economy is bearish for the PMs, continued strength should turn hawkish expectations into hawkish realities.
To that point, the chart above shows that futures traders expect the U.S. Federal Funds Rate to hit 1.75% in 2022 (versus 0.08% now). However, Michael Darda, Chief Economist at MKM Partners, expects the Fed’s overnight lending rate to hit 3.5% before it’s all said and done.
“We have this booming economy with high inflation and a rapid recovery in the labor market – much different relative to the last cycle,” he said. “The Fed is behind the curve this time. They are going to have to do more.”
Singing a similar tune, John Thorndike, co-head of asset allocation at GMO, told clients that “inflation is now here, [but] the narrative is that inflation goes away and markets tend to struggle with change. It is more likely than not that real yields and policy rates need to move above inflation during this cycle.”
The bottom line? While the Russia-Ukraine drama distracts the PMs from the fundamental realities that confront them over the medium term, their outlooks remain profoundly bearish. Moreover, while I’ve noted on numerous occasions that the algorithms will enhance momentum in either direction, their influence wanes materially as time passes.
As such, while headline risk is material in the short-term, history shows that technicals and fundamentals reign supreme over longer time horizons. Thus, while the recent flare-up is an unfortunate event that hurts our short position, the medium-term developments that led to our bearish outlook continue to strengthen.
In conclusion, the PMs rallied on Feb. 14, as the Russia-Ukraine conflict is the primary driver moving the financial markets. However, while the PMs will ride the wave as far as it takes them, they ignored that the USD Index and U.S. Treasury yields also rallied. Moreover, with Fed officials ramping up the hawkish rhetoric, the PMs' fundamental outlook is more bearish now than it was in 2021 (if we exclude the Russia-Ukraine implications). As a result, while the timeline may have been delayed, lower lows should confront gold, silver, and mining stocks in the coming months.
Thank you for reading our free analysis today. Please note that the above is just a small fraction of the full analyses that our subscribers enjoy on a regular basis. They include multiple premium details such as the interim targets for gold and mining stocks that could be reached in the next few weeks. We invite you to subscribe now and read today’s issue right away.
Sincerely,
Przemyslaw Radomski, CFA
Founder, Editor-in-chief -
Gold Still Feeds on Rumors of War, but Medium-Term Remains Bearish
February 14, 2022, 8:02 AMWith another dire warning from the White House uplifting gold and mining stocks on Feb. 11, Russia and Ukraine's “will they or won't they” saga has shifted sentiment. However, it's important to remember that geopolitical risk rallies often have a short shelf life and dissipate over the medium term.
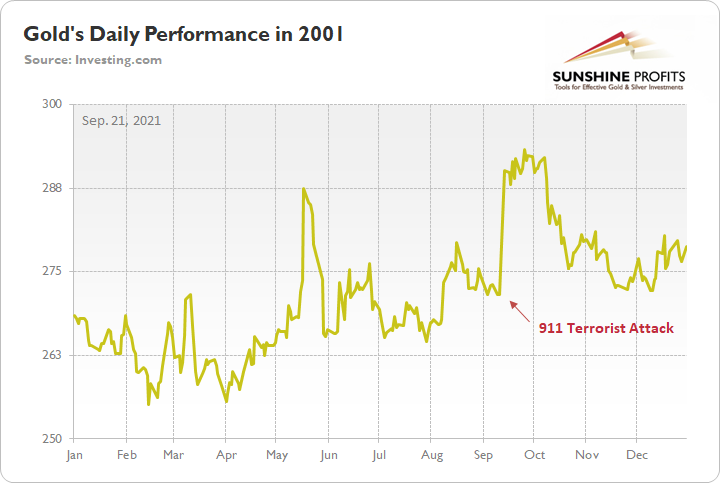
To explain, I wrote on Sep. 21:
When terrorists attacked the World Trade Center roughly 20 years ago, gold spiked on Sep. 11, 2001. However, it wasn’t long before the momentum fizzled and the yellow metal nearly retraced all of the gains by early December. Thus, when it comes to forecasting higher gold prices, Black Swan events are often more semblance than substance.
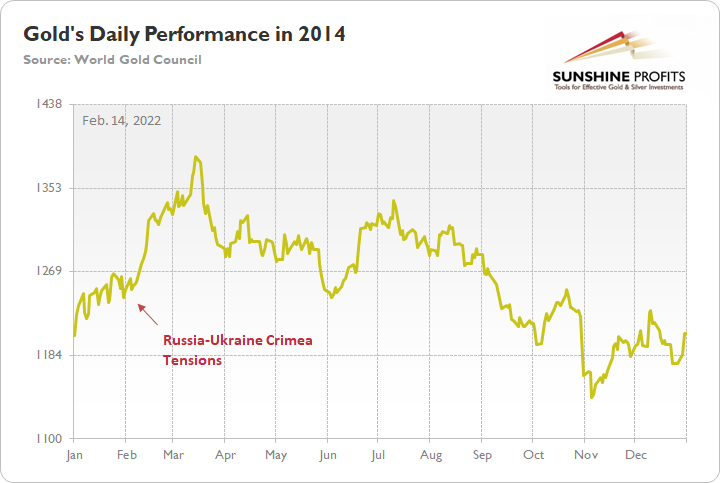
As further evidence, when Russia annexed Crimea from Ukraine in 2014, similar price action unfolded. For example, when rumors swirled of a possible invasion, gold rallied on the news. Then, when Russia officially invaded, the yellow metal continued its ascent. However, after the short-term sugar high wore off, bearish medium-term realities confronted gold once again. In time, the yellow metal gave back all of the gains and sank to a new yearly low.
Please see below:
Thus, while conflicting reports paint a conflicting portrait, the medium-term algorithms don’t care whether Russia invades Ukraine or not. With the rumor enough to pique investors’ interest, quantitative traders see it as an opportunity to capitalize on the momentum. However, once that momentum fizzles, history shows that the quants rush for the exits. As a result, is this time really different?
Let’s keep in mind that the above assumes that Ukraine would indeed be invaded, which, in my view, is unlikely, despite news coming from the White House.
To that point, the USD Index is also a major beneficiary of geopolitical tensions. However, in contrast to gold, the greenback’s rally on Feb. 11 aligns with its medium-term fundamentals.
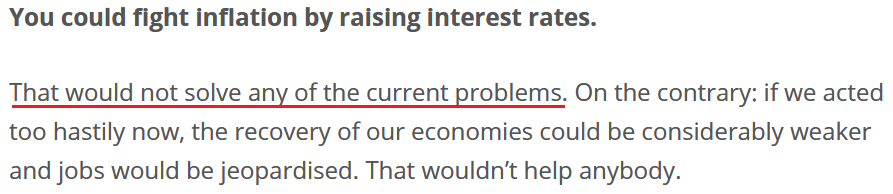
To explain, while the EUR/USD has been in style in recent weeks, ECB President Christine Lagarde provided another dose of reality on Feb. 11. Speaking with Redaktionsnetzwerk Deutschland, she reiterated all of the points that I’ve been making for months. For example, when asked about inflation and why the ECB hasn’t raised interest rates, she responded:
“Hold on! We first need to understand the source of the rise in prices. Just over 50 per cent of it can be attributed to the surge in energy prices. Oil, gas and electricity have become more expensive. And as we import a lot of energy, these prices are, to some extent, beyond the sphere of influence of our economy.”
She added: “The second main factor driving up prices is supply bottlenecks: shortages of microchips, container jams, disrupted supply chains. Let me ask you: what can the ECB do about that? Can we resolve supply bottlenecks? Can we transport containers, lower oil prices or pacify geostrategic conflicts? No, we can’t do any of that.”
As a result, while euro bulls continue to hope for a hawkish shift, Lagarde threw cold water on that idea.
Please see below:
 Source: ECB
For context, I wrote on Feb. 8:
While the EUR/USD held on to its ECB-induced gains, the bearish fundamental realities confronting the currency pair were confirmed on Feb. 7. To explain, while euro bulls think that the ECB will have a hawkish awakening, I warned on Feb. 4 that the prospect is much more semblance than substance.
Investors have priced in two ECB rate hikes in 2022. However, with the central bank still planning to purchase bonds “from October onwards” and Lagarde saying that rate hikes will only be considered thereafter, short-term sentiment should crumble over the medium term.
If that wasn’t enough, Lagarde also highlighted the U.S.-Eurozone fundamental dichotomy that I warned about throughout 2021.
Please see below:
 Source: ECB
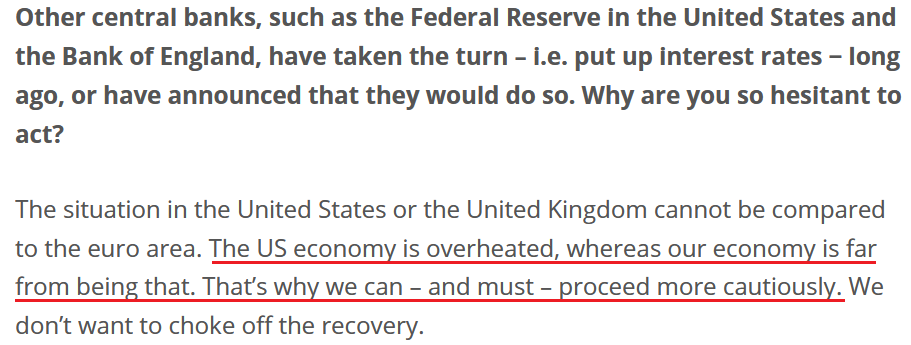
What’s more, ECB Governing Council member Olli Rehn echoed her sentiment on Feb. 11. He said:
“If we reacted strongly to inflation in the short term, we would probably cause economic growth to stop. It’s better to look beyond short-term inflation and look at what inflation is in 2023, 2024.”
As a result, while the ECB continues to disappoint euro bulls, the reality is that the Eurozone fundamentals have never changed. I’ve highlighted on numerous occasions that oil and gas are the main drivers of Eurozone headline inflation, and more importantly, core inflation actually declined in January. To explain, I wrote on Feb. 4:
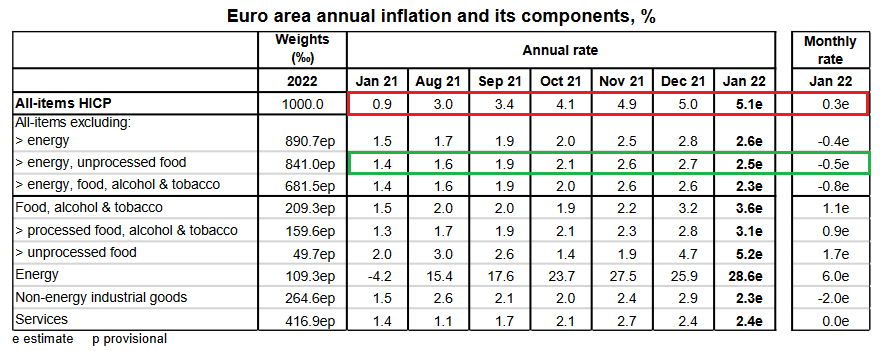 Source: Eurostat
 Follow the trajectory of the red rectangle above. As you can see, headline inflation (which includes food and energy) went from a 0.9% year-over-year (YoY) increase in January 2021 to a 5.1% YoY increase in January 2022. Pretty troublesome, huh?
However, if you focus your attention on the green rectangle, you can see that Eurozone core inflation (which excludes food and energy) declined from 2.7% YoY in December 2021 to 2.5% YoY in January 2022. As a result, while investors assume that abnormally high headline inflation will elicit a hawkish response from the ECB, the reality is that oil & gas remains the region’s only problem.
On the flip side, while the USD Index has suffered in recent weeks, Bank of America told clients that the Fed should win the "race to the top" when it comes to interest rate hikes.
"USD is no longer broadly perceived as having a strong monetary policy tailwind behind it. We disagree, less with the impulse to re-price global central banks (CBs) higher, and more with the failure of markets to preserve the Fed's lead," said Ben Randol, G10 FX & Rates Strategist.
As a result, Bank of America expects the EUR/USD to hit 1.10 in 2022.
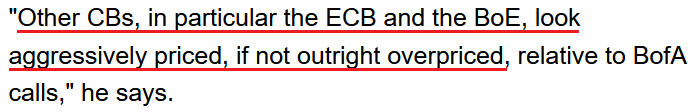 Source: Pound Sterling Live
 Furthermore, RBC Capital Markets expects the EUR/USD to fall below 1.10 in 2022. Strategists wrote: “The question is whether late January marked the bottom for EUR/USD and we will stay at higher levels (end-2022 consensus is 1.14) or it will prove to be another false dawn and EUR/USD will make new lows. We are still in the latter camp.”
The bottom line? While gold often outperforms in the short term when geopolitical tensions rise, history shows that the momentum fades over the medium term. Moreover, with the recent rally contrasting gold’s bearish medium-term fundamentals, the ascent sets the stage for an even harder fall over the next few months. As a result, while the quants may “buy the rumor,” it’s often a mad dash for the exits once sentiment shifts.
As the Ukraine-related tensions subside as there’s no attack (in particular, there’s no attack this week), the precious metals market could start its decline quite soon.
In conclusion, the PMs were mixed on Feb. 11, and mining stocks outperformed. However, while the headline risk may seem monumental, fundamental factors like the USD Index and U.S. Treasury yields will hold more weight in the coming months. As such, the recent strength is likely a countertrend rally, and lower lows should confront the yellow metal over the medium term.
Thank you for reading our free analysis today. Please note that the above is just a small fraction of the full analyses that our subscribers enjoy on a regular basis. They include multiple premium details such as the interim targets for gold and mining stocks that could be reached in the next few weeks. We invite you to subscribe now and read today’s issue right away.
Sincerely,
Przemyslaw Radomski, CFA
Founder, Editor-in-chief


Gold Investment News
Delivered To Your Inbox
Free Of Charge
Bonus: A week of free access to Gold & Silver StockPickers.
Gold Alerts
More-
Status
New 2024 Lows in Miners, New Highs in The USD Index
January 17, 2024, 12:19 PM -
Status
Soaring USD is SO Unsurprising – And SO Full of Implications
January 16, 2024, 8:40 AM -
Status
Rare Opportunity in Rare Earth Minerals?
January 15, 2024, 2:06 PM

