

Briefly: in our opinion, full (300% of the regular position size) speculative short positions in junior mining stocks are justified from the risk/reward point of view at the moment of publishing this Alert.
Yesterday, once again, seems to have been one of those a-lot-happened-but-a-little-changed sessions. Basically, we saw a small continuation of Monday’s price moves, and the implications of what we saw this week overall remain exactly as I described yesterday.
In yesterday’s analysis, I wrote the following:
For example, looking at the silver price’s jump by $0.60 in just one day – in isolation – might make one think that things are heating up for the precious metals sector, and that it’s about time to back up the truck with silver bars. Gold bars don’t seem to be such a bad idea, either.
However – as always – it’s important not to forget about the forest while looking at a single tree. In the case of the precious metals sector, it means checking the silver price’s “immediate surroundings”. The most important context is provided by the key precious metal – gold. Let’s take a look at both.
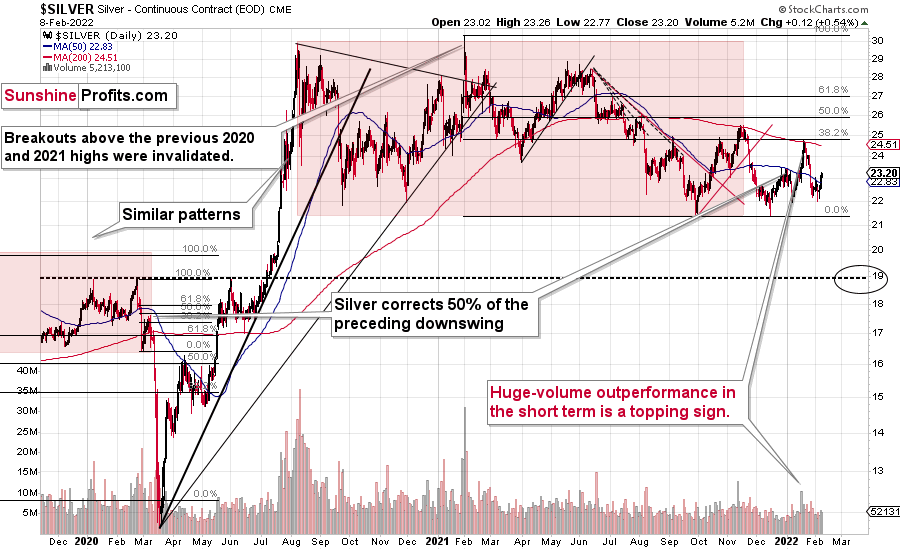
As I discussed above, silver soared by $0.60 [on Monday], which is 2.67%.
Yesterday’s move higher by $0.12 doesn’t really change anything.
One could say that it “finally” moved, because that came after several days of back-and-forth movement, when silver largely ignored what was happening in the rest of the precious metals sector.
This – by itself – is the key takeaway from the silver market. Not the volume readings, not the move back above the 50-day moving average (silver is known for fake breakouts, by the way), and not the recent bounce off the previous yearly lows.
Why would silver’s sudden strong performance be that important?
Enter gold.
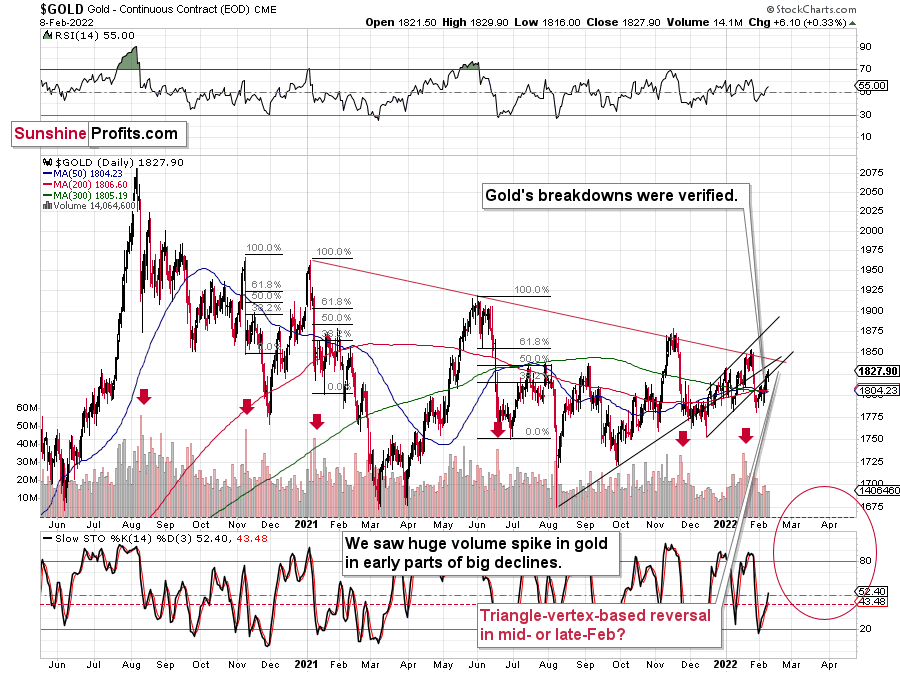
On Monday, gold rallied by just 0.77%, and that was one of the 6-day (with 1-day exception) streak of daily rallies. It was not a sudden jump in the gold price. As of today, it’s a 7-day (with a 1-day exception) streak of daily rallies.
What does it mean? It means that gold is rallying in a rather normal (corrective) manner, while silver jumped rather suddenly.
In other words, silver is catching up with gold on a short-term basis.
If you’ve been following my analyses for some time (or have been analyzing the precious metals market for a long time), you likely know about the specific characteristics of the precious metals market. Namely, one of the gold trading tips to watch for is silver’s sudden outperformance of gold. That’s when the investing public gets excited, and (due to that) that’s when tops are formed. There are numerous reasons why this happens – one of them is that silver is a much smaller market than gold, and its availability is very limited to many institutions. On the other hand, theories of manipulating the price of silver and its availability make it particularly appealing to individual investors.
I don’t want to go into the validity of all claims related to silver (but I can say that I do expect silver to soar much more than gold in the following years, but not before it falls significantly), but to emphasize that there were tens – if not hundreds – of cases, when silver’s short-term outperformance was a great indication of a price top.
We’ve just seen this indication once again.
Gold is testing its previously broken support/resistance line, and the same goes for mining stocks.
To be precise, gold is about $8, about the lower of the rising support/resistance lines. This means that the breakdown below the upper line was not invalidated, and the breakout below the lower line could be invalidated at any hour (seeing an $8 move in gold during one hour is rather common).
Let’s take a look at the mining stocks.
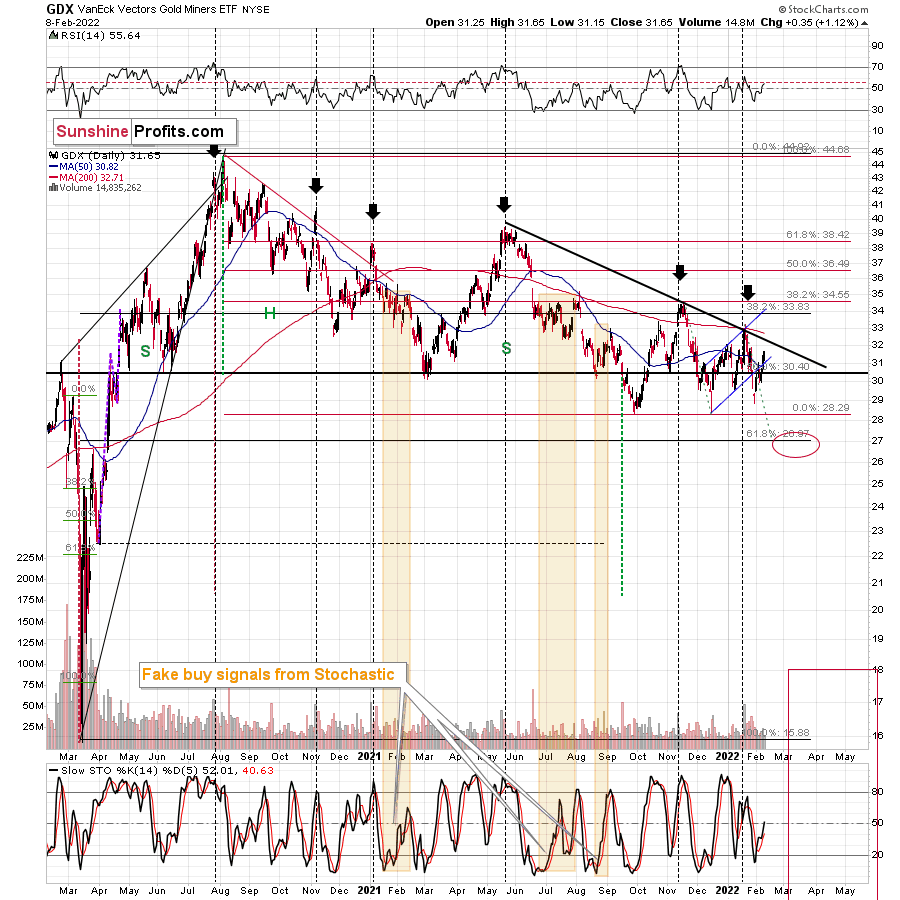
The GDX ETF moved further above its 50-day moving average and above its rising blue resistance line. That’s bullish at first sight, but please note that mining stocks have moved a little above their 50-day moving average many times in the past – right before declining. Consequently, I don’t view this “breakout” as bullish. The examples include the early-August 2021, the early-September 2021, the early 2021, October 2020, and the November 2020 tops.
There were also times when the GDX ETF moved above its 50-day moving average in a more visible manner, only to plunge shortly thereafter. Examples include the November 2020 top, and the early 2021 top.
Thus, overall, this rally is not as bullish as it might seem at the first sight.
Please note that mining stocks have been forming lower highs for many months. The only exception is the mid-2021 top, which was slightly higher than the early-2021 top. Other than that, the tops were lower. As history tends to repeat itself and trends tend to remain intact, the odds are that the next top in the GDX ETF will be below the previous 2022 top. In fact, it seems that the upside for it is very limited as the thick black resistance line based on three previous highs is just above $32.
While the GDX ETF moved a bit above its rising blue support line, GDXJ – a proxy for junior mining stocks – didn’t.
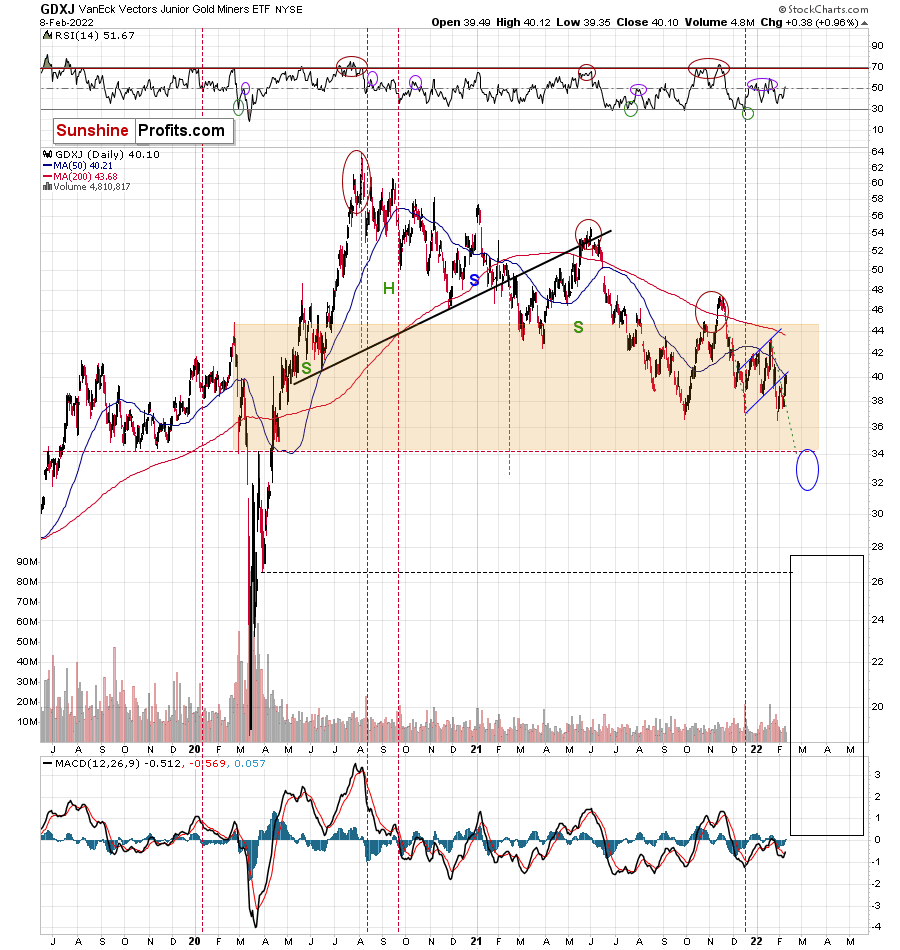
Juniors didn’t move above their 50-day moving average either.
Consequently, I don’t think it’s fair to say that the outlook is any less bearish than it’s been in the previous weeks.
Also, please consider what happened when juniors previously moved to new lows. Back in July 2021, when GDXJ moved below its previous yearly lows, it invalidated this breakdown and rallied more or less as much as GDXJ rallied recently. However, that was a fake rally that ended just below the 50-day moving average. A sharp price drop followed.
History rhymes, and the implications for the current situation are bearish.
Last, but definitely not the least, let’s not forget about the key context for all the above that’s provided by the USD Index.
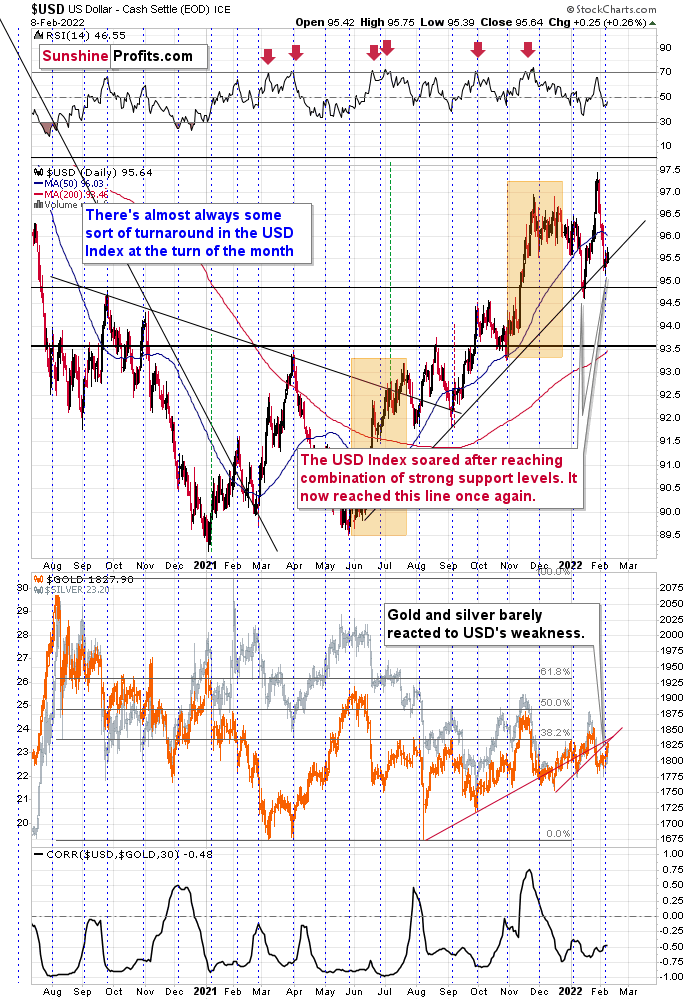
The USD Index remains above its rising medium-term support line, so the trend remains up. Therefore, higher – not lower – USD Index values are to be expected.
Especially given USD’s tendency to turn around at the turn of the month – it seems that we saw a local bottom in early February.
All in all, it seems that they (gold, silver, and mining stocks) are going to decline in the coming weeks and that we won’t have to wait too long for the decline to start.
Having said that, let’s take a look at the markets from a more fundamental point of view.
Not Coming to the Rescue
While the PMs attempt to defy fundamental gravity, U.S. Treasury yields continue to march higher. With the U.S. 10-Year Treasury yield hitting another 2022 high of 1.97% on Feb. 8, rising interest rates remain a fundamental headwind for gold, silver and mining stocks.
Please see below:
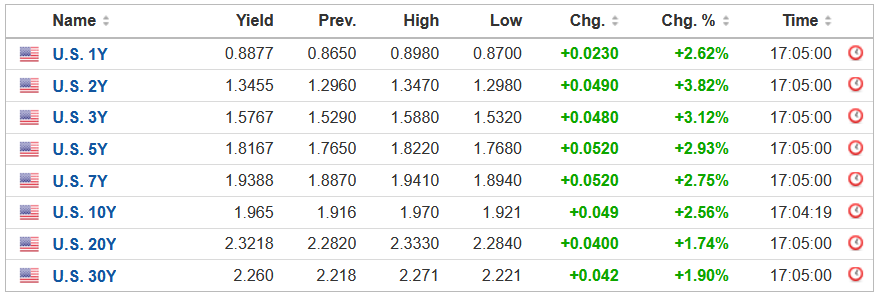 Source: Investing.com
To that point, with the Treasury benchmark hovering near a key positioning level, sustained momentum could lead to frantic hedging and push the U.S. 10-Year Treasury yield even higher. To explain, mortgage-bond investors hedge their positions by shorting U.S. Treasuries or purchasing interest rate swaps. In a nutshell: when interest rates rise, the goal is to offset the losses on long mortgage bond positions by making money on short U.S. Treasury positions.
With 1.95% as a critical level, Citigroup strategists William O’Donnell and Edward Acton told clients that they “saw no strong fingerprints” of hedging on Feb. 4. However, “a breach of 1.95% in 10’s might spur some.” As a result, if institutional investors start fearing another ‘taper tantrum,’ we may witness an extreme move higher.
Moreover, while the PMs take solace in investors’ belief that the Fed will come to the rescue, this time really is different. For one, the Fed often rescues investors when trouble materializes in the riskiest corners of the credit market. However, with volatility only present in the stock market, the ‘Fed put’ is likely much lower than current levels.
Please see below:
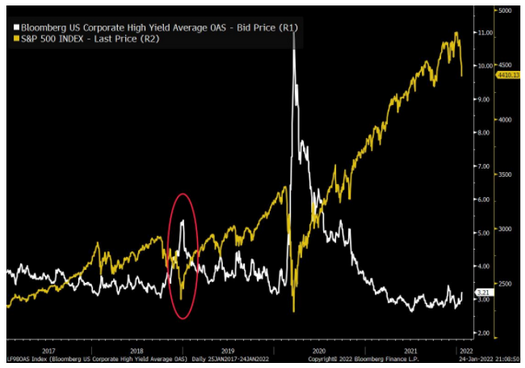
To explain, the yellow line above tracks the S&P 500, while the white line above tracks Bloomberg’s high-yield option-adjusted spread. For context, when the white line is rising, it means that investors require higher interest rates to compensate for the perceived default risk. Conversely, when the white line is falling, investors accept lower interest rates as default is less likely.
If you analyze the red circle near the middle of the chart, you can see that the Fed flipped from hawkish to dovish in late 2018 after high-yield credit markets freaked out (depicted by the white line rising sharply). Similarly, the Fed fired its QE bazooka when the white line went to the moon during the coronavirus crisis.
However, if you analyze the right side of the chart, you can see that the white line remained relatively calm even as the S&P 500 sold off. As a result, it will likely take more stock market weakness before the Fed changes its tone.
Second, I’ve warned on numerous occasions that the U.S. economy remains on solid footing. Since a bullish U.S. economy is bearish for the PMs and the NASDAQ Composite, the more economic growth increases, the more the Fed keeps its foot on the hawkish accelerator.
To that point, while the Omicron variant has hurt in-person activity, the latest data from the U.S. Bureau of Economic Analysis (BEA) shows that Americans are still swiping their debit and credit cards.
Please see below:
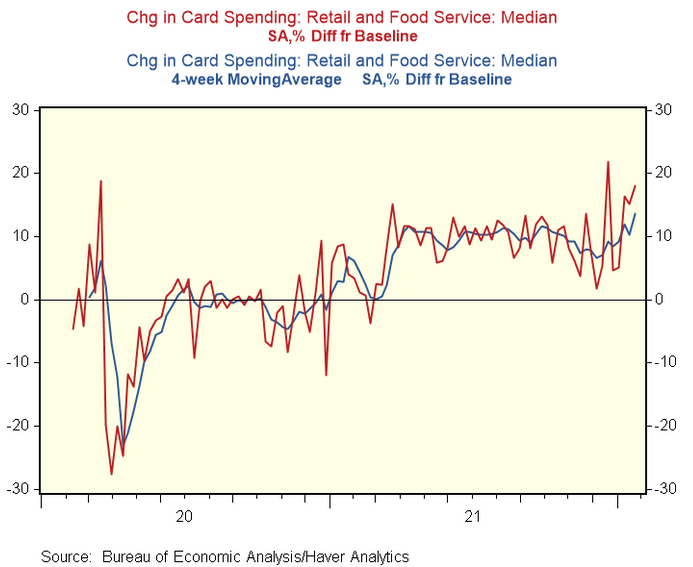
To explain, the red and blue lines above track the baseline and four-week moving average percentage changes in Americans’ debit and credit card spending. If you analyze the right side of the chart, you can see that consumer spending remains on the up and up.
As further evidence, the Chicago Fed’s Advance Retail Trade Summary (CARTS) tracks U.S. retail sales every week. In a nutshell: it tries to predict the government data that comes out each month. After correctly predicting a decline in December, the Chicago Fed expects U.S. retail sales to increase by 0.40% month-over-month (MoM) in January.
Please see below:
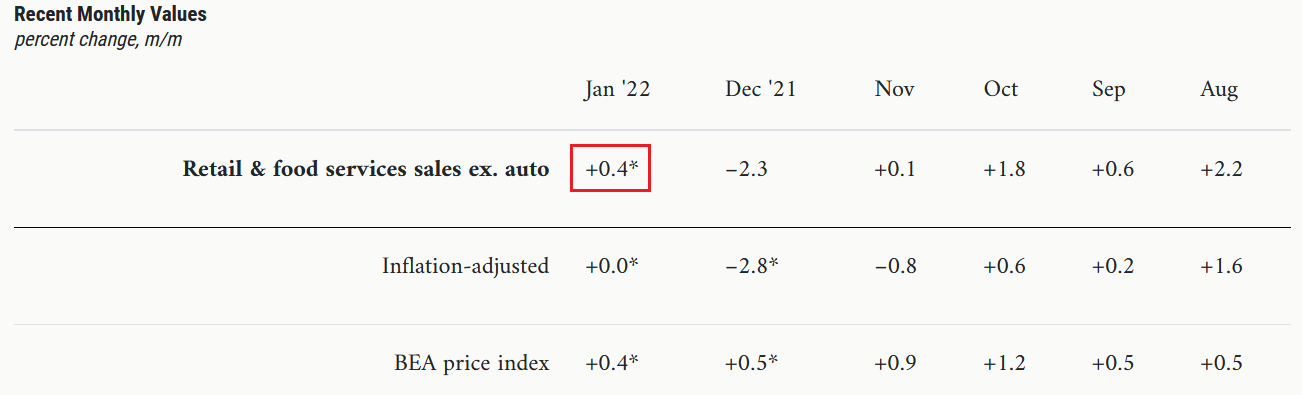 Source: Chicago Fed
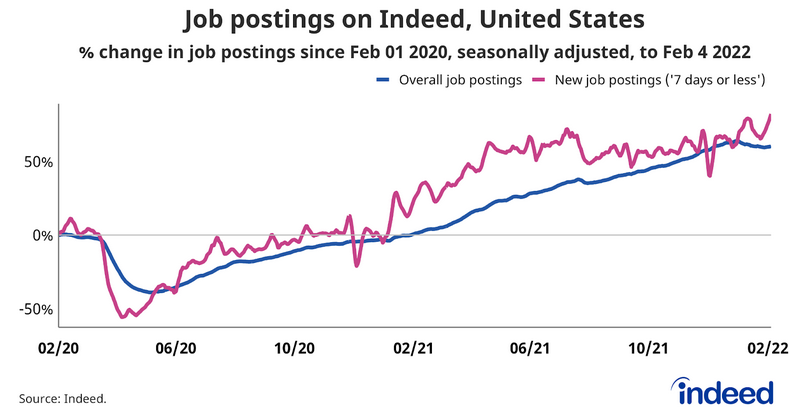
Third, Indeed released its latest U.S. job openings report on Feb. 8. An excerpt read:
“It seems like the worst of the Omicron surge’s impact might have passed. New job postings (those on Indeed for 7 days or less) are at a series high. As of February 4, new postings are 82.2% above pre-pandemic baseline, up 13 percentage points since last week.” Moreover, “job postings in all occupational sectors are above pre-pandemic baseline, especially human resources and software development.”
Please see below:
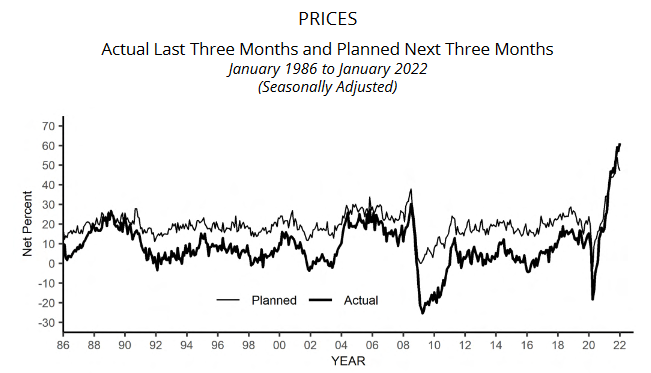
Fourth, the NFIB released its Small Business Optimism Index on Feb. 8. While the headline index declined from 98.9 in December to 97.1 in January, NFIB Chief Economist Bill Dunkelberg said that “more small business owners started the New Year raising prices in an attempt to pass on higher inventory, supplies, and labor costs. In addition to inflation issues, owners are also raising compensation at record high rates to attract qualified employees to their open positions.”
To that point, an excerpt from the report read:
“The net percent of owners raising average selling prices increased 4 points to a net 61 percent seasonally adjusted, the highest reading since Q4 1974.”
Please see below:
 Source: NFIB
As for wage inflation:
“Seasonally adjusted, a net 50 percent reported raising compensation, up 2 points from December and a 48-year record high reading.”
Please see below:
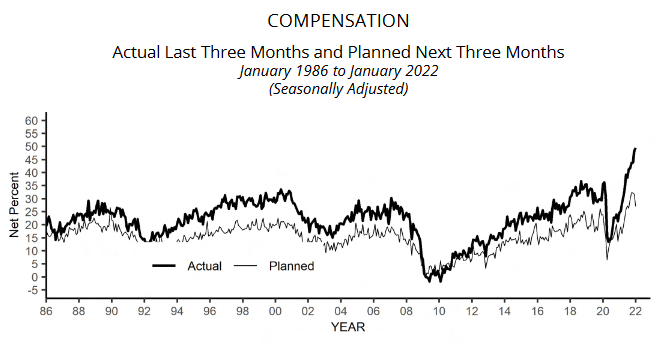 Source: NFIB
On top of that, while I sounded the inflationary alarm throughout all of 2021, the mainstream finally realizes that inflation is far from “transitory.”
 Source: NFIB
Speaking of wage inflation, Goldman Sachs’ Wage Tracker is also at record highs.
Please see below:
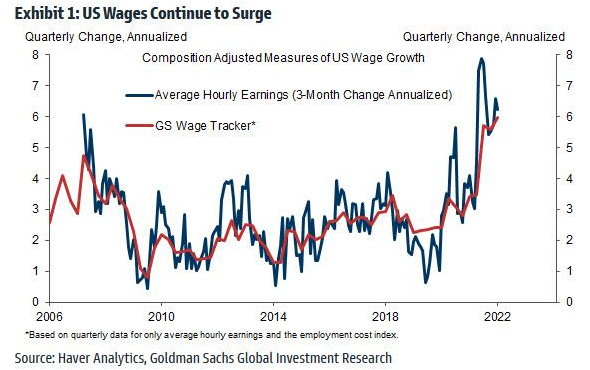
To explain, the blue line above tracks the three-month annualized change in average hourly earnings, while the red line above tracks Goldman Sachs' Wage Tracker. If you analyze the right side of the chart, you can see that the latter is now at an all-time high.
To that point, Goldman Sachs' Chief Economist, Jan Hatzius, warned clients that the wage tracker has "accelerated to a 6% annualized rate over the past 2-3 quarters" and that "the broadening of wage and price pressures across the advanced economies implies that growth needs to slow and financial conditions need to tighten at an earlier stage of the recovery than previously expected."
The bottom line? While the PMs assume that all is well on Wall Street, the outperformance of commodities in January only enhances the inflationary pressures. With weak data needed for the Fed to perform a dovish 180, the strength of the U.S. labor market signals the exact opposite. Moreover, while investors assumed that the end of enhanced unemployment benefits would kill consumer spending, there is still plenty of cash (too much) in the system. As a result, the Fed should remain on its hawkish warpath, and higher U.S. Treasury yields and a stronger USD Index will likely be the end result.
In conclusion, the PMs rallied on Feb. 8, as tepid optimism from the S&P 500 helped uplift sentiment. However, while investors hope that the Fed won't drop the hawkish hammer, the reality is that the U.S. economy remains on solid footing. As a result, the Fed should raise interest rates at its March monetary policy meeting. Moreover, with history revealing that U.S. Treasury yields and the USD Index are often the main beneficiaries of the Fed's rate-hike cycle, another re-enactment should be unkind to the PMs.
Overview of the Upcoming Part of the Decline
- It seems to me that the corrective upswing is now over, and that gold, silver, and mining stocks are now likely to continue their medium-term decline.
- It seems that the first (bigger) stop for gold will be close to its previous 2021 lows, slightly below $1,700. Then it will likely correct a bit, but it’s unclear if I want to exit or reverse the current short position based on that – it depends on the number and the nature of the bullish indications that we get at that time.
- After the above-mentioned correction, we’re likely to see a powerful slide, perhaps close to the 2020 low ($1,450 - $1,500).
- If we see a situation where miners slide in a meaningful and volatile way while silver doesn’t (it just declines moderately), I plan to – once again – switch from short positions in miners to short positions in silver. At this time, it’s too early to say at what price levels this could take place, and if we get this kind of opportunity at all – perhaps with gold close to $1,600.
- I plan to exit all remaining short positions once gold shows substantial strength relative to the USD Index while the latter is still rallying. This may be the case with gold close to $1,350 - $1,400. I expect silver to fall the hardest in the final part of the move. This moment (when gold performs very strongly against the rallying USD and miners are strong relative to gold after its substantial decline) is likely to be the best entry point for long-term investments, in my view. This can also happen with gold close to $1,375, but at the moment it’s too early to say with certainty.
- As a confirmation for the above, I will use the (upcoming or perhaps we have already seen it?) top in the general stock market as the starting point for the three-month countdown. The reason is that after the 1929 top, gold miners declined for about three months after the general stock market started to slide. We also saw some confirmations of this theory based on the analogy to 2008. All in all, the precious metals sector is likely to bottom about three months after the general stock market tops.
- The above is based on the information available today, and it might change in the following days/weeks.
You will find my general overview of the outlook for gold on the chart below:
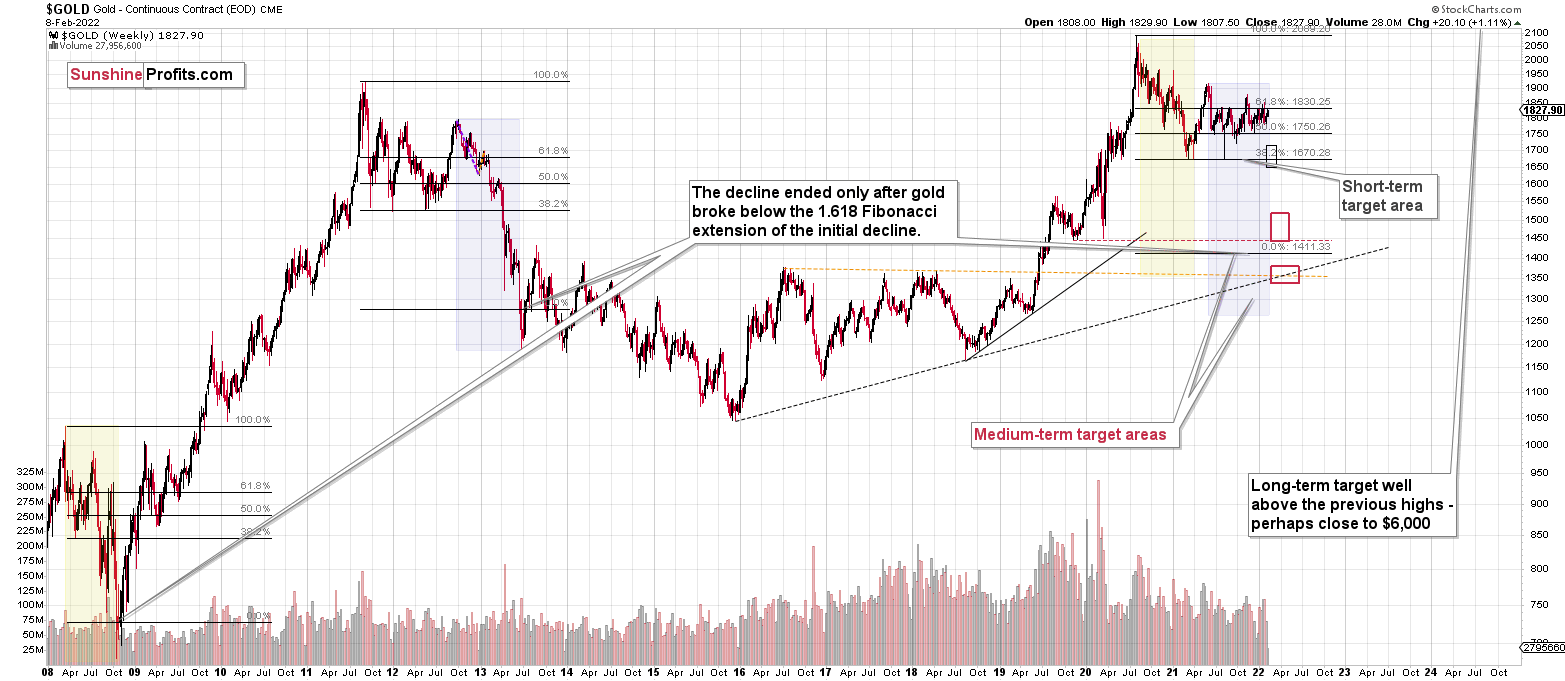
Please note that the above timing details are relatively broad and “for general overview only” – so that you know more or less what I think and how volatile I think the moves are likely to be – on an approximate basis. These time targets are not binding or clear enough for me to think that they should be used for purchasing options, warrants or similar instruments.
Letters to the Editor
Q: I would like to know why the precious metals market ignores real treasury yields so much. And have there been such big differences in gold and real treasury yields in the past?
A: The changes in real treasury yields are a fundamental factor, not a technical one. Consequently, gold doesn’t necessarily have to react to it in a timely manner, but it’s extremely likely to react to it eventually. Generally, it’s a matter of markets being logical in the long run, but emotional in the short run. In the short term, markets can focus on many different things, and it doesn’t have to make sense. One week, markets can focus on Ukraine and tensions around it, and after a few weeks, they might focus on the USD Index. Then, after a few weeks, they might react particularly visibly to GDP statistics, and so on. I’d say that the Ukraine factor (in my view, unnecessarily so) distorts the regular links that “should” work in the precious metals market. However, as we explained on this page, the impact of geopolitical events is likely to be temporary. In other words, the link between gold and real yields should be back in no time.
Q: I hope you had good travels. I had a question in regards to an interview with an analyst that made a comment about gold. At 7:50, the analyst made a comment about liking gold in the play that the Fed not being able to tighten as much as they are forecasting that the market is pricing in: https://youtu.be/zSF75-UEFpQ. This should result in a weaker dollar and stronger gold. I would like to hear your comments about this, please, especially in relation to our trade with shorting the PMs.
Thanks for your fantastic newsletters.
A: Well, that’s a rather universal comment. Whenever the market expects something and then doesn’t get it, it reacts by first moving (based on the expectation) and then declining back when it turns out that the initial reaction was actually baseless.
So, if the Fed tightens less than the market thinks, it would be bullish for gold and bearish for the USD Index. However, it seems to me that the opposite is actually more likely. Namely, as inflation becomes more and more prominent, the Fed will become even more aggressive in its actions. Why do I think this scenario is much more likely? It’s not only for the fundamental reasons that I’ve been describing on a day to day basis, but also because of the fact that inflation has become political. For those in power, votes are either everything or extremely high on their priority list. If quenching inflation means staying in power, it’s very likely to be quenched. If it’s not, then the attempts to fight it will end only after it has already done a lot of damage (to the stock market). Since PMs are likely to decline along with stocks in the early part of their decline (as it’s been the case multiple times – in 2020, 2008, and even in 1929), this part of the move, and thus PMs’ decline seems almost inevitable.
So, yes, PMs might – and are likely to rally – but not before declining significantly first.
Q: Thanks for the excellent analysis. You mentioned the two (2) triangle -vertex-based reversals due for mid/late February. Since we are getting closer to the due date, do you have any indication of whether it will be for the upside or the downside (seems more likely)? If for the downside, do you expect it to be the giant slide to 1700 or further to 1500? Speaking of timing, the 3.5-month clock is ticking. Do you still expect to reach the famous bottom (1500 approx.) in April? Is the 2013 date still valid? Lastly, I came across this article that I thought you might find insightful. Link: https://www.bloomberg.com/news/articles/2022-02-02/looks-like-there-s-a-whale-snapping-up-gold-bullion-below-1-800
A: It’s not clear to me whether we’re going to have a top or bottom in mid- or late-Feb, but given that the Ukraine-tension-based narrative is still present, I’m leaning toward the scenario in which we see either back-and-forth movement or a not-too-significant rally before the top, and it would be indeed a top that is formed later this month. This would pave the way for a powerful decline in the following weeks and months.
As for the upcoming decline, the points that I’m describing in the “Overview of the Upcoming Part of the Decline” section remain up-to-date. I think that we’re likely to see a correction when gold moves back to its 2021 lows, but then I’d expect to see a more profound slide to $1,350-$1,500.
A bottom in April might indeed take place based on the data that we have right now, but I’ll keep you informed as we get there. We’ll likely get many confirmations or invalidations of this forecast this and next month.
And yes, the link to 2013 remains valid, even though the situation is also somewhat similar to 2008 and 2020, but in a less volatile manner.
There are quite a many forces that are impacting the precious metals market at the same time right now. Fortunately, one of the key indicators that’s present in the precious metal market (medium-term strength of gold stocks relative to gold) continues to point to the same outcome – much lower prices for PMs are likely ahead in the medium term.
As for the link – the author suggests that they might be some “mysterious” big buyer that’s acquiring gold below $1,800. However, it could just as well be the situation that there’s technical support close to this level and that multiple people are buying at the same time due to it. The latter seems much more realistic to me. Once the support is broken, the following decline is likely to be huge – similarly to what we saw in 2013. Before the slide, practically nobody saw it coming, as people were lulled into a false sense of security by medium-term back-and-forth trading.
Summary
Summing up, it seems to me that the corrective upswing is over, or that we won’t have to wait too long for it to be over. Let’s keep in mind that there are triangle-vertex-based reversals in mid- and late-February, so even if we see more back-and-forth trading soon, it’s likely that the decline resumes later this month.
I continue to think that junior mining stocks are currently likely to decline the most out of all the parts of the precious metals sector.
From the medium-term point of view, the two key long-term factors remain the analogy to 2013 in gold and the broad head and shoulders pattern in the HUI Index. They both suggest much lower prices ahead.
It seems that our profits from the short positions are going to become truly epic in the coming months.
After the sell-off (that takes gold to about $1,350 - $1,500), I expect the precious metals to rally significantly. The final part of the decline might take as little as 1-5 weeks, so it's important to stay alert to any changes.
Most importantly, please stay healthy and safe. We made a lot of money last March and this March, and it seems that we’re about to make much more on the upcoming decline, but you have to be healthy to enjoy the results.
As always, we'll keep you - our subscribers - informed.
To summarize:
Trading capital (supplementary part of the portfolio; our opinion): Full speculative short positions (300% of the full position) in junior mining stocks are justified from the risk to reward point of view with the following binding exit profit-take price levels:
Mining stocks (price levels for the GDXJ ETF): binding profit-take exit price: $34.63; stop-loss: none (the volatility is too big to justify a stop-loss order in case of this particular trade)
Alternatively, if one seeks leverage, we’re providing the binding profit-take levels for the JDST (2x leveraged) and GDXD (3x leveraged – which is not suggested for most traders/investors due to the significant leverage). The binding profit-take level for the JDST: $14.98; stop-loss for the JDST: none (the volatility is too big to justify a SL order in case of this particular trade); binding profit-take level for the GDXD: $25.48; stop-loss for the GDXD: none (the volatility is too big to justify a SL order in case of this particular trade).
For-your-information targets (our opinion; we continue to think that mining stocks are the preferred way of taking advantage of the upcoming price move, but if for whatever reason one wants / has to use silver or gold for this trade, we are providing the details anyway.):
Silver futures downside profit-take exit price: $19.12
SLV profit-take exit price: $17.72
ZSL profit-take exit price: $38.28
Gold futures downside profit-take exit price: $1,683
HGD.TO – alternative (Canadian) inverse 2x leveraged gold stocks ETF – the upside profit-take exit price: $11.79
HZD.TO – alternative (Canadian) inverse 2x leveraged silver ETF – the upside profit-take exit price: $29.48
Long-term capital (core part of the portfolio; our opinion): No positions (in other words: cash
Insurance capital (core part of the portfolio; our opinion): Full position
Whether you already subscribed or not, we encourage you to find out how to make the most of our alerts and read our replies to the most common alert-and-gold-trading-related-questions.
Please note that we describe the situation for the day that the alert is posted in the trading section. In other words, if we are writing about a speculative position, it means that it is up-to-date on the day it was posted. We are also featuring the initial target prices to decide whether keeping a position on a given day is in tune with your approach (some moves are too small for medium-term traders, and some might appear too big for day-traders).
Additionally, you might want to read why our stop-loss orders are usually relatively far from the current price.
Please note that a full position doesn't mean using all of the capital for a given trade. You will find details on our thoughts on gold portfolio structuring in the Key Insights section on our website.
As a reminder - "initial target price" means exactly that - an "initial" one. It's not a price level at which we suggest closing positions. If this becomes the case (like it did in the previous trade), we will refer to these levels as levels of exit orders (exactly as we've done previously). Stop-loss levels, however, are naturally not "initial", but something that, in our opinion, might be entered as an order.
Since it is impossible to synchronize target prices and stop-loss levels for all the ETFs and ETNs with the main markets that we provide these levels for (gold, silver and mining stocks - the GDX ETF), the stop-loss levels and target prices for other ETNs and ETF (among other: UGL, GLL, AGQ, ZSL, NUGT, DUST, JNUG, JDST) are provided as supplementary, and not as "final". This means that if a stop-loss or a target level is reached for any of the "additional instruments" (GLL for instance), but not for the "main instrument" (gold in this case), we will view positions in both gold and GLL as still open and the stop-loss for GLL would have to be moved lower. On the other hand, if gold moves to a stop-loss level but GLL doesn't, then we will view both positions (in gold and GLL) as closed. In other words, since it's not possible to be 100% certain that each related instrument moves to a given level when the underlying instrument does, we can't provide levels that would be binding. The levels that we do provide are our best estimate of the levels that will correspond to the levels in the underlying assets, but it will be the underlying assets that one will need to focus on regarding the signs pointing to closing a given position or keeping it open. We might adjust the levels in the "additional instruments" without adjusting the levels in the "main instruments", which will simply mean that we have improved our estimation of these levels, not that we changed our outlook on the markets. We are already working on a tool that would update these levels daily for the most popular ETFs, ETNs and individual mining stocks.
Our preferred ways to invest in and to trade gold along with the reasoning can be found in the how to buy gold section. Furthermore, our preferred ETFs and ETNs can be found in our Gold & Silver ETF Ranking.
As a reminder, Gold & Silver Trading Alerts are posted before or on each trading day (we usually post them before the opening bell, but we don't promise doing that each day). If there's anything urgent, we will send you an additional small alert before posting the main one.
Thank you.
Przemyslaw Radomski, CFA
Founder, Editor-in-chief

