

-
Gold Rallies on Softening Inflation. What’s Going On?
August 17, 2021, 10:51 AMInflation softened slightly in July and gold prices rose, but the bullish joy may be premature. How should we respond?
Inflation eased a bit in July, but it remained disturbingly high. According to the latest BLS report on inflation, the CPI increased 0.5% in July after rising 0.9% in June. The core CPI, which excludes food and energy, also softened, as it rose 0.3% in July after increasing 0.9% in June. The deceleration was mainly caused by a much smaller advance in the index for used cars, which increased only 0.2% (it was 10.5% in June).
However, on an annual basis, inflation practically stayed unchanged since June, as the chart below shows. The overall index surged 5.4% for the second month in a row (on a seasonally unadjusted basis), while the core CPI soared 4.3%, following a 4.5% jump in the previous month.
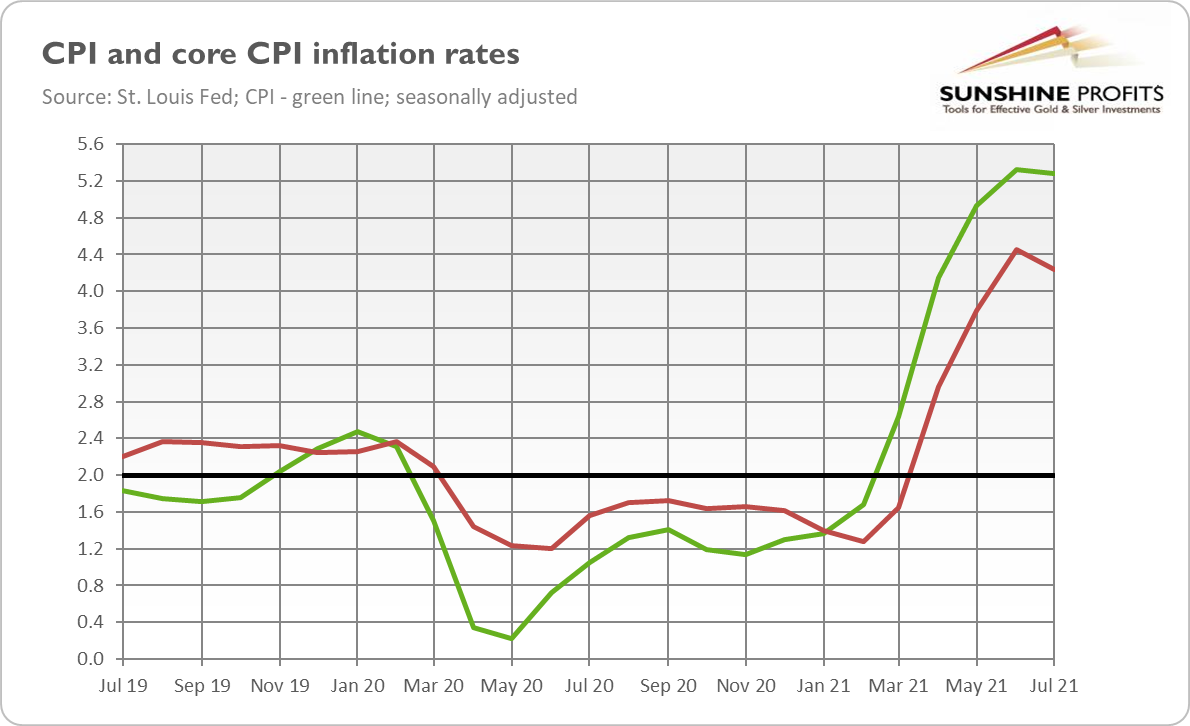
So, at first glance, it seems that inflation has peaked. This might be true, but please notice that it remained disturbingly high despite the deceleration in several subindexes, including the index for used cars. I dread to think what would be if these categories didn’t moderate!
What’s more, the producer price index for final demand rose 1% in July (MoM) and 7.8% over the past 12 months, as one can see in the chart below. It was the largest advance since the 12-month data was first calculated in November 2010. Part of this increase could be passed on to consumers later, as companies have recently gained more ability to lift prices seeing weak resistance to price increases.
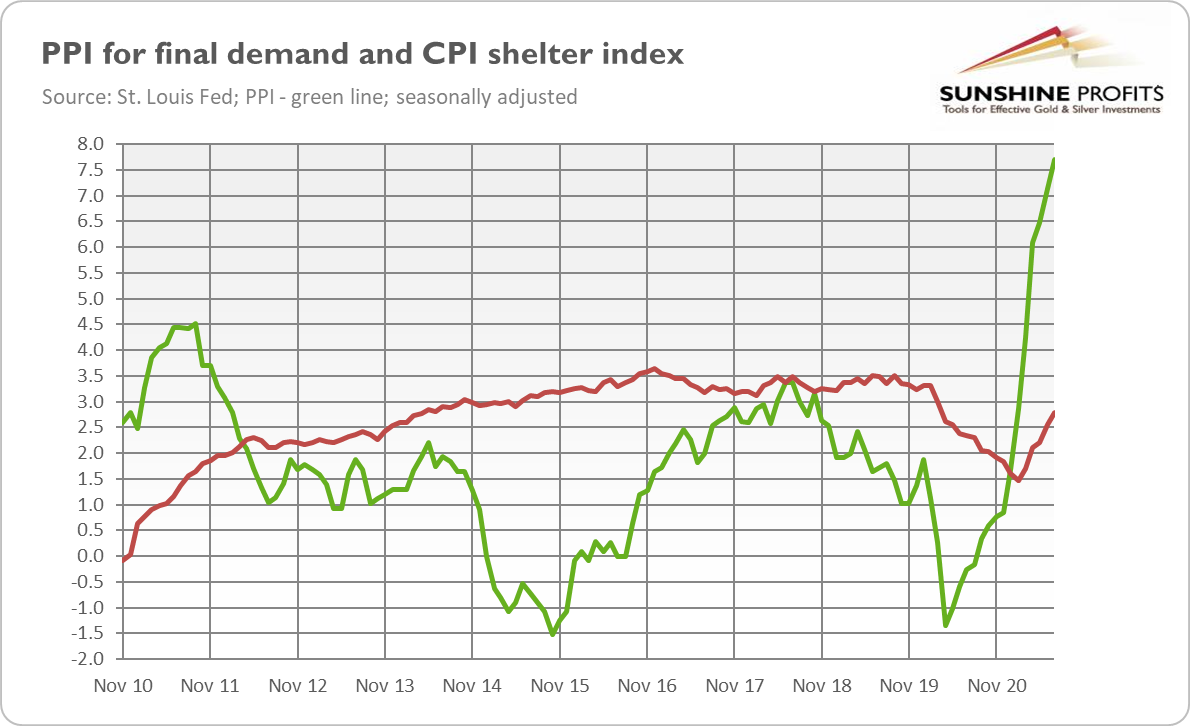
Additionally, the index for shelter – the biggest component of the CPI, not hit by the pandemic as strongly as restaurants and hotels industries – has been rising gradually since February 2021, and it has accelerated to 2.8% in July. Last but not least, the US Senate passed Biden’s infrastructure plan, which could also add something to the inflationary pressure by an increase in the money supply. All these developments suggest that inflation isn’t going away just yet.
Implications for Gold
What does the recent inflation report imply for the gold market? Well, theoretically, softer inflation should be negative for gold, which is seen as an inflation hedge and which historically shined during periods of high and accelerating inflation.
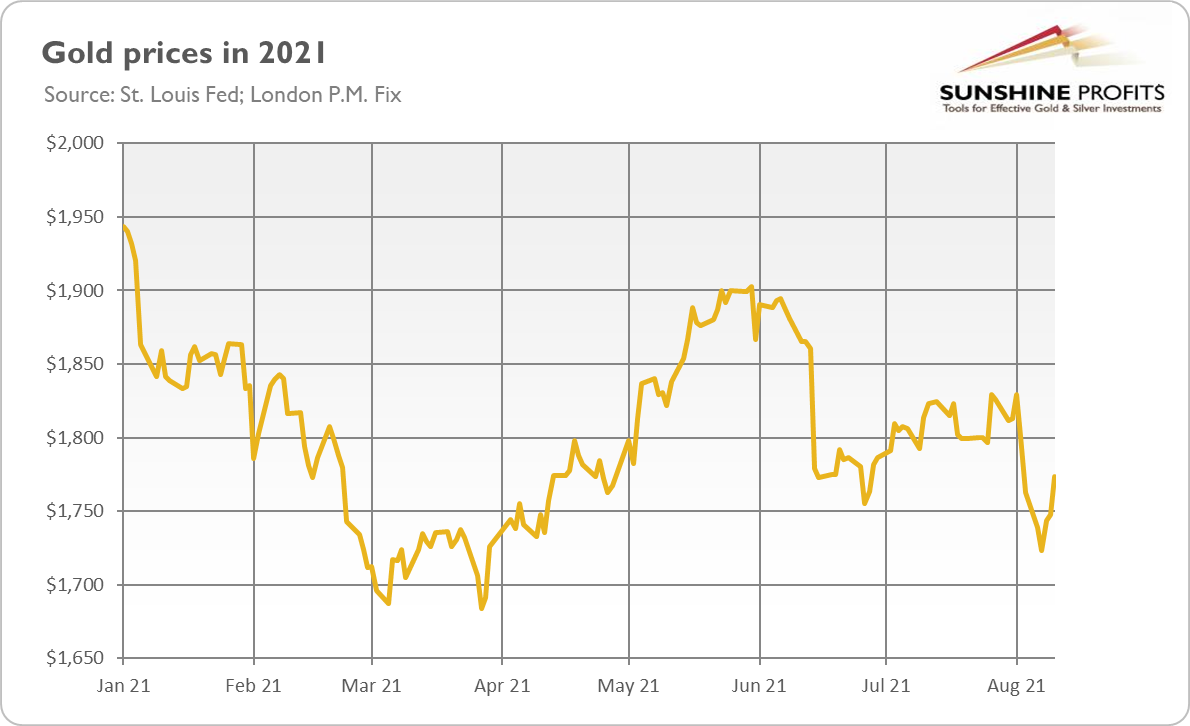
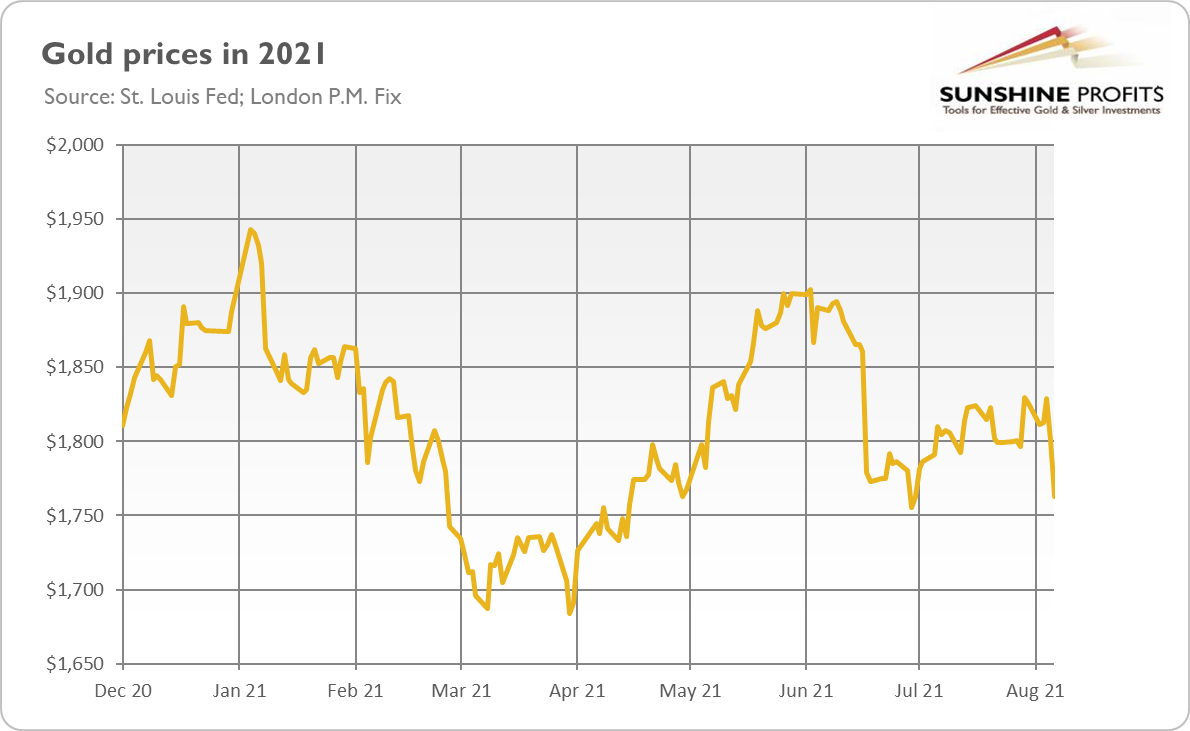
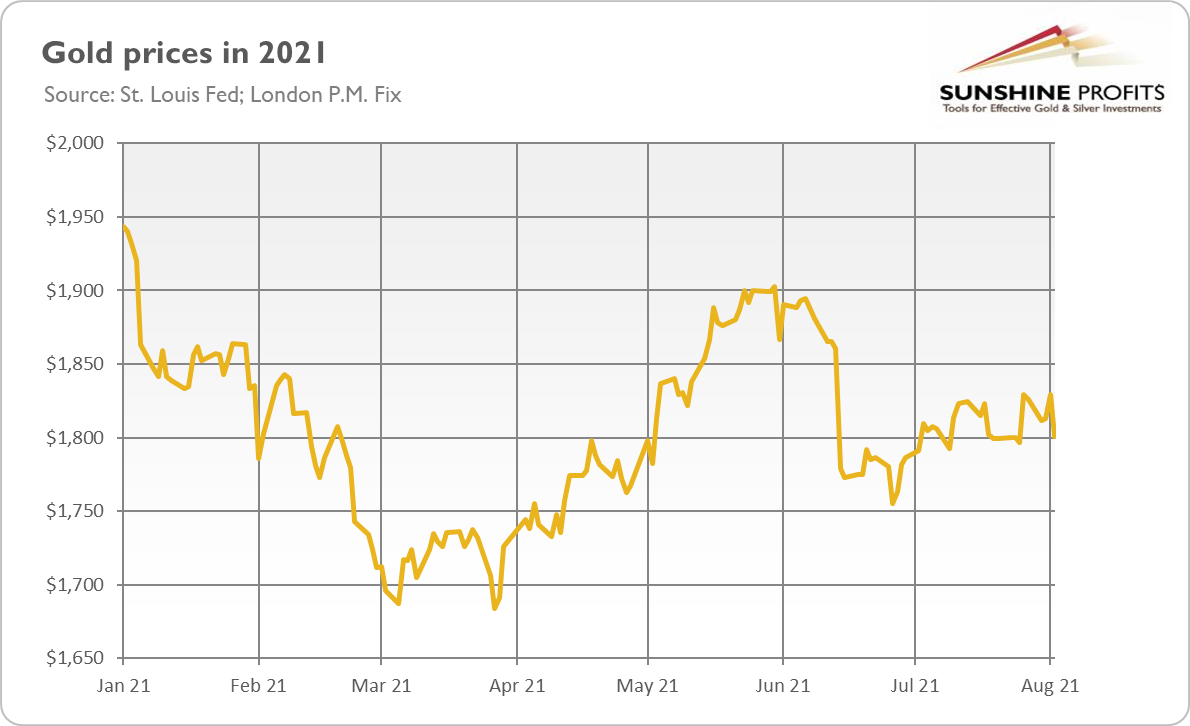
However, as the chart below shows, the price of gold has rebounded somewhat from last week’s low, gaining about $50 from Tuesday to Friday. It seems that steady (and partially below expectations) inflation gives the Fed room to maintain its ultra-dovish monetary policy. Indeed, according to the CME FedWatch Tool, the expectations for the Fed’s tightening cycle have diminished slightly from the previous week, which supported gold prices.
However, a bullish hurray might be premature. Inflation is still high and significantly above the Fed’s target. Inflation expectations remain elevated, and some measures even increased slightly in July. Unfortunately, markets seem not to worry significantly about inflation any longer, and the stock market continues its rally.
Even if inflation really softens later this year, which is likely given that some supply disruptions will probably resolve, it shouldn’t suddenly dive below 2%. So, the July report shouldn’t materially change the Fed’s stance, especially that the US central bank focuses more on the labor market now. Hence, gold investors should brace themselves for the upcoming tapering of quantitative easing.
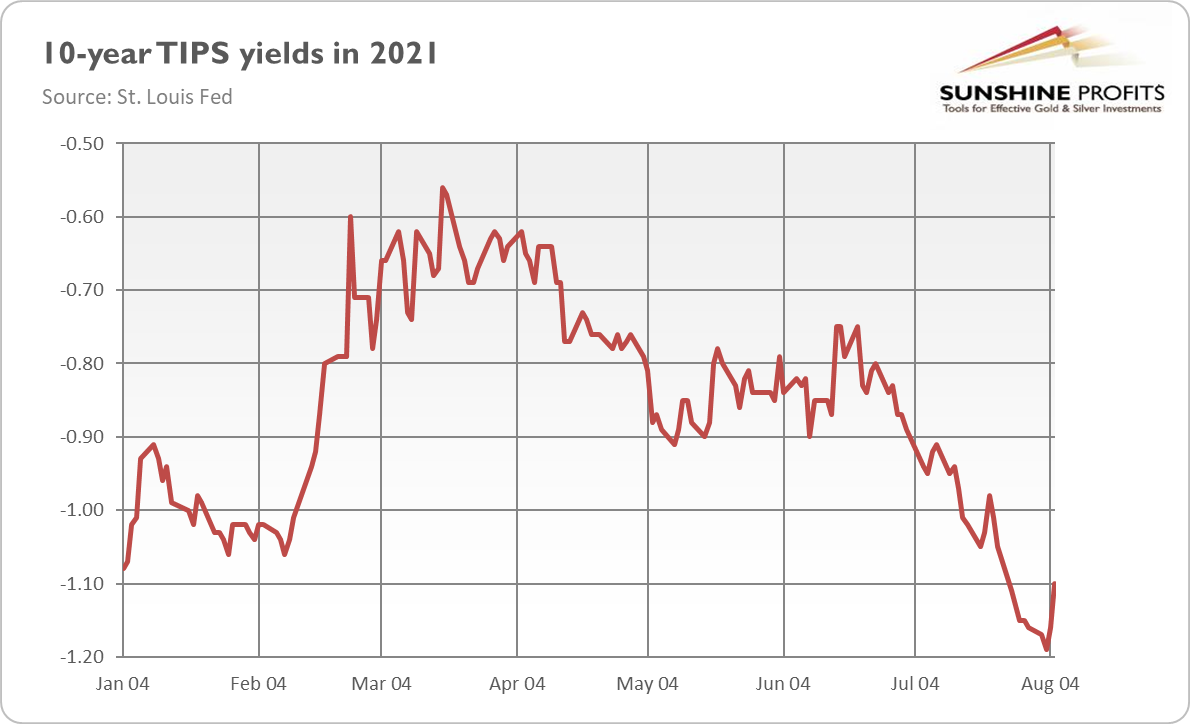
However, just as day comes after night, upward waves come after bearish trends. The most likely macroeconomic scenario is that inflation will remain high, while the economic growth will slow down, which means stagflation. Indeed, the downward trend in the bond yields – despite high inflation – could signal weak growth, requiring dovish monetary policies. If history is any guide, gold will shine during stagflation.
If you enjoyed today’s free gold report, we invite you to check out our premium services. We provide much more detailed fundamental analyses of the gold market in our monthly Gold Market Overview reports, and we provide daily Gold & Silver Trading Alerts with clear buy and sell signals. To enjoy our gold analyses in their full scope, we invite you to subscribe today. If you’re not ready to subscribe yet, and you are not on our gold mailing list yet, we urge you to sign up there as well for daily yellow metal updates. Sign up now!
Arkadiusz Sieron, PhD
Sunshine Profits: Analysis. Care. Profits.-----
Disclaimer: Please note that the aim of the above analysis is to discuss the likely long-term impact of the featured phenomenon on the price of gold and this analysis does not indicate (nor does it aim to do so) whether gold is likely to move higher or lower in the short- or medium term. In order to determine the latter, many additional factors need to be considered (i.e. sentiment, chart patterns, cycles, indicators, ratios, self-similar patterns and more) and we are taking them into account (and discussing the short- and medium-term outlook) in our Gold & Silver Trading Alerts.
-
August Starts Illy for Gold. Could September Change Anything?
August 12, 2021, 8:49 AMThe WGC believes that gold will shine in September. Given the whole context, I’m not so sure – in fact, not sure at all.
Following three previous reports, the WGC revealed two more interesting publications at the turn of July and August. The first one is the report about gold demand trends in Q2 2021. As we can read, the demand for gold was virtually flat in Q2 (y-o-y), but in the first half of the year it decreased 10.4%. Importantly, there were modest inflows into gold ETFs in Q2 and also in July, but they only partially offset the huge outflows of the previous quarter. Hence, investors’ sentiment turned more positive in the second quarter, which helped gold prices rebound somewhat after Q1.
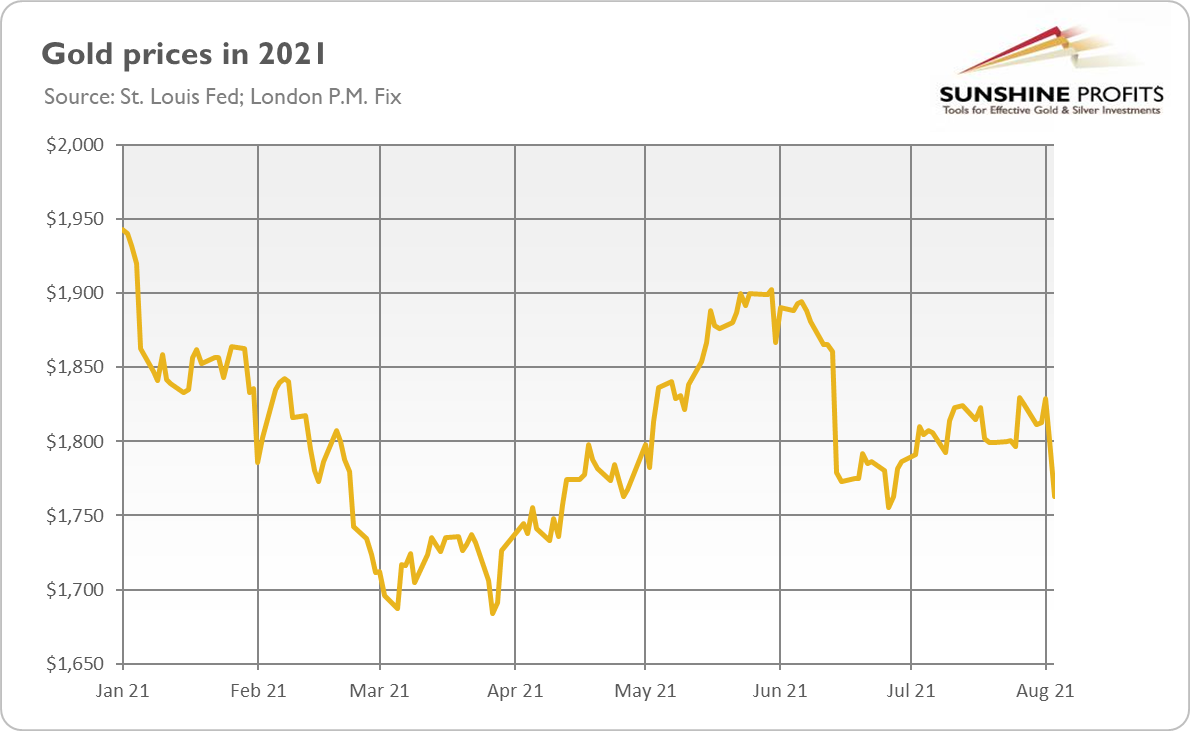
Indeed, as the chart below shows, the price of gold plunged 10% in Q1 2021. Then, it rebounded 4.3% in the second quarter, but it was not enough to offset the blow from the first three months of the year. In July, the price of gold jumped 3.6%, although it retraced most of that increase in August (it decreased 2.1% in a single day – Aug. 6). So, gold prices declined more than 6% year-to-date.
Unfortunately, there is potential for further declines. After strong July’s nonfarm payrolls, the Fed has no excuses not to start tapering of its quantitative easing. What’s more, the current levels of the real interest rates are very low, so they are likely to normalize somewhat later this year.
The second WGC publication is the newest edition of the Gold Market Commentary entitled Equity yields support gold as investors position for historical September strength. The main thesis of the article is that “August could be the opportune time to position for the historically strong September gold performance”. Well, given last week’s plunge in gold prices, this suggestion looks rather amusing, but who knows? There is plenty of time until September, which is historically quite positive for gold.
The justification for this thesis is two-fold. First, central banks focus now more on employment than inflation, which could prolong tapering activity. It’s true that the upcoming Fed’s tightening cycle will be very gradual, and the Fed’s balance sheet (as well as the federal funds rate) won’t probably return to the pre-pandemic levels. However, it’s also true that the Fed has already started the tapering clock and will likely tighten its monetary policy somewhat this year. This is what the markets are pricing in, and such expectations boost the real interest rates and create downward pressure on gold prices.
Second, the S&P 500’s real yield (i.e., companies’ earnings yield plus the dividend yield minus inflation) has turned negative, which reduces the opportunity costs of holding gold. Well, the equity market looks overbought, but with low interest rates, high inflation and the Fed always ready to reach out a helping hand, investors may continue to flow into this market.
Implications for Gold
What can we learn from the recent World Gold Council reports? Well, just like the WGC, I’m bullish on gold in the long run, but I’m more bearish in the shorter timeframe. In other words, I believe that gold may go down first before it rallies again. September is a historically good month for gold, but this year it might also be the month when the Fed announces the start of the tapering of its asset purchases. The hawkish Fed would push bond yields higher and strengthen the dollar, sending the price of the yellow metal down in the short-to-medium term.
Luckily, an abrupt taper tantrum similar to the one from 2013 is not likely to happen again. Moreover, a bit later either the post-tightening recession or inflation running out of control could make gold shine again. After all, inflation is well above the Fed’s target, while the real yields will likely remain negative for a long period. These factors should provide support for gold over a longer horizon, but investors shouldn’t downplay the upcoming tightening cycle and rising interest rates.
If you enjoyed today’s free gold report, we invite you to check out our premium services. We provide much more detailed fundamental analyses of the gold market in our monthly Gold Market Overview reports, and we provide daily Gold & Silver Trading Alerts with clear buy and sell signals. To enjoy our gold analyses in their full scope, we invite you to subscribe today. If you’re not ready to subscribe yet, and you are not on our gold mailing list yet, we urge you to sign up there as well for daily yellow metal updates. Sign up now!
Arkadiusz Sieron, PhD
Sunshine Profits: Analysis. Care. Profits.-----
Disclaimer: Please note that the aim of the above analysis is to discuss the likely long-term impact of the featured phenomenon on the price of gold and this analysis does not indicate (nor does it aim to do so) whether gold is likely to move higher or lower in the short- or medium term. In order to determine the latter, many additional factors need to be considered (i.e. sentiment, chart patterns, cycles, indicators, ratios, self-similar patterns and more) and we are taking them into account (and discussing the short- and medium-term outlook) in our Gold & Silver Trading Alerts.
-
The Newest Nonfarm Payrolls Crushed Gold Like a Sandcastle
August 10, 2021, 5:16 AMThe US economy added almost 1 million jobs in July, building solid ground for tapering. Meanwhile, the PMs’ sandy foundations crumbled spectacularly.
Another blow to gold! July’s nonfarm payrolls came in strong. As the chart below shows, the US labor market added 943,000 jobs last month, following 938,000 additions in June (after an upward revision). More than one-third of all gains occurred in leisure and hospitality, reflecting the economy’s reopening after the Great Lockdown.
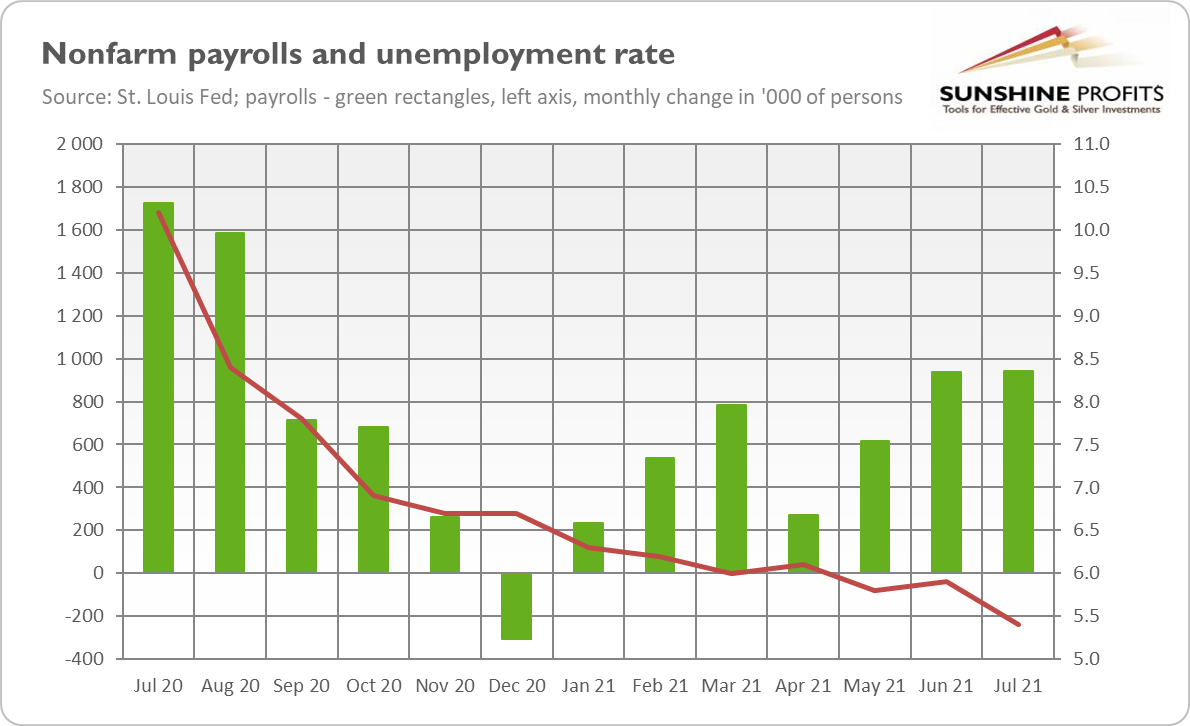
What’s more, the nonfarm payrolls surprised the markets on the positive side. The economists surveyed by MarketWatch forecasted “only” 845,000 gains. Additionally, the employment in May and June combined was 119,000 higher than previously predicted. Another positive revelation was the decline in the unemployment rate from 5.9% to 5.4% – a much lower level than it was expected (5.7%), as the chart above shows.
Although the number of employed people is still down by 5.7 million from its pre-pandemic level in February 2020, it’s much higher than in April 2020 (by 16.7 million) – a clear sign that the US labor market is recovering from the last year’s recession and heading into full employment.
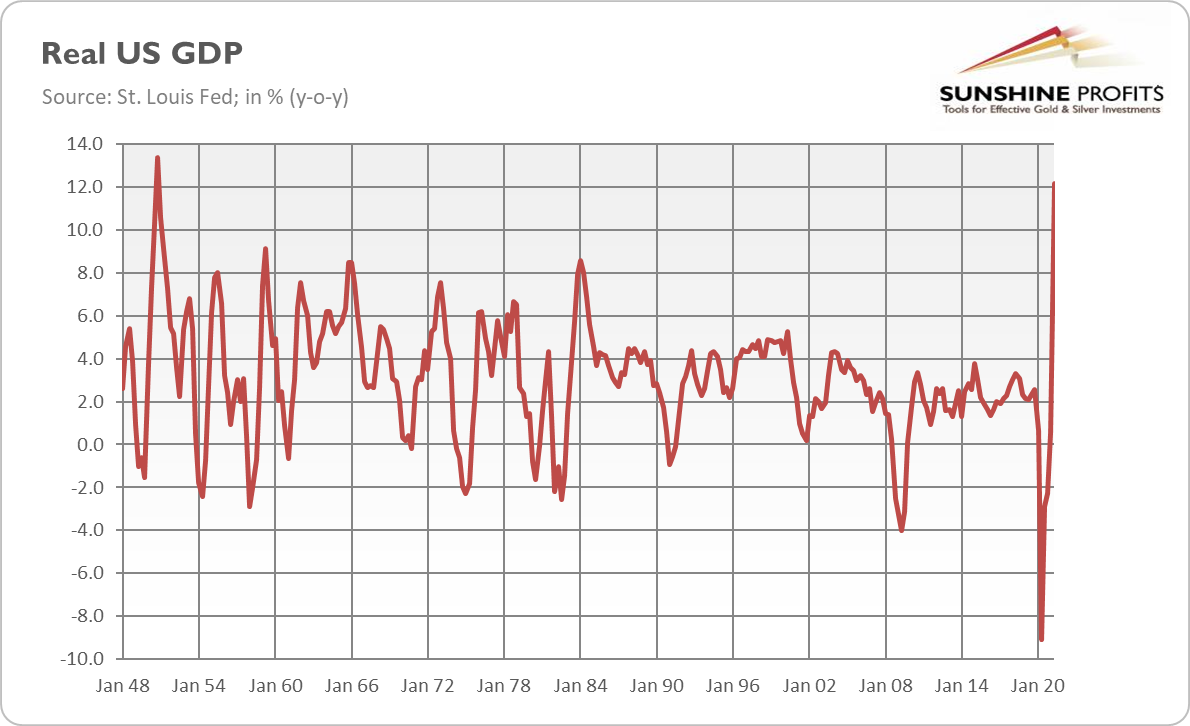
Importantly, the July nonfarm payrolls came in one week after the strong advance estimate of the US GDP in Q2 2021. According to the Bureau of Economic Analysis, the real GDP increased 12.2% year-over-year (or 1.59% quarter-to-quarter or 6.5% at an annual rate). As the chart below shows, it was the quickest pace of economic growth since the fourth quarter of 1950. Of course, the number results from a very low base last year, but it doesn’t change the fact that the economy has strengthened recently.
Implications for Gold
What does the recent employment report imply for the gold market? Well, in the last Fundamental Gold Report, I pointed out that the Fed started the countdown to the tapering of its quantitative easing and would announce it later this year:
The tapering clock is ticking. In June, the Fed started talking about tapering, while last month it noted that some progress has been made towards its goals. It’s likely that within a few months mere progress will transform into substantial progress, especially given that the job gains in July were strong and above the forecasts. With further improvements in the labor market, the expectations of a more hawkish Fed should strengthen, exerting downward pressure on the gold prices.
The latest surprisingly strong nonfarm payrolls bring us closer to the beginning of the Fed’s tightening cycle. You see, the thing the Fed lacked to recognize “substantial progress” towards its goal of maximum employment was a few strong employment reports. Last month, the US economy added almost 1 million jobs, which significantly reduced the slack in the labor market.
If August turns out to be similarly strong, the FOMC could announce the start of the tapering of its asset purchases in September. Actually, some analysts believe that Powell could signal it in his speech in Jackson Hole at the end of August.
So, in line with my previous commentary, the strong nonfarm payrolls lifted the expected path of the federal funds rate, sending gold prices much lower. According to the CME FedWatch Tool, the odds of an interest rate hike in December 2022 increased after the publication of the employment report from 58.8% to 66.2%. As a result, the price of gold plunged from around $1,800 to $1,760, as the chart below shows.
Unfortunately, gold has further room to continue its slide. Each positive economic news or any hawkish signal from the Fed (e.g., Richard Clarida, Fed Vice Chair, expressed his belief last week that “necessary conditions for raising the target range for the federal funds rate will have been met by year-end 2022”) could add to the expectations of higher interest rates and to the downward pressure on the yellow metal.
If you enjoyed today’s free gold report, we invite you to check out our premium services. We provide much more detailed fundamental analyses of the gold market in our monthly Gold Market Overview reports, and we provide daily Gold & Silver Trading Alerts with clear buy and sell signals. To enjoy our gold analyses in their full scope, we invite you to subscribe today. If you’re not ready to subscribe yet, and you are not on our gold mailing list yet, we urge you to sign up there as well for daily yellow metal updates. Sign up now!
Arkadiusz Sieron, PhD
Sunshine Profits: Analysis. Care. Profits.-----
Disclaimer: Please note that the aim of the above analysis is to discuss the likely long-term impact of the featured phenomenon on the price of gold and this analysis does not indicate (nor does it aim to do so) whether gold is likely to move higher or lower in the short- or medium term. In order to determine the latter, many additional factors need to be considered (i.e. sentiment, chart patterns, cycles, indicators, ratios, self-similar patterns and more) and we are taking them into account (and discussing the short- and medium-term outlook) in our Gold & Silver Trading Alerts.
-
The Tapering Clock Is Ticking: Fed Gives Gold Some Time
August 6, 2021, 10:25 AMThe Fed acknowledged the economy’s progress, but it’s still not “substantial progress.” In short, Powell merely slowed the hand of the tapering clock.
Last week (July 28, 2021), the FOMC published its newest statement on monetary policy. The publication was barely altered. The Fed noted that the US economy has continued to strengthen, although the sectors most heavily hit by the pandemic haven’t fully recovered yet. According to the FOMC members, the economy continues to depend on the course of the coronavirus, but not “significantly” anymore. So, the Fed acknowledged that the American economy has strengthened (even with the recent worries about delta variant) and that we are returning to post-epidemic normalcy. Theoretically, it’s bad news for gold, but this is something we all know, so the practical impact should be minimal.
A much more interesting change in July’s FOMC statement is the part about the Fed’s asset purchases:
Last December, the Committee indicated that it would continue to increase its holdings of Treasury securities by at least $80 billion per month and of agency mortgage‑backed securities by at least $40 billion per month until substantial further progress has been made toward its maximum employment and price stability goals. Since then, the economy has made progress toward these goals, and the Committee will continue to assess progress in coming meetings.
As one can see, the US central bank admitted that the economy had made progress towards its goals, but it was just “progress”, while the Fed needs “substantial further progress” to normalize its monetary policy. So, we still have some distance to the tapering of quantitative easing.
However, the emphasis that economy has made progress towards Fed’s goals is a hawkish signal that the tightening cycle is on the way. This is, at least, how markets interpreted the message, as the likelihood of a 2022 interest rate hike has initially increased after the FOMC meeting, according to the CME’s FedWatch tool.
This would be bad for gold, but Powell held out a helpful, dovish hand. During his press conference, Fed Chairman noted that the US economy is far away from reaching “substantial further progress” toward the maximum employment goal.
So, what would substantial further progress be? I'd say we have some ground to cover on the labor market side. I think we're some way away from having had substantial further progress with max -- toward the maximum employment goal. I would want to see some strong job numbers. And that's kind of the idea.
Powell also reiterated that the Fed would provide advance notice before tapering its asset purchases and that the liftoff of the interest rates is still a long way ahead of us, as the Fed won’t raise the federal funds rate before tapering:
In coming meetings the Committee will again assess the economy’s progress toward our goals, and the timing of any change in the pace of our asset purchases will depend on the incoming data. As we have said, we will provide advance notice before making any changes to our purchases (…)
We’re clearly a ways away from considering raising interest rates. It’s not something that is on our radar screen right now. You know, so when we get to that question, when we start to get to the question of liftoff, which we are not at all at now or near now, that’s when we’ll ask that question. That is when that will become a real question for us (…)
And, again, it’s not timely for us to be thinking about raising interest rates right now. What we’re doing is we're looking at our asset purchases and judging what is right for the economy and judging how we -- how close we are to substantial further progress and then tapering after that.
Implications for Gold
What does the recent FOMC meeting imply for the gold market? Well, as the chart below shows, the recent statement on monetary policy wasn’t particularly impactful on the yellow metal. Gold declined slightly below $1,800 on the day of the publication, but it increased to $1,829 the next day. Since then, the price of the yellow metal has returned to the level of around $1,800.
However, the FOMC’s decision may have some longer-term implications for the gold market as well. On the one hand, the statement and Powell’s press conference were dovish, as they emphasized that – despite some progress – the substantial progress hasn’t materialized yet, so we are still ahead of the tapering, not even mentioning any hikes in the interest rates. So, gold could catch its breath.
On the other hand, the tapering clock is ticking. In June, the Fed started talking about tapering, while last month it noted that some progress has been made towards its goals. It’s likely that within a few months mere progress will transform into substantial progress, especially given that the job gains in July were strong and above the forecasts. With further improvements in the labor market, the expectations of a more hawkish Fed should strengthen, exerting downward pressure on the gold prices.
If you enjoyed today’s free gold report, we invite you to check out our premium services. We provide much more detailed fundamental analyses of the gold market in our monthly Gold Market Overview reports, and we provide daily Gold & Silver Trading Alerts with clear buy and sell signals. To enjoy our gold analyses in their full scope, we invite you to subscribe today. If you’re not ready to subscribe yet, and you are not on our gold mailing list yet, we urge you to sign up there as well for daily yellow metal updates. Sign up now!
Arkadiusz Sieron, PhD
Sunshine Profits: Analysis. Care. Profits.-----
Disclaimer: Please note that the aim of the above analysis is to discuss the likely long-term impact of the featured phenomenon on the price of gold and this analysis does not indicate (nor does it aim to do so) whether gold is likely to move higher or lower in the short- or medium term. In order to determine the latter, many additional factors need to be considered (i.e. sentiment, chart patterns, cycles, indicators, ratios, self-similar patterns and more) and we are taking them into account (and discussing the short- and medium-term outlook) in our Gold & Silver Trading Alerts.
-
Allocation to Gold Is Set to Rise. How Will Prices Respond?
August 3, 2021, 8:51 AMThe latest WGC reports show that institutional allocation to gold will increase. What if there is more to it than just “higher demand, higher price”?
In July the WGC published three interesting reports. The first one, Rethink, Rebalance, Reset: Institutional Portfolio Strategies for the Post-Pandemic Period, is an interesting survey of 500 institutional investors around the world ran by Greenwich Associates between October 2020 and January 2021. The study investigated investors about portfolios, allocations and views on various markets, gold, and other individual asset classes.
The main result of the survey is that institutional allocations to gold are expected to increase over the next three years. To be more specific, the study finds that, currently, only 20% of institutions have an allocation to gold in their portfolios, which amounts to 4% of their portfolios, on average. However:
Almost 40% of current gold investors expect to increase their allocations in the next three years, and about 40% of institutional investors who do not have gold exposure but have a target or have considered it, plan to make an investment in that time frame.
The growing allocation to gold partially reflects rising concern about inflation and a search for inflation-protection assets. According to the WGC, gold performs well in periods of high inflation: in the years when the US CPI annual rates were higher than 3%, gold prices rose 15%, on average. My own research shows that gold doesn’t protect against low inflation readings; it hedges only against high and accelerating inflation.
However, the study suggests that institutional investors have a broader view of gold than just as an inflation hedge. Actually, portfolio diversification tops inflation-hedging as the major role gold plays in the portfolios. After all, market downturns often boost demand for gold, as the yellow metal has a negative correlation to risk assets, which often increases when these assets sell off. Also, institutions use gold for long-term risk-adjusted return enhancement, especially in the environment of negative interest rates.
Importantly, gold may be useful not only for commercial financial institutions but also for the central banks. The second recent WGC report, Monetary gold and central bank capital, discusses the vulnerabilities specific to central bank balance sheets and discusses how gold holdings can mitigate the risks posed. The publication points out that gold provides central banks with extra protection, as it mitigates the risk of asset losses. In particular, gold offsets gains and losses in the US dollar held as a reserve by central banks all around the world:
Gold can play a role as a counter-cyclical hedge to USD exposure because, as the dollar weakens, gold strengthens. Hence, revaluation gains on a central bank’s gold portfolio should offset losses suffered on its USD portfolio and help to maintain its core equity.
The last report is Gold mid-year outlook 2021: Creating opportunities from risks. The main thesis is that the negative impact of higher bond yields would likely be offset by inflation and stronger demand for gold as a portfolio-diversification in an environment of ultra-low real interest rates and strong risk-taking.
The WGC’s thesis corresponds with my observation that gold is at a crossroads of a more hawkish Fed and higher inflation (I will elaborate on this in the upcoming edition of the Gold Market Overview). The report rightly states that gold’s performance in H1 2021 was driven primarily by higher interest rates, which could continue to create headwinds for the yellow metal in the second half of the year.
However, the WGC believes that the Fed will be cautious with its tightening cycle. Although that may be true, gold is likely to struggle during the period of strengthening expectations of quantitative tightening and rising interest rates.
Implications for Gold
What can we learn from the recent WGC reports? Well, I believe that the most important information is that the institutional allocation to gold is going to increase in the upcoming years. Given that investment demand for gold is the most important driver of its price, this is positive news for gold bulls.
The survey results should always be taken with a pinch of salt, but the recent ETF flows confirm that there is still significant interest in gold. In June, the inflows to gold ETFs slowed down, as the chart below shows, but remained positive (+2.9 tons) despite the plunge in gold prices.
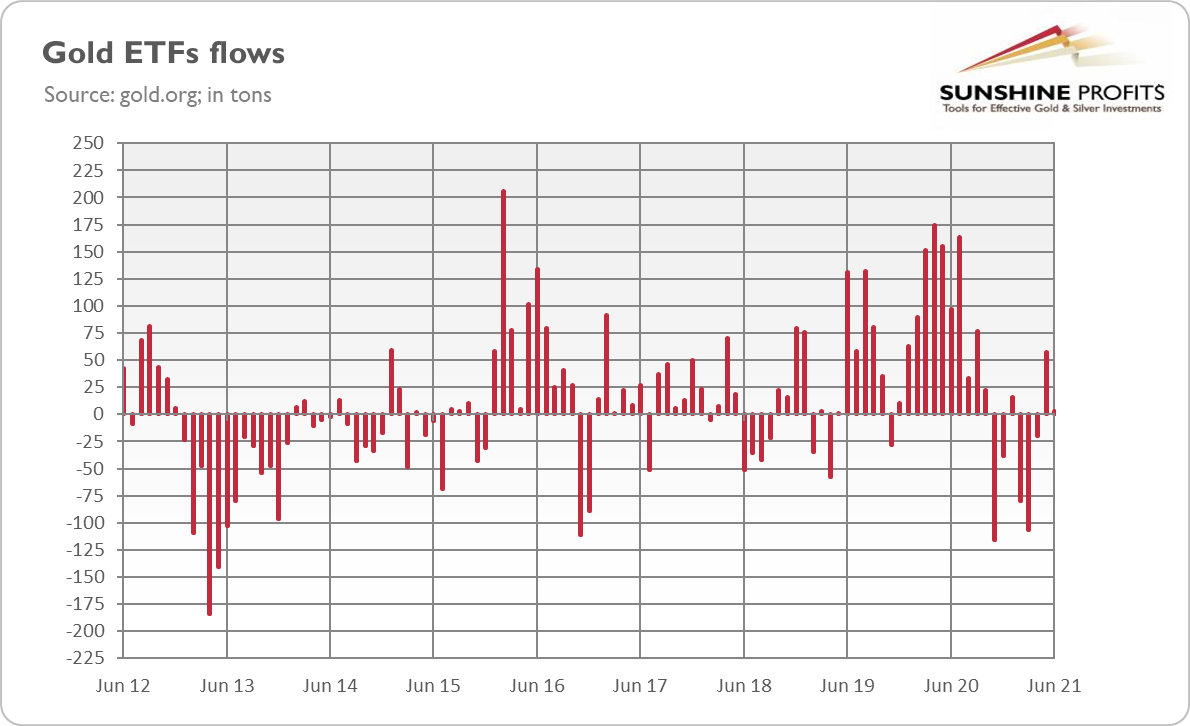
According to the WGC, this adjustment suggests that “investors may have taken advantage of the lower price level to gain long gold exposure”. In other words, gold could decline even more, but inflation concerns provided some support. What’s important, the recent dynamics of the ETFs flows don’t look as bad as in 2013 (at least not yet) when gold definitely sank into the bear market. So, although ETFs flows don’t necessarily drive the gold prices, there is a hope that the upcoming Fed’s tightening cycle will be less harmful to gold than the infamous 2013 taper tantrum.
If you enjoyed today’s free gold report, we invite you to check out our premium services. We provide much more detailed fundamental analyses of the gold market in our monthly Gold Market Overview reports, and we provide daily Gold & Silver Trading Alerts with clear buy and sell signals. To enjoy our gold analyses in their full scope, we invite you to subscribe today. If you’re not ready to subscribe yet, and you are not on our gold mailing list yet, we urge you to sign up there as well for daily yellow metal updates. Sign up now!
Arkadiusz Sieron, PhD
Sunshine Profits: Analysis. Care. Profits.-----
Disclaimer: Please note that the aim of the above analysis is to discuss the likely long-term impact of the featured phenomenon on the price of gold and this analysis does not indicate (nor does it aim to do so) whether gold is likely to move higher or lower in the short- or medium term. In order to determine the latter, many additional factors need to be considered (i.e. sentiment, chart patterns, cycles, indicators, ratios, self-similar patterns and more) and we are taking them into account (and discussing the short- and medium-term outlook) in our Gold & Silver Trading Alerts.


Gold Reports
Free Limited Version
Sign up to our daily gold mailing list and get bonus
7 days of premium Gold Alerts!
Gold Alerts
More-
Status
New 2024 Lows in Miners, New Highs in The USD Index
January 17, 2024, 12:19 PM -
Status
Soaring USD is SO Unsurprising – And SO Full of Implications
January 16, 2024, 8:40 AM -
Status
Rare Opportunity in Rare Earth Minerals?
January 15, 2024, 2:06 PM

