

-
Gold Investment Update: Gold Miners - Last of the Summer Wine
September 13, 2021, 9:51 AMAutumn is just around the corner, and while the precious metals tasted some success most recently, the medium-term is still set for a downtrend.
With Fed Chairman Jerome Powell sticking to his dovish guns and U.S. nonfarm payrolls elongating the central bank’s perceived taper timeline, gold, silver, and mining stocks were extremely happy campers. However, with event-driven rallies much more semblance than substance, I warned on Sep. 7 that the rollercoaster of emotions would likely end in tears.
I wrote:
With the 2013 analogue leading the gold miners down an ominous path, the HUI Index and the GDX ETF have rallied by roughly 8% off their recent lows. However, identical developments occurred in 2013, and neither bout of optimism invalided their bearish medium-term outlooks.
And after the GDX ETF and the GDXJ ETF (our profitable short position) plunged by 5.35% and 6.98% respectively last week, summertime sadness confronted the precious metals. Likewise, with more melancholy moves likely to materialize over the medium term, gold, silver, and mining stocks should hit lower lows during the autumn months.
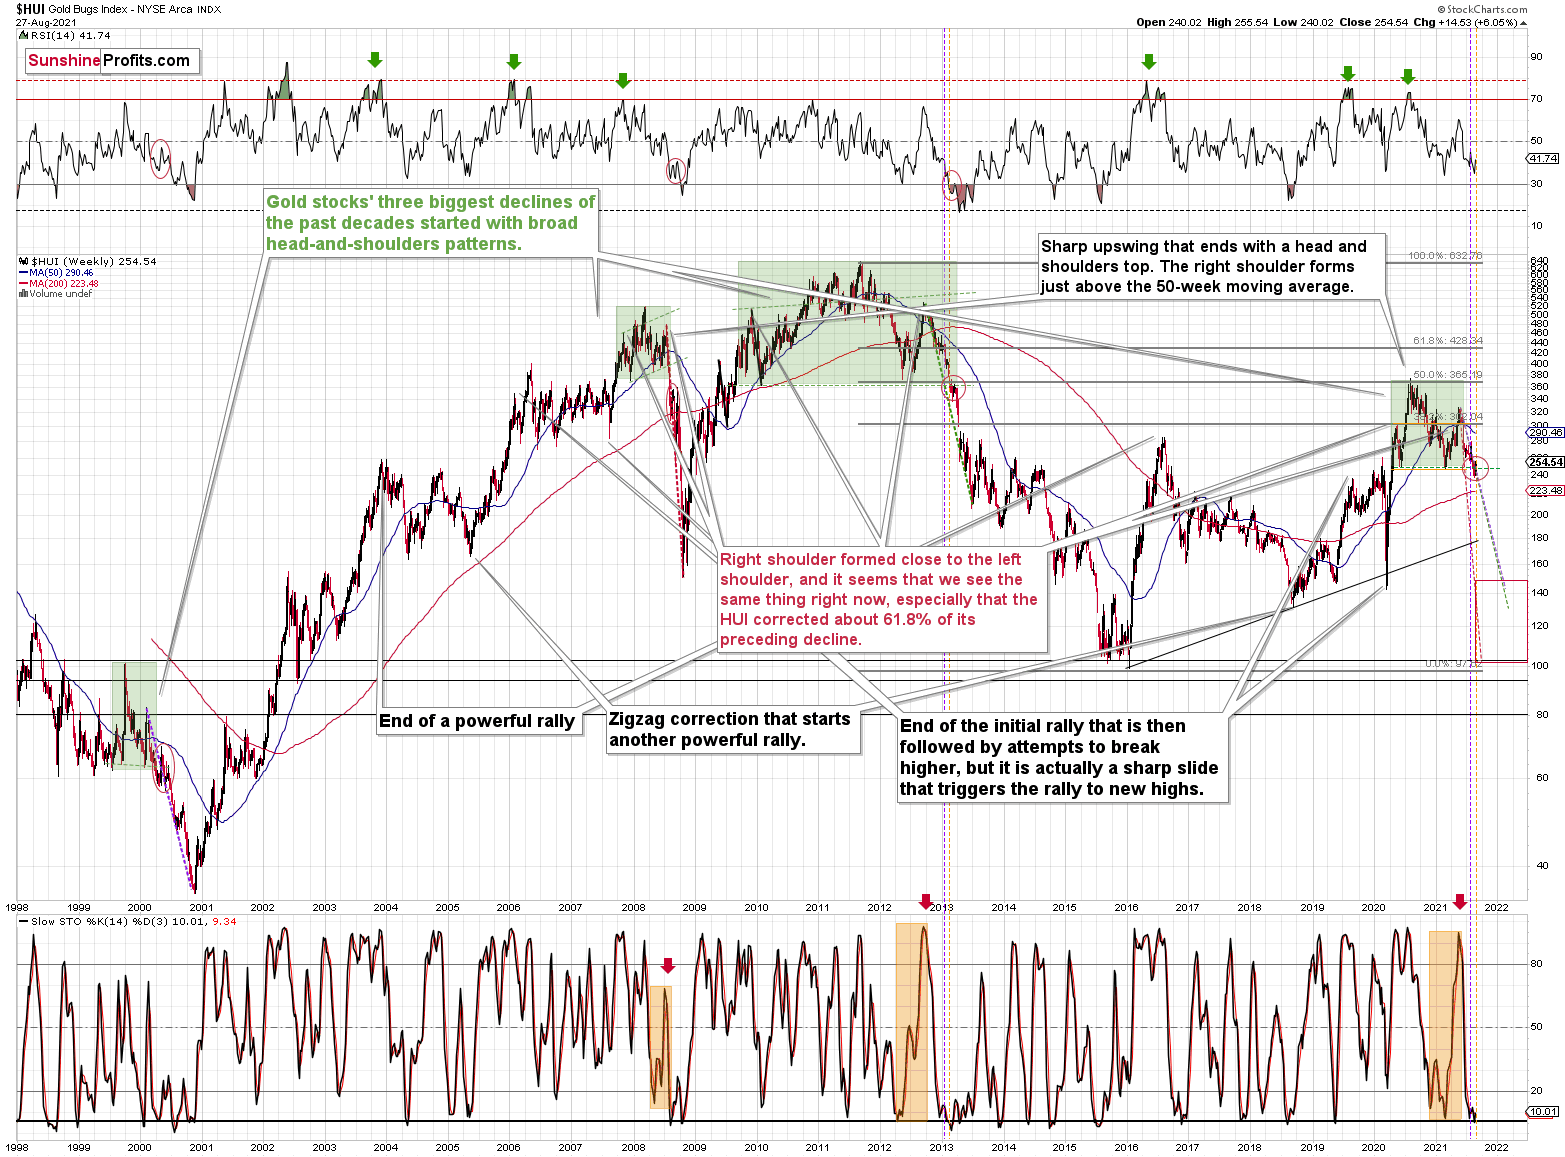
To explain, the HUI Index also plunged by nearly 6% last week, and the reversal of the previous corrective upswing mirrors its behavior from 2013. In addition, with its stochastic oscillator and its RSI (Relative Strength Index) also a spitting image, an ominous re-enactment of 2013 implies significantly lower prices over the medium term.
Please see below:

What’s more, the vertical, dashed lines above demonstrate how the HUI Index is following its 2012-2013 playbook. For example, after a slight buy signal from the stochastic indicator in 2012, the short-term pause was followed by another sharp drawdown. For context, after the HUI Index recorded a short-term buy signal in late 2012 – when the index’s stochastic indicator was already below the 20 level (around 10) and the index was in the process of forming the right shoulder of a huge, medium-term head-and-shoulders pattern – the index moved slightly higher, consolidated, and then fell off a cliff. Thus, the HUI Index is quite likely to decline to its 200-week moving average (or so) before pausing and recording a corrective upswing. That’s close to the 220 level. Thereafter, the index will likely continue its bearish journey and record a final medium-term low some time in December.
Furthermore, I warned previously that the miners’ drastic underperformance of gold was an extremely bearish sign. There were several weeks when gold rallied visibly and the HUI Index actually declined modestly. And now, gold stocks are trading close to their previous 2021 lows, while gold is almost right in the middle between its yearly high and its yearly low.
And why is this so important? Well, because the bearish implications of gold stocks’ extreme underperformance still remain intact.
Let’s keep in mind that the drastic underperformance of the HUI Index also preceded the bloodbath in 2008 as well as in 2012 and 2013. To explain, right before the huge slide in late September and early October 2008, gold was still moving to new intraday highs; the HUI Index was ignoring that, and then it declined despite gold’s rally. However, it was also the case that the general stock market suffered materially. If stocks didn’t decline so profoundly back then, gold stocks’ underperformance relative to gold would have likely been present but more moderate.
Nonetheless, broad head & shoulders patterns have often been precursors to monumental collapses. For example, when the HUI Index retraced a bit more than 61.8% of its downswing in 2008 and in between 50% and 61.8% of its downswing in 2012 before eventually rolling over, in both (2008 and 2012) cases, the final top – the right shoulder – formed close to the price where the left shoulder topped. And in early 2020, the left shoulder topped at 303.02. Thus, three of the biggest declines in the gold mining stocks (I’m using the HUI Index as a proxy here) all started with broad, multi-month head-and-shoulders patterns. And in all three cases, the size of the declines exceeded the size of the head of the pattern. As a reminder, the HUI Index recently completed the same formation.
Yes, the HUI Index moved back below the previous lows and the neck level of the formation, which – at face value – means that the formation was invalidated, but we saw a similar “invalidation” in 2000 and in 2013. And then, the decline followed anyway. Consequently, I don’t think that taking the recent move higher at its face value is appropriate. It seems to me that the analogies to the very similar situation from the past are more important.
As a result, we’re confronted with two bearish scenarios:
- If things develop as they did in 2000 and 2012-2013, gold stocks are likely to bottom close to their early-2020 low.
- If things develop like in 2008 (which might be the case, given the extremely high participation of the investment public in the stock market and other markets), gold stocks could re-test (or break slightly below) their 2016 low.
In both cases, the forecast for silver, gold, and mining stocks is extremely bearish for the next several months.
For even more confirmation, let’s compare the behavior of the GDX ETF and the GDXJ ETF. Regarding the former, investors rejected the senior miners (GDX) attempt to recapture their 50-day moving average and the failure was perfectly in tune with what I wrote on Sep. 7:
Large spikes in daily volume are often bearish, not bullish. To explain, three of the last four volume outliers preceded an immediate top (or near) for the GDX ETF, while the one that preceded the late July rally was soon followed by the GDX ETF’s 2020 peak. Thus, when investors go ‘all in,’ material declines often follow. And with that, spike-high volume during the GDX ETF’s upswings often presents us with great shorting opportunities.
Please see below:
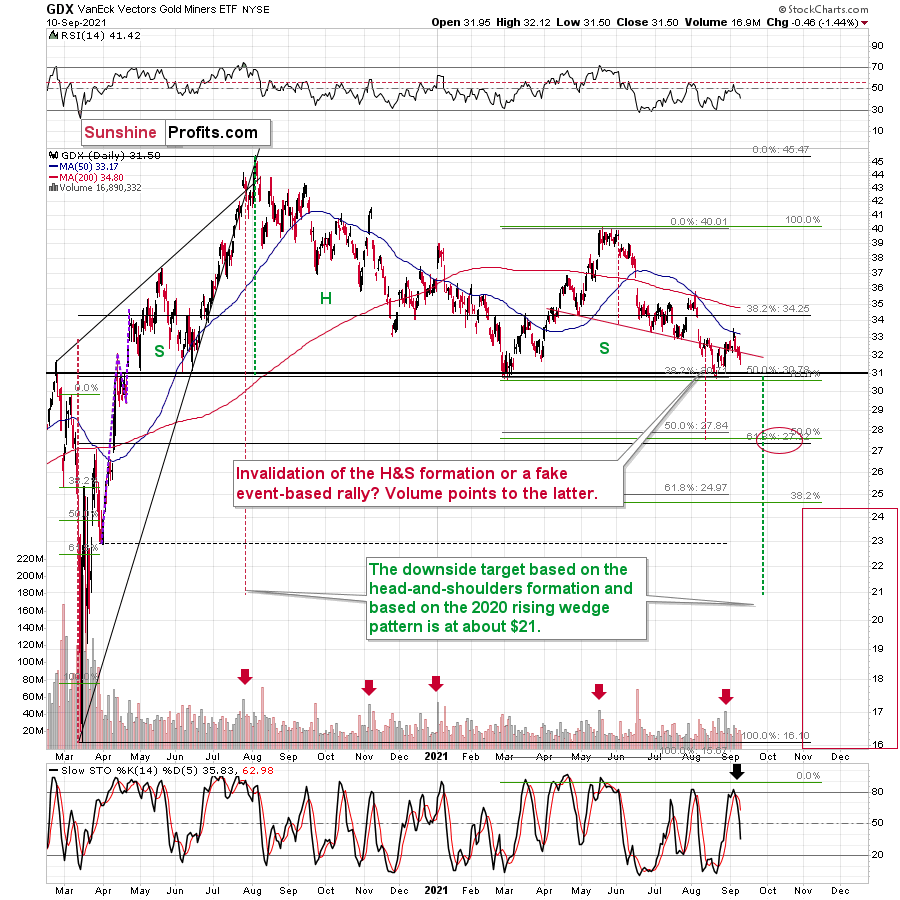
Even more bearish, not only did last week’s plunge usher the GDX ETF back below the neckline of its bearish head & shoulders pattern (the horizontal red line on the right side of the chart above), but the sell signal from the stochastic oscillator remains firmly intact. As a result, ominous clouds continue to form.
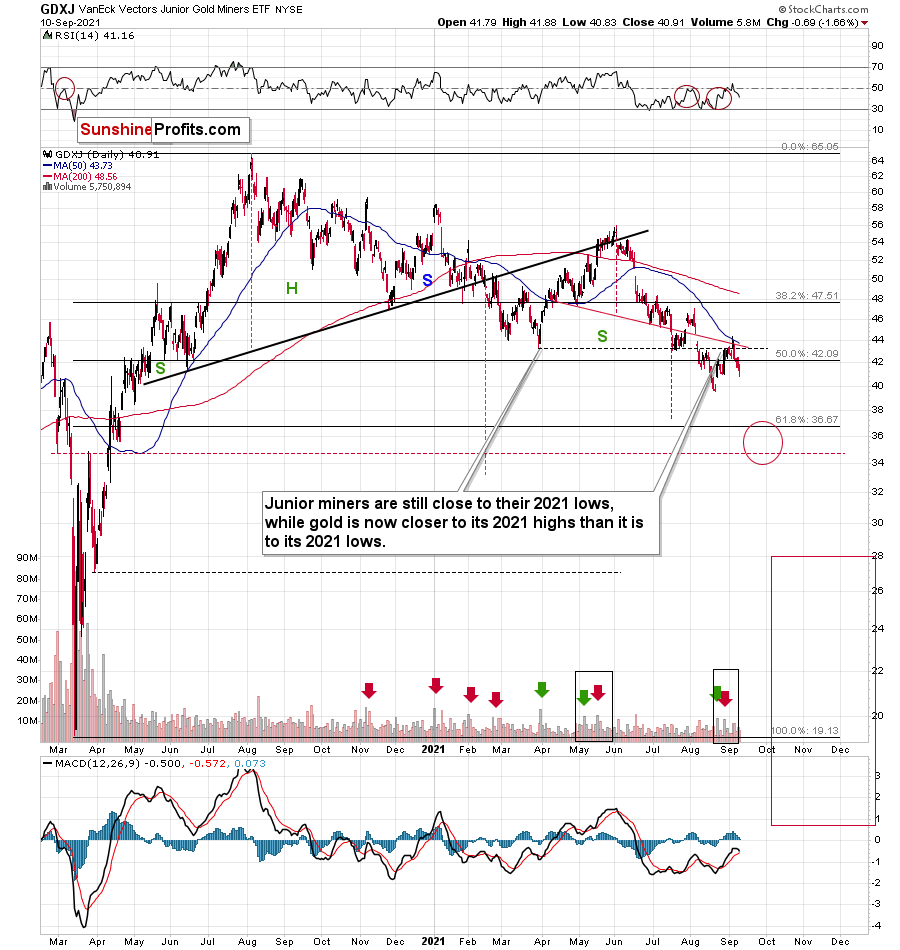
And with the GDXJ ETF stuck in a similar rut, I wrote on Sep. 7 that overzealous investors would likely end the week disappointed:
With the current move quite similar to the corrective upswing recorded in mid-May, the springtime bounce was also followed by a sharp drawdown. As a result, the GDXJ ETF could be near its precipice, as its 50-day moving average is right ahead. And with the key level now acting as resistance, investors’ rejection on Sep. 3 could indicate that the top is already here.
Moreover, while the junior miners followed the roadmap to perfection, the GDXJ ETF still remains ripe for lower lows over the medium term.
Please see below:
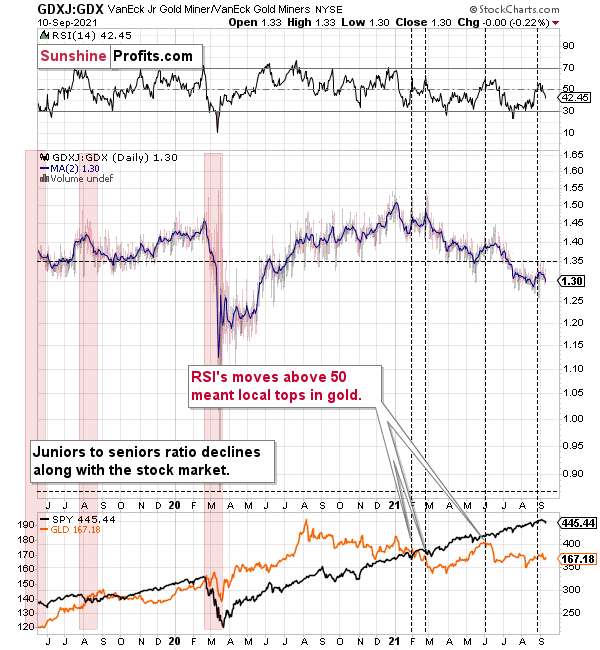
Finally, while I’ve been warning for months that the GDXJ/GDX ratio was destined for devaluation, after another sharp move lower last week, the downtrend remains intact. For example, when the ratio’s RSI jumped above 50 three times in 2021, it coincided with short-term peaks in gold. Second, the trend in the ratio this year has been clearly down, and there’s no sign of a reversal, especially when you consider that the ratio broke below its 2019 support (which served as resistance in mid-2020). When the same thing happened in 2020, the ratio then spiked even below 1.
More importantly, though, with the relative weakness likely to persist, the profits from our short position in the GDXJ ETF should accelerate during the autumn months.
The bottom line?
If the ratio is likely to continue its decline, then on a short-term basis we can expect it to decline to 1.27 or so. If the general stock market plunges, the ratio could move even lower, but let’s assume that stocks decline moderately (just as they did in the last couple of days) or that they do nothing or rally slightly. They’ve done all the above recently, so it’s natural to expect that this will be the case. Consequently, the trend in the GDXJ to GDX ratio would also be likely to continue, and thus expecting a move to about 1.26 - 1.27 seems rational.
If the GDX is about to decline to approximately $28 before correcting, then we might expect the GDXJ to decline to about $28 x 1.27 = $35.56 or $28 x 1.26 = $35.28. In other words, $28 in the GDX is likely to correspond to about $35 in the GDXJ.
Is there any technical support around $35 that would be likely to stop the decline? Yes. It’s provided by the late-Feb. 2020 low ($34.70) and the late-March high ($34.84). There’s also the late-April low at $35.63. Conservatively, I’m going to place the profit-take level just above the latter.
Consequently, it seems that expecting the GDXJ to decline to about $35 is justified from the technical point of view as well.
In conclusion, gold, silver, and mining stocks went from delighted to despondent, as the technical downpour continues to rain on their parade. And while a major buying opportunity may present itself in December, the next few months will likely elicit more tears than cheers. As a result, while we eagerly await the opportunity to go long the precious metals and participate in their secular uptrends, bearish breakdowns, stock market struggles, and the Fed’s taper timeline will likely dampen their moods over the medium term.
Thank you for reading our free analysis today. Please note that the above is just a small fraction of the full analyses that our subscribers enjoy on a regular basis. They include multiple premium details such as the interim target for gold that could be reached in the next few weeks. We invite you to subscribe now and read today’s issue right away.
Sincerely,
Przemyslaw Radomski, CFA
Founder, Editor-in-chief -
Gold Investment Update: Dovish Assassins of the USD Index
September 7, 2021, 8:52 AM“I’ve got you in my sights” – the USDX heard that a lot over the last two weeks. While it was bullish for gold, the dollar might take revenge soon.
With Fed Chairman Jerome Powell doubling down on his dovish dialogue on Aug. 27 and the Delta variant depressing U.S. nonfarm payrolls on Sep. 3, the stars aligned for a profound decline in the USD Index. However, while the greenback came under fire from all angles, the USD Index demonstrated immense resiliency in the face of adversity. Moreover, the bullish determination helped reinforce our expectation for another move higher over the medium term.
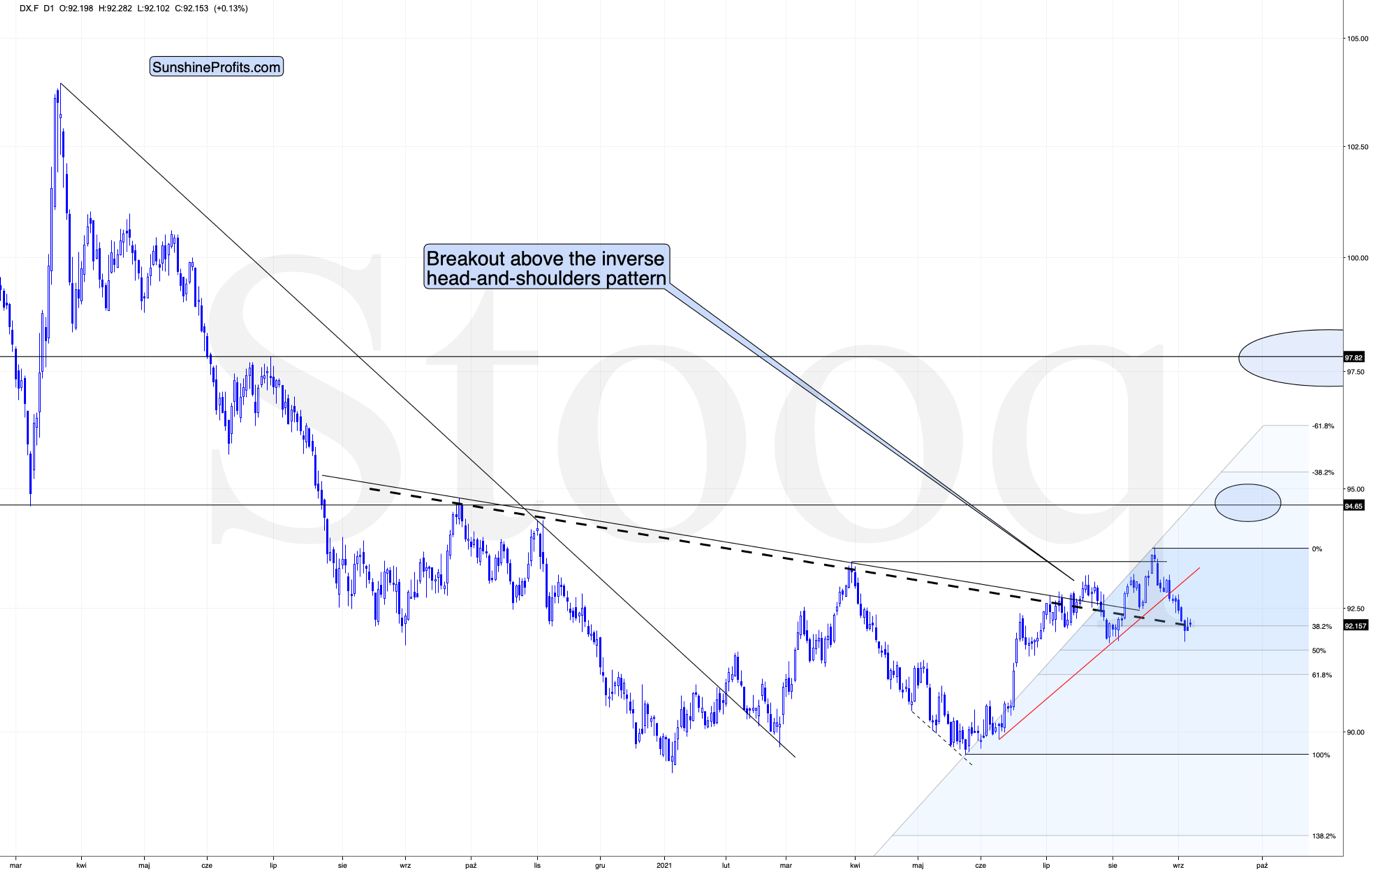
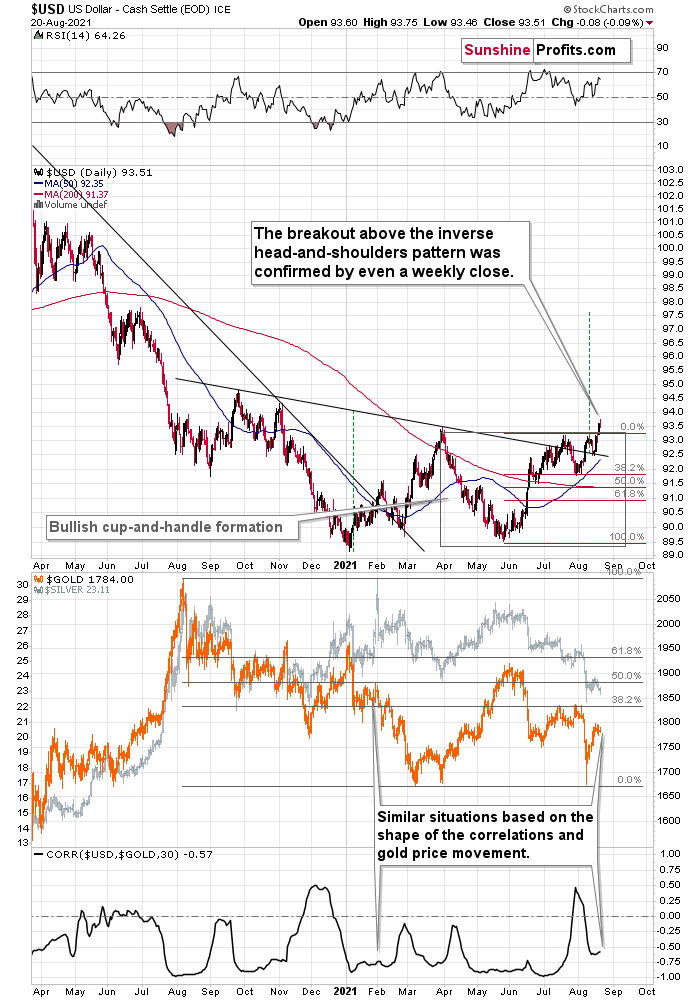
To explain, the USD Index suffered a breakdown below the neckline of its inverse (bullish) head & shoulders pattern on Sep. 3 (following the release of the payrolls). However, once cooler heads prevailed, the dollar basket recouped the key level during futures trading on Sep. 5/6/7. As a result, U.S. dollar sentiment still remains quite elevated, and at the moment of writing these words, the USD Index is trading back (not much but still) above the neck level of the pattern (dashed, thick line) that’s based on the closing prices.
Please see below:
No Pain, No Gain
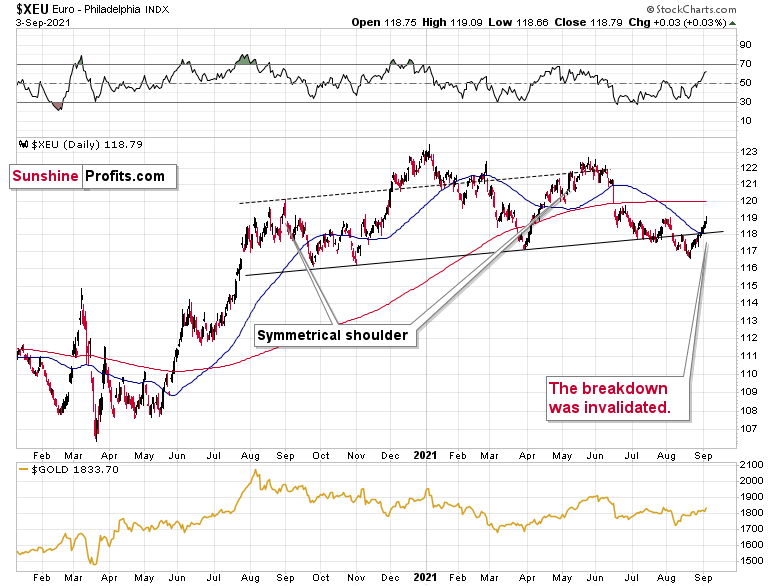
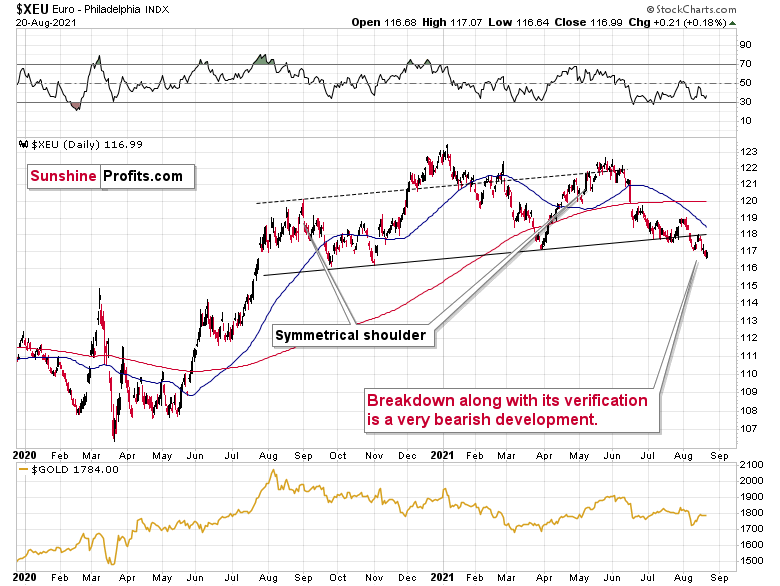
Furthermore, with the USD Index’s pain the Euro Index’s gain, the latter invalidated the breakdown below the neckline of its bearish H&S pattern. For context, the EUR/USD accounts for nearly 58% of the movement of the USD Index. And while the uprising is bad news for the greenback, could the Euro Index actually prolong gold, silver, and mining stocks’ party?
Well, for one, if I was trading the EUR/USD pair, I would be concerned about any short position that I might possibly have in this currency pair, and I could even close it based on this invalidation alone.
However, I’m not concerned about our short position in the junior miners at all because of the invalidation in the Euro Index. Why? Because of the situation in the USD Index and – most importantly – because of the way the mining stocks refuse to react to the USDX’s weakness right now. Thus, while the situation is worth monitoring, it’s unlikely to move the needle over the medium term.
Please see below:
What a Scorching Heat!
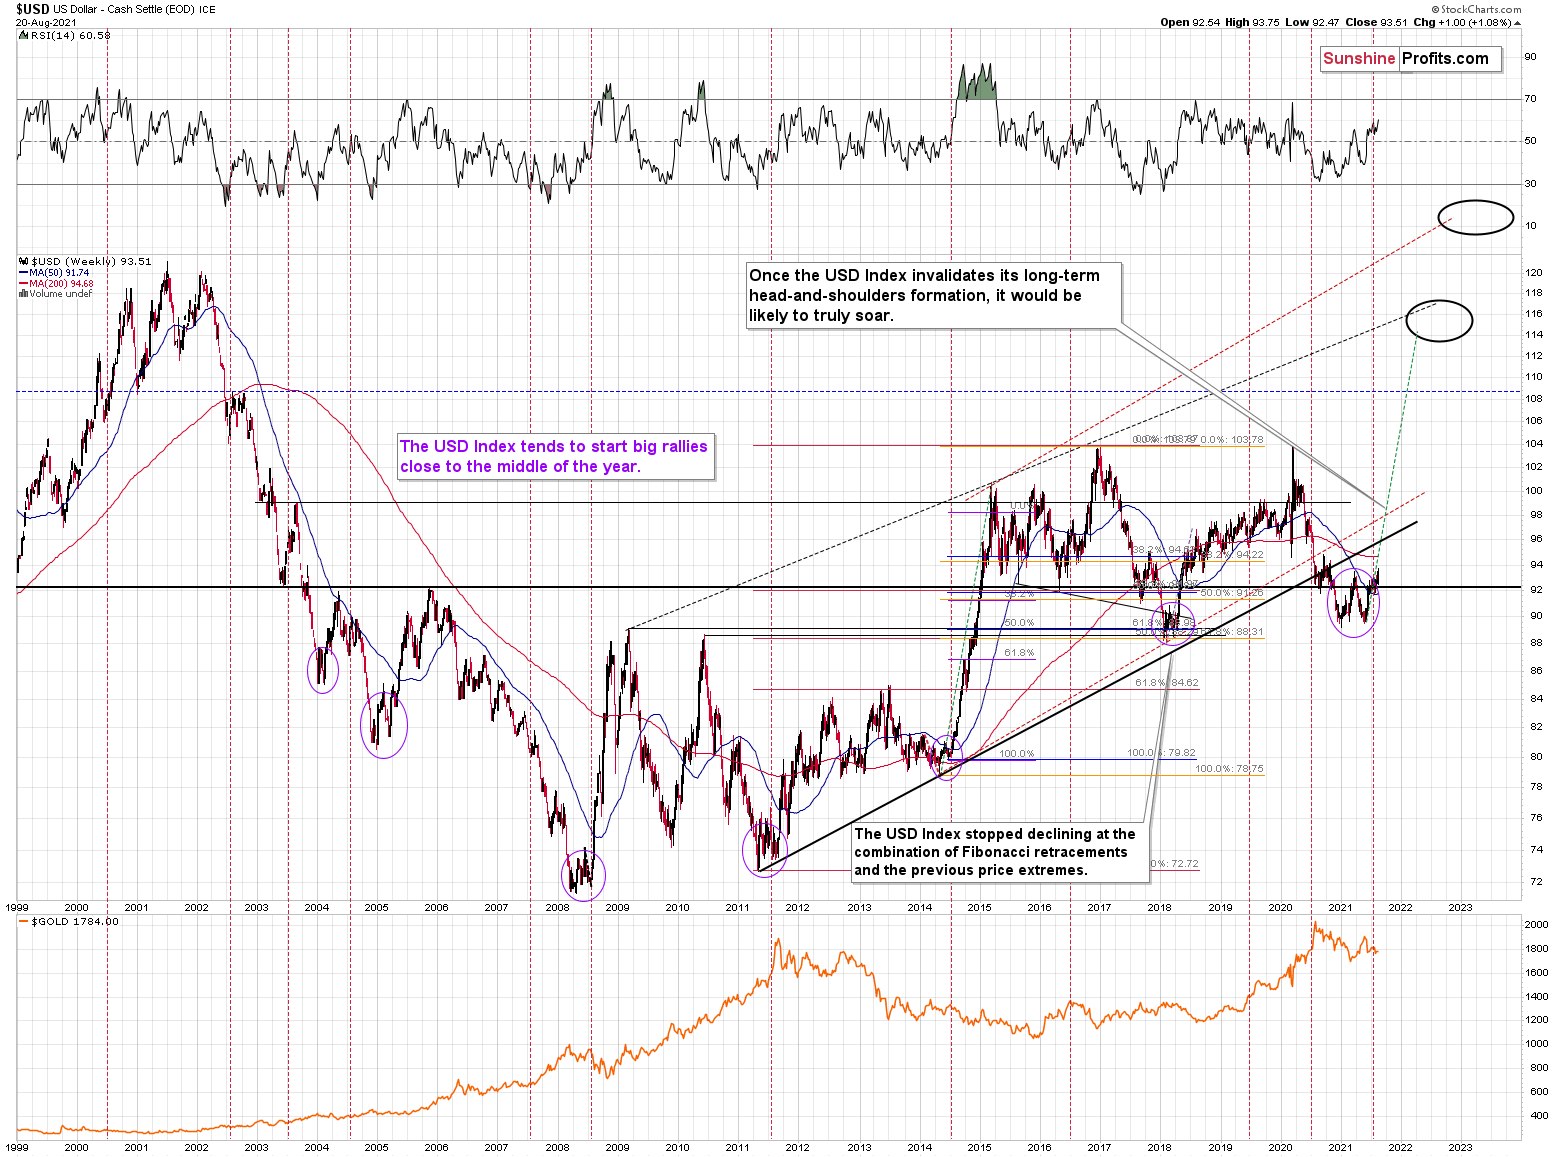
Adding to our confidence, the USD Index often sizzles in the summer sun and major USDX rallies often start during the middle of the year. Summertime spikes have been mainstays on the USD Index’s historical record and in 2004, 2005, 2008, 2011, 2014 and 2018 a retest of the lows (or close to them) occurred before the USD Index began its upward flights (which is exactly what’s happened this time around).
Furthermore, profound rallies (marked by the red vertical dashed lines below) followed in 2008, 2011 and 2014. With the current situation mirroring the latter, a small consolidation on the long-term chart is exactly what occurred before the USD Index surged in 2014. Likewise, the USD Index recently bottomed near its 50-week moving average; an identical development occurred in 2014. More importantly, though, with bottoms in the precious metals market often occurring when gold trades in unison with the USD Index (after ceasing to respond to the USD’s rallies with declines), we’re still far away from that milestone in terms of both price and duration.
Moreover, as the journey unfolds, the bullish signals from 2014 have resurfaced once again. For example, the USD Index’s RSI is hovering near a similar level (marked with red ellipses), and back then, a corrective downswing also occurred at the previous highs. More importantly, though, the short-term weakness was followed by a profound rally in 2014, and many technical and fundamental indicators signal that another reenactment could be forthcoming.
Please see below:
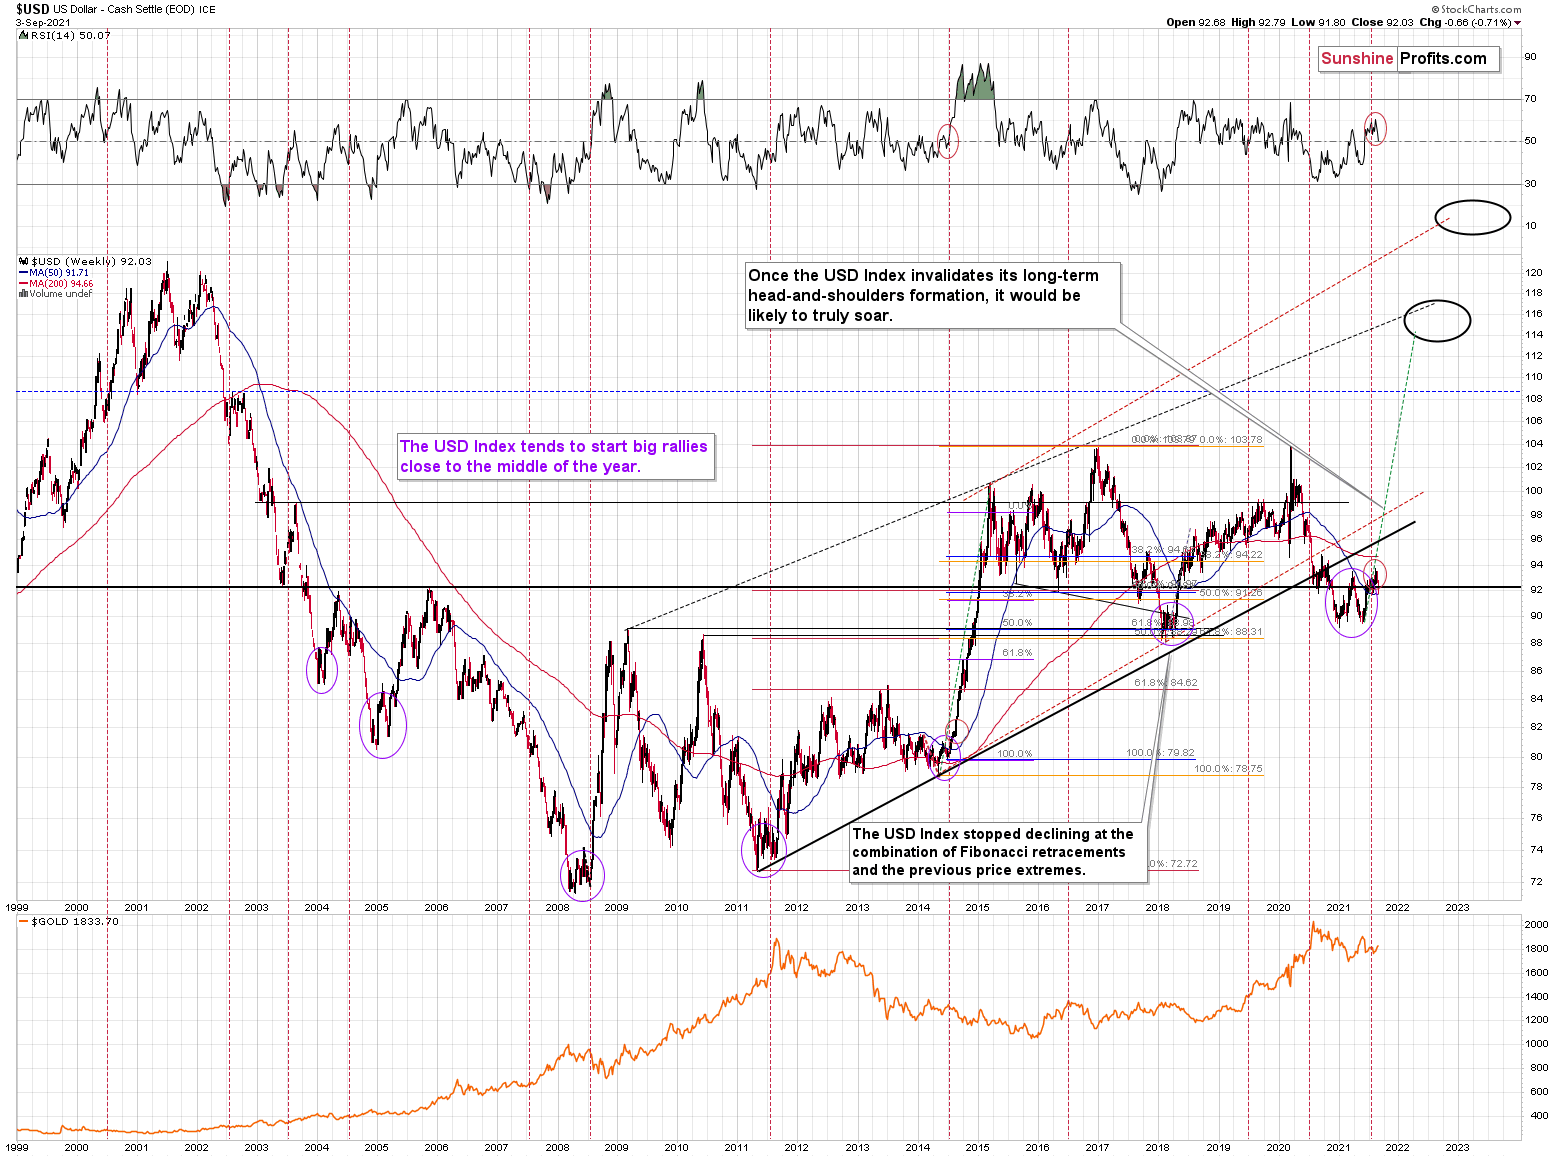
Just as the USD Index took a breather before its massive rally in 2014, it seems that we saw the same recently. This means that predicting higher gold prices (or the ones of silver)here is likely not a good idea.
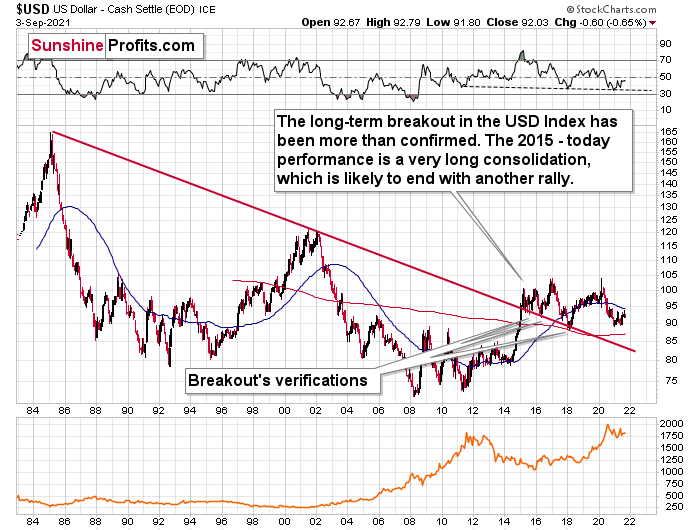
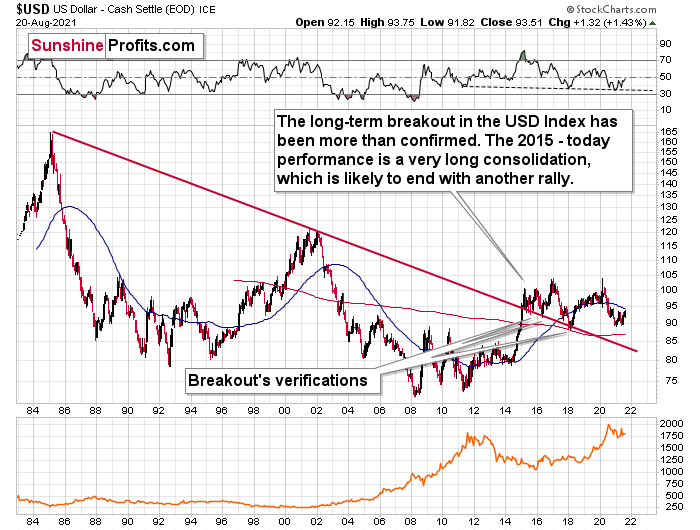
Continuing the theme, the eye in the sky doesn’t lie. And with the USDX’s long-term breakout clearly visible, the wind still remains at the greenback’s back.
Please see below:
The bottom line?
Once the momentum unfolds, ~94.5 is likely the USD Index’s first stop, ~98 is likely the next stop, and the USDX will likely exceed 100 at some point over the medium or long term. Keep in mind though: we’re not bullish on the greenback because of the U.S.’ absolute outperformance. It’s because the region is fundamentally outperforming the Eurozone, the EUR/USD accounts for nearly 58% of the movement of the USD Index, and the relative performance is what really matters.
In conclusion, the USD Index was a marked man over the last two weeks, and the dovish assassins had the dollar basket right in their crosshairs. And while the barrage of bullets fired at the greenback was bullish for gold, silver and mining stocks, the former’s ability to escape the infirmary highlights the shift in sentiment surrounding the USD Index. As a result, with technicals, fundamentals and sentiment supporting a stronger U.S. dollar over the medium term, the precious metals won the recent very short-term battle, but they’re still unlikely to win the medium-term war. Of course, I continue to think that gold is going to soar in the following years, but not before declining profoundly first. At the moment of writing these words, gold futures are already down over $15 from their Friday’s close and about $20 below their last week’s high – it could be the case that the news-based rally is already over.
Thank you for reading our free analysis today. Please note that the above is just a small fraction of the full analyses that our subscribers enjoy on a regular basis. They include multiple premium details such as the interim target for gold that could be reached in the next few weeks. We invite you to subscribe now and read today’s issue right away.
Sincerely,
Przemyslaw Radomski, CFA
Founder, Editor-in-chief -
Gold Investment Update: Bittersweet Truth for Gold Stocks – What You Need to Know
August 30, 2021, 9:19 AMWhen the Fed entices grown up kids with sweet words, they hit the candy store and stock up on gold, silver, and stocks. A sugar hangover follows.
Beware of the candyman!
With Fed Chairman Jerome Powell performing his usual dovish dance on Aug. 27, gold, silver, and mining stocks were like kids in a candy store. However, with the short-term sugar highs often leaving investors with nasty stomach aches, the sweet-and-sour nature of the precious metals’ performances may lead to pre-Halloween hangovers.
HUI Index: Harbinger of Things to Come
To explain, while the HUI Index invalidated the breakdown below its previous lows, the bullish reversal may seem quite sanguine. However, an identical development occurred in 2013 right before the index continued its sharp decline. Moreover, I warned previously that the HUI Index could record a corrective upswing of 4% to 8% (that’s what happened after the breakdown in 2013) and that it would not change the medium-term implications. And after the index rallied by more than 6% last week, the bounce is nothing to write home about.
Furthermore, after recording a similar breakdown below the neckline of its bearish H&S pattern in 2000, a short-term corrective upswing followed before the HUI Index resumed its swift decline. As a result, gold, silver, and mining stocks may not behave like Jolly Ranchers for much longer.
Please see below:
What’s more, the vertical, dashed lines above demonstrate how the HUI Index is mirroring its decline from 2012-2013. After a slight buy signal from the stochastic indicator in 2012, the short-term pause was followed by another sharp drawdown. For context, after the HUI Index recorded a short-term buy signal in late 2012 – when the index’s stochastic indicator was already below the 20 level (around 10) and the index was in the process of forming the right shoulder of a huge, medium-term head-and-shoulders pattern – the index moved slightly higher, consolidated, and then fell off a cliff. Thus, the HUI Index is quite likely to decline to its 200-week moving average (or so) before pausing and recording a corrective upswing. That’s close to the 220 level. Thereafter, the index will likely continue its bearish journey and record a final medium-term low some time in December.
Furthermore, I warned previously that the miners’ drastic underperformance of gold was an extremely bearish sign. There were several weeks when gold rallied visibly and the HUI Index actually declined modestly. Last week, we finally saw gold miners moving back up along with gold. But just like one swallow doesn’t make a summer, this move up doesn’t change the fact, that in general, performance of gold stocks has been truly terrible.
After all, gold stocks are trading close to their previous 2021 lows, while gold is almost right in the middle between its yearly high and its yearly low.
And why is this quote so important? Well, because the bearish implications of gold stocks’ extreme underperformance still remain intact.
Let’s keep in mind that the drastic underperformance of the HUI Index also preceded the bloodbath in 2008 as well as in 2012 and 2013. To explain, right before the huge slide in late September and early October 2008, gold was still moving to new intraday highs; the HUI Index was ignoring that, and then it declined despite gold’s rally. However, it was also the case that the general stock market suffered materially. If stocks didn’t decline so profoundly back then, gold stocks’ underperformance relative to gold would have likely been present but more moderate.
Nonetheless, broad head & shoulders patterns have often been precursors to monumental collapses. For example, when the HUI Index retraced a bit more than 61.8% of its downswing in 2008 and in between 50% and 61.8% of its downswing in 2012 before eventually rolling over, in both (2008 and 2012) cases, the final top – the right shoulder – formed close to the price where the left shoulder topped. And in early 2020, the left shoulder topped at 303.02. Thus, three of the biggest declines in the gold mining stocks (I’m using the HUI Index as a proxy here) all started with broad, multi-month head-and-shoulders patterns. And in all three cases, the size of the declines exceeded the size of the head of the pattern. As a reminder, the HUI Index recently completed the same formation.
Yes, the HUI Index moved back below the previous lows and the neck level of the formation, which – at face value – means that the formation was invalidated, but we saw a similar “invalidation” in 2000 and in 2013. And then, the decline followed anyway. Consequently, I don’t think that taking the recent move higher at its face value is appropriate. It seems to me that the analogies to the very similar situation from the past are more important.
As a result, we’re confronted with two bearish scenarios:
- If things develop as they did in 2000 and 2012-2013, gold stocks are likely to bottom close to their early-2020 low.
- If things develop like in 2008 (which might be the case, given the extremely high participation of the investment public in the stock market and other markets), gold stocks could re-test (or break slightly below) their 2016 low.
In both cases, the forecast for silver, gold, and mining stocks is extremely bearish for the next several months.
GDX and GDXJ Comparison
For even more confirmation, let’s compare the behavior of the GDX ETF and the GDXJ ETF. Regarding the former, the senior miners (GDX) also rallied above the neckline of their bearish H&S pattern. And while Friday’s (Aug. 27) euphoria occurred on high volume, prior volume spikes in buying sentiment actually marked four peaks (or close to) within the last 12 months. Thus, while the bullish bids may push the GDX ETF slightly higher in the near term, history implies that investors’ excitement often does more harm than good.
Please see below:
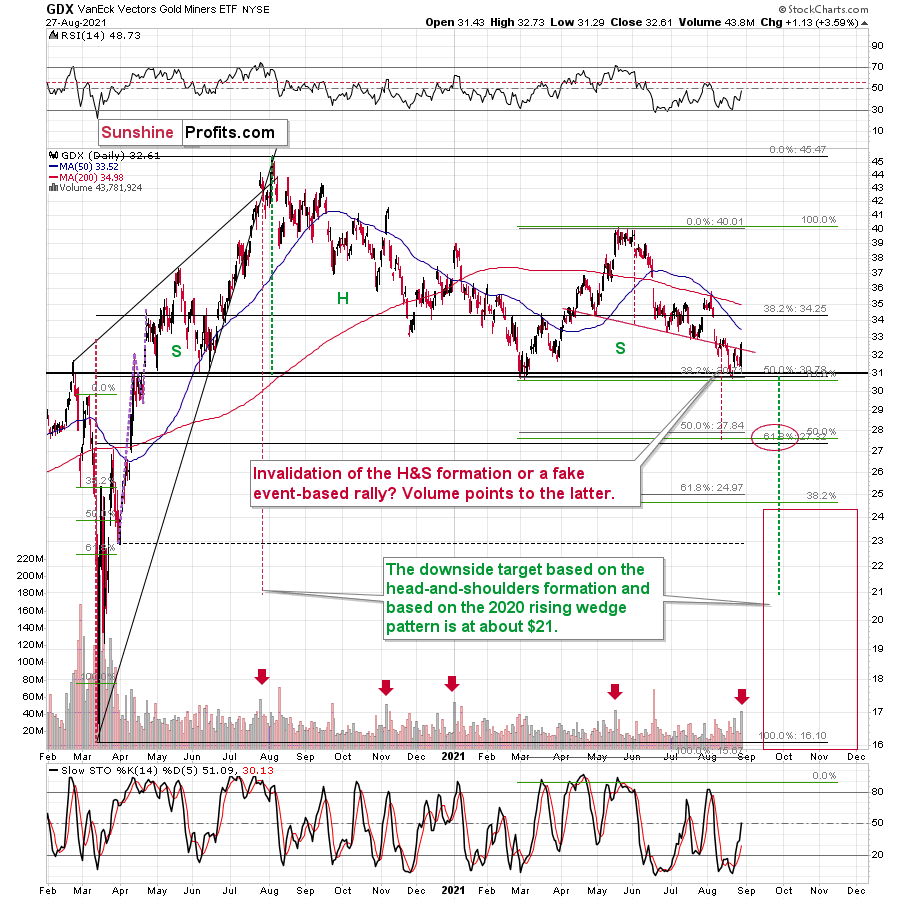
In all 4 out of previous 4 cases, the spike-high volume during GDX’s upswing meant a great shorting opportunity.
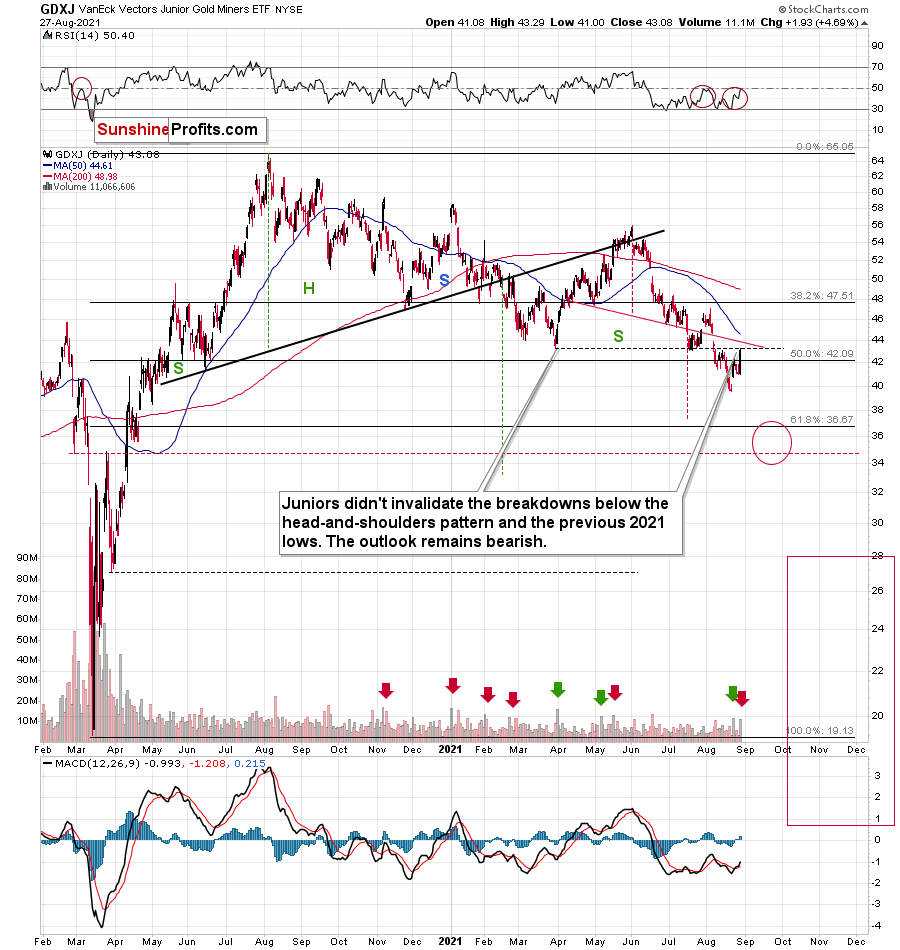
Meanwhile, the junior miners (GDXJ) didn’t invalidate the breakdown below the neckline of their bearish H&S pattern; and Friday’s close still left the GDXJ ETF below its previous lows. Moreover, while the juniors’ future direction following volume spikes isn’t quite as clear as it is with the GDX ETF, more often than not, euphoric spikes are followed by medium-term declines.
Please see below:
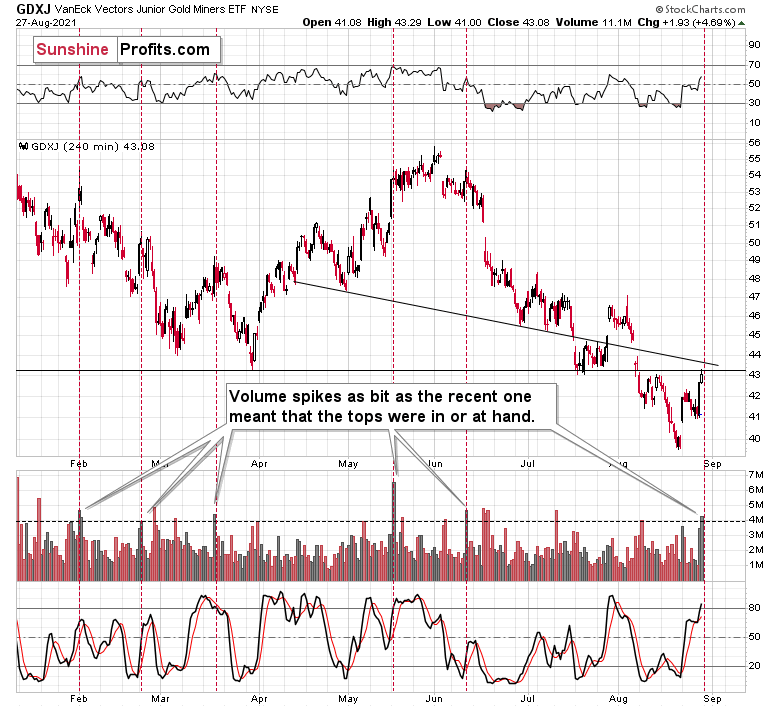
As further evidence, if you analyze the GDXJ ETF’s four-hour chart below, you can see that historical volume spikes (marked by the red vertical dashed lines) nearly always coincide with short-term peaks. As a result, Friday’s rally was more of an event driven surge – courtesy of Powell – and it’s unlikely to disrupt the GDXJ ETF’s medium-term downtrend.
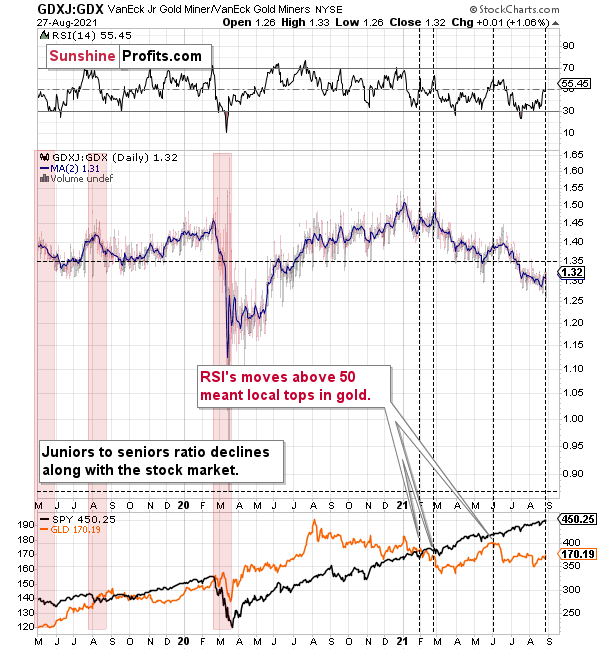
Finally, while the GDXJ/GDX ratio moved slightly higher last week, its downtrend also remains intact. For one, when the ratio’s RSI jumped above 50 three times in 2021, it coincided with short-term peaks in gold. Second, the trend in the ratio this year has been clearly down, and there’s no sign of a reversal, especially when you consider that the ratio broke below its 2019 support (which served as resistance in mid-2020). When the same thing happened in 2020, the ratio then spiked even below 1.
Please see below:
The Bottom Line?
If the ratio is likely to continue its decline, then on a short-term basis we can expect it to decline to 1.27 or so. If the general stock market plunges, the ratio could move even lower, but let’s assume that stocks decline moderately (just as they did in the last couple of days) or that they do nothing or rally slightly. They’ve done all the above recently, so it’s natural to expect that this will be the case. Consequently, the trend in the GDXJ to GDX ratio would also be likely to continue, and thus expecting a move to about 1.26 - 1.27 seems rational.
If the GDX is about to decline to approximately $28 before correcting, then we might expect the GDXJ to decline to about $28 x 1.27 = $35.56 or $28 x 1.26 = $35.28. In other words, $28 in the GDX is likely to correspond to about $35 in the GDXJ.
Is there any technical support around $35 that would be likely to stop the decline? Yes. It’s provided by the late-Feb. 2020 low ($34.70) and the late-March high ($34.84). There’s also the late-April low at $35.63. Conservatively, I’m going to place the profit-take level just above the latter.
Consequently, it seems that expecting the GDXJ to decline to about $35 is justified from the technical point of view as well.
In conclusion, investors showcased their sweet tooth for gold, silver, and mining stocks on Aug. 27. However, with the USD Index hovering near two key support levels and the yellow metal confronting its second triangle-vertex-based reversal point, the taste may turn bitter over the medium term. Moreover, with prior upswings underwritten by the Fed resulting in lower lows soon after, the precious metals’ bullish behavior is nothing new. As a result, their prior weakness will likely persist before reliable bottoms emerge later this year.
Thank you for reading our free analysis today. Please note that the above is just a small fraction of the full analyses that our subscribers enjoy on a regular basis. They include multiple premium details such as the interim target for gold that could be reached in the next few weeks. We invite you to subscribe now and read today’s issue right away.
Sincerely,
Przemyslaw Radomski, CFA
Founder, Editor-in-chief -
Gold Investment Update: USDX Resurgence - Don’t Let It Catch You Flat-Footed!
August 23, 2021, 9:26 AMWith its negative correlation to the metals, the USDX rally weighed heavily on gold, silver and stocks. Stop and think: what would be if it continued?
While the overwhelming majority of investors entered 2021 with a bearish outlook for the U.S. dollar, our optimism has proved quite prescient. The USDX bottomed at the beginning of the year. With the USD Index hitting a new 2021 high last week – combined with the EUR/USD, the GDX ETF, the GDXJ ETF, and the price of silver (in terms of the closing prices) hitting new 2021 lows – the ‘pain trade’ has caught many market participants flat-footed. Even silver stocks (the SIL ETF) closed at new yearly lows.
Moreover, after the USD Index surged above the neckline of its inverse (bullish) head & shoulders pattern and confirmed the breakout above its cup and handle pattern, the combination of new daily and weekly highs is quite a bullish cocktail. Given all that, even if a short-term pullback materializes, the USDX remains poised to challenge ~97.5 - 98 over the medium term — perhaps even over the short term (next several weeks).
Please see below:
Furthermore, as the USD Index seeks higher ground, the euro has fallen off a cliff. For context, the EUR/USD accounts for nearly 58% of the movement of the USD Index, and that’s why the currency pair’s performance is so important. If you analyze the chart below, you can see that the Euro Index has confirmed the breakdown below its bearish head & shoulders pattern, and the ominous event was further validated after the back-test of the breakdown failed and the Euro Index hit a new 2021 low.
Please see below:
Eye In the Sky Doesn’t Lie
What is signaling trouble for dollar bears as well, the USD Index often sizzles in the summer sun and major USDX rallies often start during the middle of the year. Summertime spikes have been mainstays on the USD Index’s historical record and in 2004, 2005, 2008, 2011, 2014 and 2018 a retest of the lows (or close to them) occurred before the USD Index began its upward flights (which is exactly what’s happened this time around).
What’s more, profound rallies (marked by the red vertical dashed lines below) followed in 2008, 2011 and 2014. With the current situation mirroring the latter, a small consolidation on the long-term chart is exactly what occurred before the USD Index surged in 2014. Likewise, the USD Index recently bottomed near its 50-week moving average; an identical development occurred in 2014. More importantly, though, with bottoms in the precious metals market often occurring when gold trades in unison with the USD Index (after ceasing to respond to the USD’s rallies with declines), we’re still far away from that milestone in terms of both price and duration.
Just as the USD Index took a breather before its massive rally in 2014, it seems that we saw the same recently. This means that predicting higher gold prices here is likely not a good idea.
Ok, but didn’t we just see strength in gold – the one that you just wrote about? The USD Index soared last week by a full index point, and yet gold didn’t decline…
That’s a good question, but the context is very important when analyzing specific price moves and their relative strengths. As I wrote earlier, we saw new yearly lows in practically every other important asset used for determining next moves in the precious metals sector: the EUR/USD, silver, and mining stocks (including practically all noteworthy ETFs and indices). So, did gold really show strength by not declining despite the USD’s strength, or was gold’s performance just a small, local deviation from the ongoing trend? Since practically everything else points to lower PM prices in the next weeks, the latter is more probable.
Besides, there are both: technical and fundamental reasons for gold to behave in this way right now.
The technical reason comes from the looming triangle-vertex-based turning point in gold, which is due today.
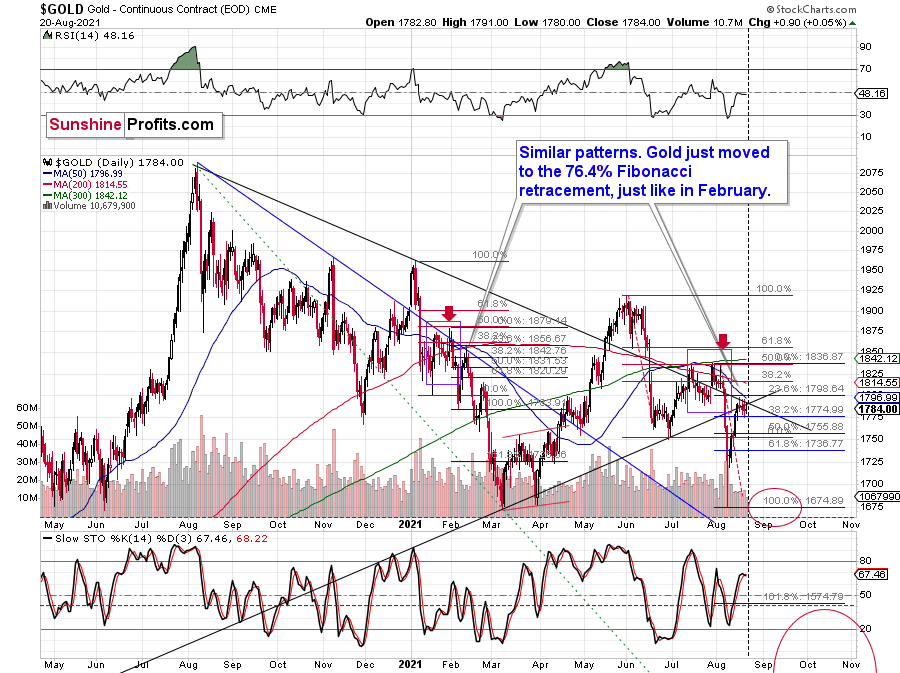
The rising black support line starts at the 2020 low, which is not visible on the chart.
Since these points work on a near-to basis, we might see a turnaround today or within the next few days.
Seen Anything on the News Recently?
Fundamentally, did anything important from the geopolitical point of view happen recently? Like, for example, the U.S. withdrawing from Afghanistan? Exactly…
Geopolitical events tend to impact gold much more than they impact other parts of the precious metals sector, which serves as a perfect explanation of why gold didn’t decline along with the rest of the PMs. As a reminder, geopolitical events usually have a visible but temporary impact on the gold price. They change its short-term price moves, but they don’t change the forecast for gold in general.
Consequently, it was not really the strength in gold vs. the USD Index that took place last week. It was a mix of the above and gold’s weakness relative to what happened in a geopolitical arena sprinkled with technicals. All in all, it’s not bullish for the PMs.
On top of that, the eye in the sky doesn’t lie. And with the USDX’s long-term breakout clearly visible, the smart money is already backing the greenback.
Please see below:
Finally, while short covering helped propel the USD Index higher last week, speculators’ positioning still has room to run. For example, while the latest Commitments of Traders (COT) report shows that net-positioning (long 19,211 contracts) by non-commercial (speculative) futures traders is near its 2021 highs, enthusiasm for the U.S. dollar is still well below the highs witnessed in previous years.
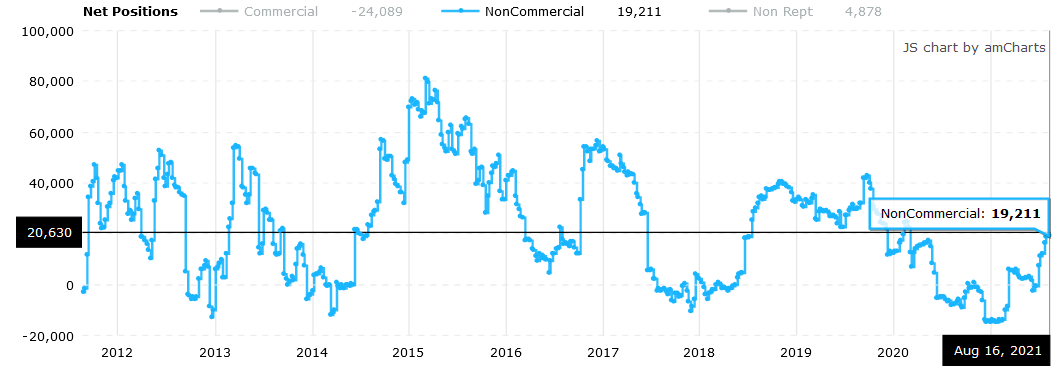 Source: COT
The bottom line?
Once the momentum unfolds, ~94.5 is likely the USD Index’s first stop, ~98 is likely the next stop, and the USDX will likely exceed 100 at some point over the medium or long term. Keep in mind though: we’re not bullish on the greenback because of the U.S.’ absolute outperformance. It’s because the region is fundamentally outperforming the Eurozone, the EUR/USD accounts for nearly 58% of the movement of the USD Index, and the relative performance is what really matters.
In conclusion, the U.S. dollar’s resurgence has weighed heavily on gold, silver and mining stocks. And with the technicals, fundamentals and shifting sentiment supporting a higher USD Index over the medium term, the metals’ strong negative correlation with the U.S. dollar should give investors a cause for pause. To that point, while we’re bullish on gold, silver and mining stocks’ long-term prospects, sharp declines will likely materialize over the medium term before they continue their secular uptrends.
Thank you for reading our free analysis today. Please note that the above is just a small fraction of the full analyses that our subscribers enjoy on a regular basis. They include multiple premium details such as the interim target for gold that could be reached in the next few weeks. We invite you to subscribe now and read today’s issue right away.
Sincerely,
Przemyslaw Radomski, CFA
Founder, Editor-in-chief -
Gold Investment Update: The General Left Alone
August 16, 2021, 11:18 AMGold commanded its unit to make another raid only to find itself stranded. The gold miners had already fled as fugitives, retreating without orders.
The Gold Miners
While gold shrugged off the Aug. 8 ‘flash crash’ and bounced back above its June lows, the yellow metal’s renewed sense of swagger hasn’t been mimicked by its precious metals peers. For example, while gold ended the week up by 0.86%, the GDXJ ETF (our short position) ended the week down by 1.72%.
Please see below:
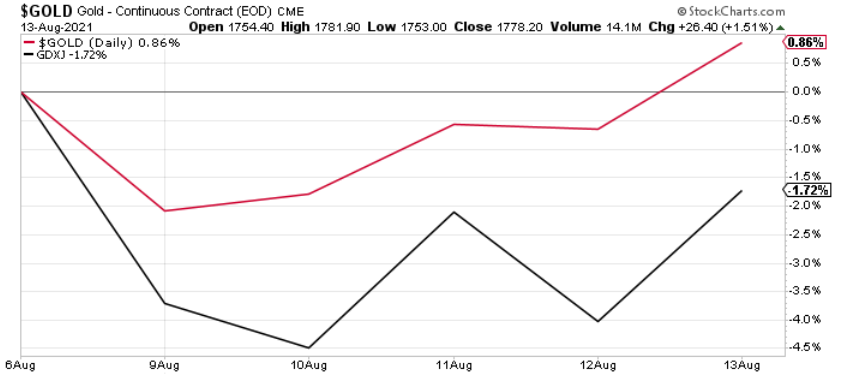
Furthermore, while gold jumped by roughly $15 last week, the HUI Index declined by five index points. And with the bearish underperformance often a precursor to profound medium-term drawdowns, the precious metals are behaving like its 2012-2013. Last week is yet another confirmation of the analogy.
Case in point: after the HUI Index recorded a short-term buy signal in late 2012 – when the index’s stochastic indicator was already below the 20 level (around 10) and the index was in the process of forming the right shoulder of a huge, medium-term head-and-shoulders pattern – the index moved slightly higher, consolidated, and then fell off a cliff.
Please see below:
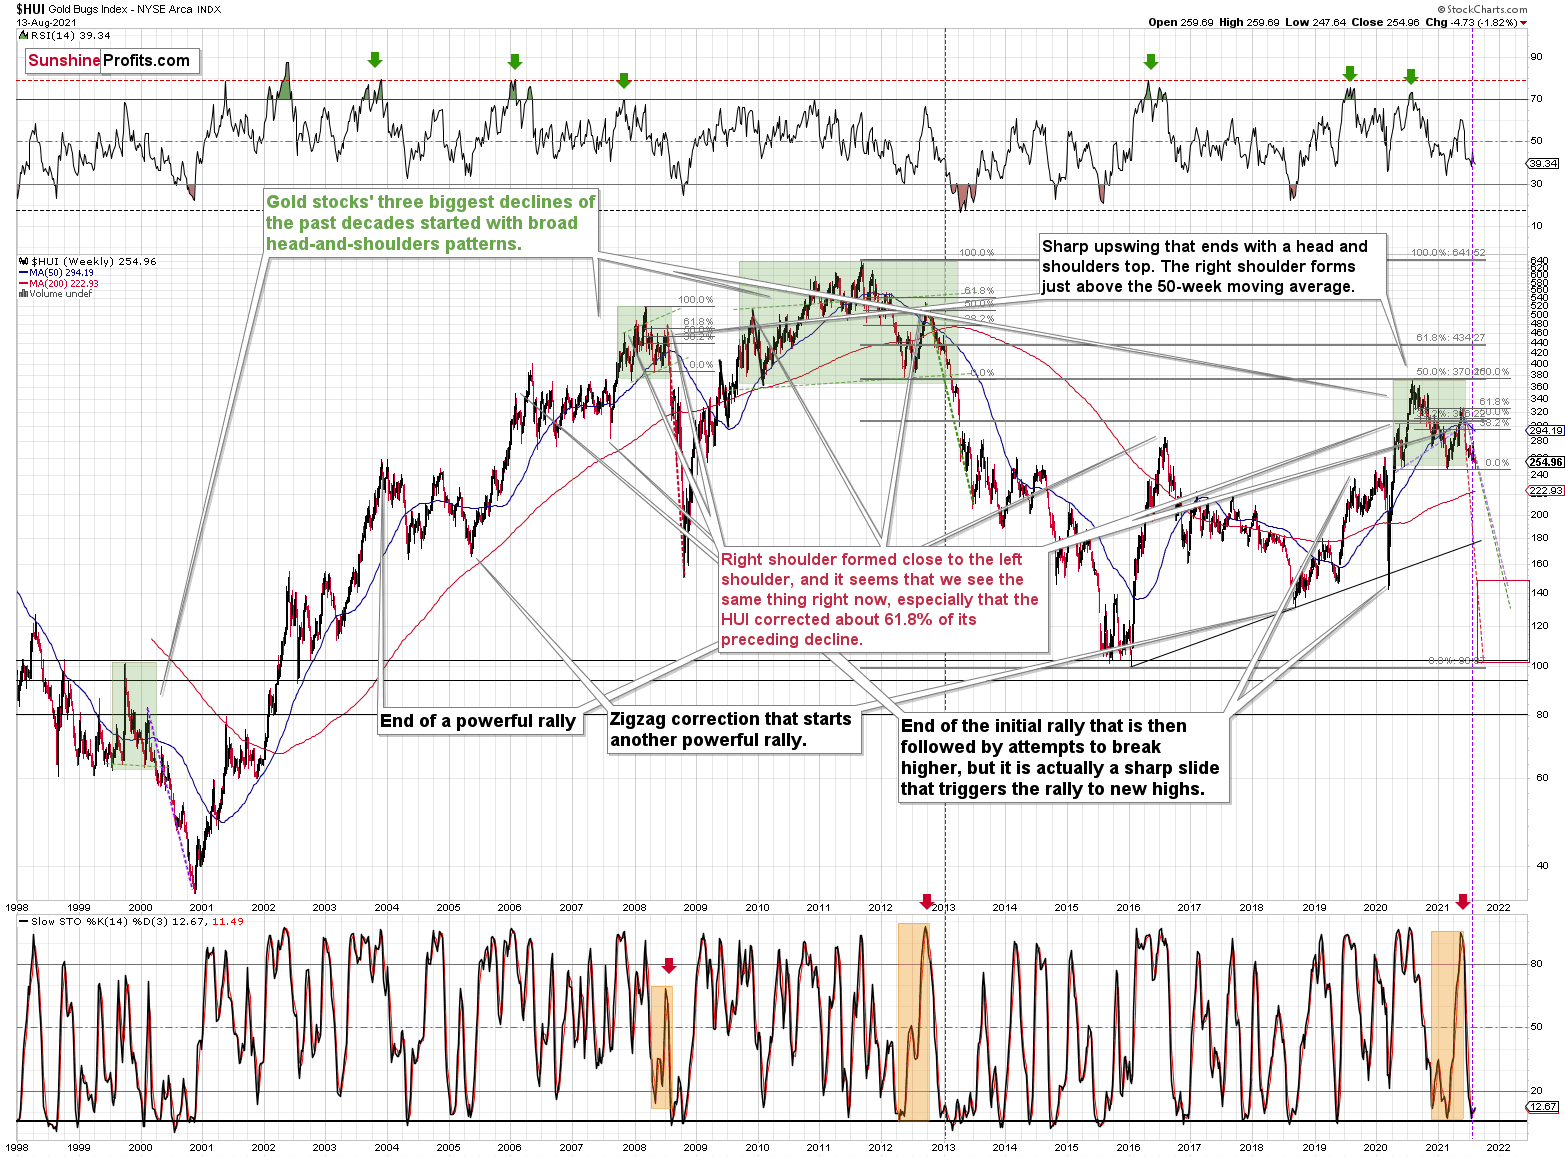
To explain, can you see the HUI’s rally at the end of 2012 that followed a small buy signal from the stochastic indicator? I marked it with a purple, dashed line. No? That’s because it’s been practically nonexistent. The HUI Index moved higher by so little that it’s impossible to see it from the long-term point of view. On top of that, with the shape of gold’s recent price action, its RSI, and its MACD indicators all mirroring the bearish signals that we witnessed back in December 2012, the current setup signals that we’re likely headed for a similar swoon.
For context, I warned previously that the miners’ drastic underperformance of gold was an extremely bearish sign. I wrote the following about the week beginning on May 24:
(…) gold rallied by almost $30 ($28.60) and at the same time, the HUI – a flagship proxy for the gold stocks… Declined by 1.37. In other words, gold stocks completely ignored gold’s gains. That shows exceptional weakness on the weekly basis and is a very bearish sign for the following weeks.
And why is this quote so important? Well, because the bearish phenomenon still remains intact. As mentioned, with gold rising by roughly $15 and the HUI Index declining by about five index points, the bearish underperformance is accelerating. Precisely, something similar happened during the week beginning on July 6. The gold price rallied by $27.40, and the HUI Index declined by 1.39. As a result, with the HUI Index’s ominous signals still present, if history rhymes (as it tends to), medium-term support will likely materialize in the 100-to-150 range. For context, high-end 2020 support implies a move back to 150, while low-end 2015 support implies a move back to 100. And yes, it could really happen, even though such predictions seem unthinkable.
In addition, the drastic underperformance of the HUI Index also preceded the bloodbath in 2008. To explain, right before the huge slide in late September and early October, gold was still moving to new intraday highs; the HUI Index was ignoring that, and then it declined despite gold’s rally. However, it was also the case that the general stock market suffered materially. If stocks didn’t decline back then so profoundly, gold stocks’ underperformance relative to gold would have likely been present but more moderate.
Nonetheless, bearish head & shoulders patterns have often been precursors to monumental collapses. For example, when the HUI Index retraced a bit more than 61.8% of its downswing in 2008 and in between 50% and 61.8% of its downswing in 2012 before eventually rolling over, in both (2008 and 2012) cases, the final top – the right shoulder – formed close to the price where the left shoulder topped. And in early 2020, the left shoulder topped at 303.02. Thus, three of the biggest declines in the gold mining stocks (I’m using the HUI Index as a proxy here) all started with broad, multi-month head-and-shoulders patterns. And in all three cases, the size of the declines exceeded the size of the head of the pattern.
Furthermore, when the HUI Index peaked on Sep. 21, 2012, that was just the initial high in gold. At that time, the S&P 500 was moving back and forth with lower highs. And what was the eventual climax? Well, gold made a new high before peaking on Oct. 5. In conjunction, the S&P 500 almost (!) moved to new highs, and despite bullish tailwinds from both parties, the HUI Index didn’t reach new heights. The bottom line? The similarity to how the final counter-trend rally ended in 2012 (and to a smaller extent in 2008) remains uncanny.
As a result, we’re confronted with two bearish scenarios:
- If things develop as they did in 2000 and 2012-2013, gold stocks are likely to bottom close to their early-2020 low.
- If things develop like in 2008 (which might be the case, given the extremely high participation of the investment public in the stock market and other markets), gold stocks could re-test (or break slightly below) their 2016 low.
In both cases, the forecast for silver, gold, and mining stocks is extremely bearish for the next several months.
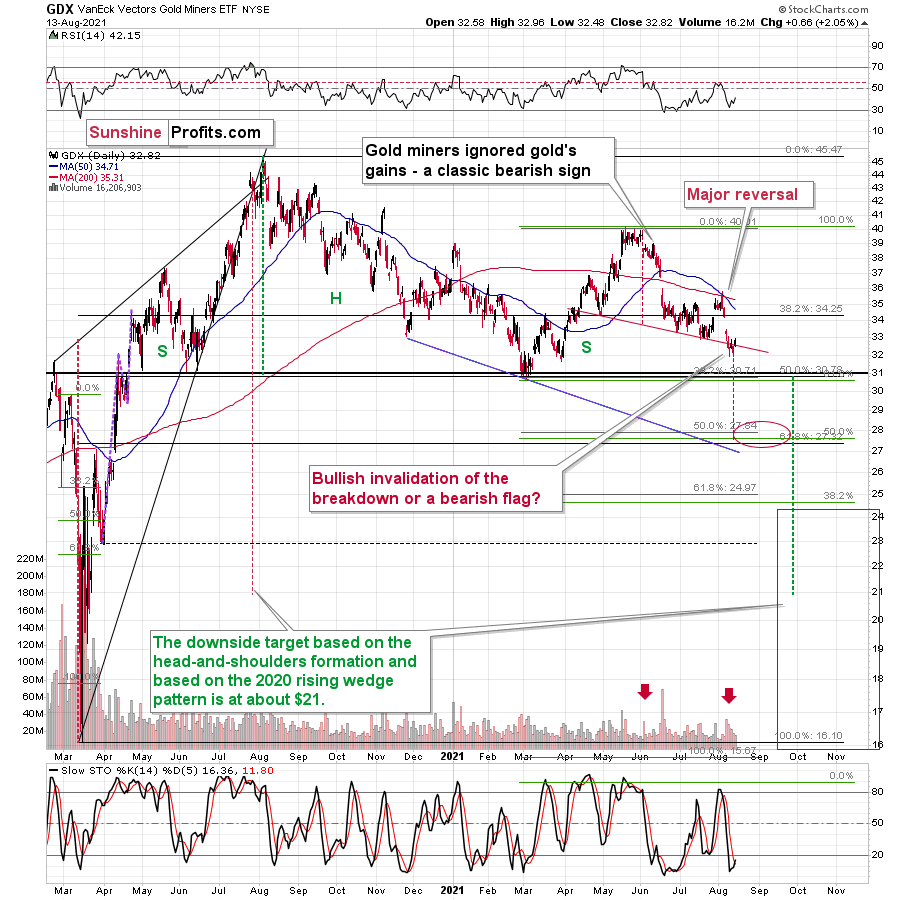
As further evidence, let’s compare the behavior of the GDX ETF and the GDXJ ETF. Regarding the former, the senior miners (GDX) are in the midst of forming an ominous bear flag and the volume that accompanied Friday’s (Aug. 13) corrective upswing was relatively weak and it declined while the flag pattern was formed – just as it should if the formation was valid.
Conversely, the GDX ETF did invalidate the breakdown below the neckline of its bearish H&S pattern (which is a bullish sign). However, the GDXJ ETF did not. And with the junior miners’ initial plunge (the pole) implying a continuation of the downtrend (following a consolidation that forms the flag), there are more indicators weighing down the gold miners than lifting them up.
Please see below:
Wave the Flag! The Bear Flag!
Speaking of the GDXJ ETF, not only are the junior miners lagging behind their senior counterparts, but the four-hour chart provides a clear visual of the initial breakdown and the formation of the current bear flag.
Please see below:
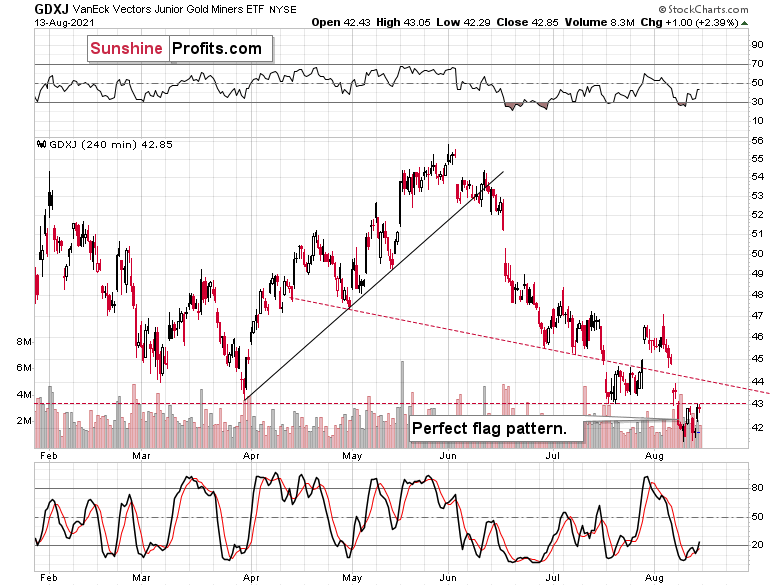
The flag is perfect, and it took place on relatively declining volume, suggesting that another move will also be to the downside. After all, the moves that follow flags tend to be similar to the ones that preceded them.
The price levels at which the flag was formed are also very important, and it’s clearer on the daily chart.
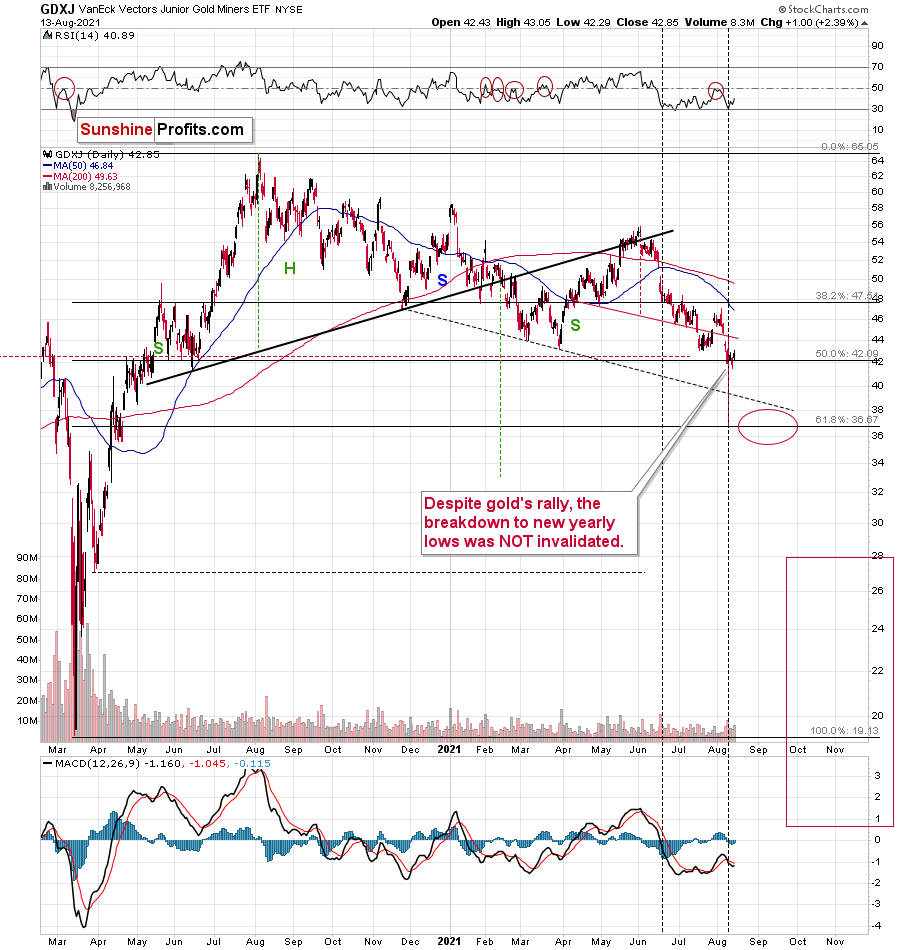
Junior miners broke below the previous 2021 lows, and they held this breakdown, even though gold rallied quite visibly last week. This serves as a great confirmation that the move lower is about to take place.
And how should we expect the climax to unfold? Last week, I wrote the following:
Well, the GDXJ ETF may consolidate in the short term, but lower lows are still likely, and initial support should materialize at roughly $37 (the 61.8% Fibonacci retracement level). Thereafter, a short-term corrective upswing should follow before the GDXJ ETF reverses course once again and records its final bottom near the end of the year – at much, much lower price levels. All in all, it seems that our profits on the GDXJ (short position in it) are going to become MUCH bigger before this decline is over.
The above remains up-to-date. In fact, we already saw the short-term consolidation last week, so the decline could resume any day now.
In conclusion, the gold miners’ continued underperformance of the yellow metal is akin to a fire alarm signaling an impending blaze. And while many investors have forged through the smoke in 2021 and suffered a loss of breath in the process, our medium-term forecast does not change our outlook for gold, silver and mining stocks over the long term. With the trio underpinned by robust long-term fundamentals and their medium-term drawdowns likely to elicit secular buying opportunities, we’re confident that the precious metals will remain atop investors’ wish lists for years to come.
Thank you for reading our free analysis today. Please note that the above is just a small fraction of the full analyses that our subscribers enjoy on a regular basis. They include multiple premium details such as the interim target for gold that could be reached in the next few weeks. We invite you to subscribe now and read today’s issue right away.
Sincerely,
Przemyslaw Radomski, CFA
Founder, Editor-in-chief


Gold Alerts
More-
Status
New 2024 Lows in Miners, New Highs in The USD Index
January 17, 2024, 12:19 PM -
Status
Soaring USD is SO Unsurprising – And SO Full of Implications
January 16, 2024, 8:40 AM -
Status
Rare Opportunity in Rare Earth Minerals?
January 15, 2024, 2:06 PM
Dear Sunshine Profits,


