

-
Gold Investment Update: Dollar Remains Strong and Rushes Further. Gold in Pain?
October 12, 2021, 11:19 AMThe old saying goes: in the case of gold and the dollar, the latter’s uprising is the former’s downsizing. Will we see this materializing once again?
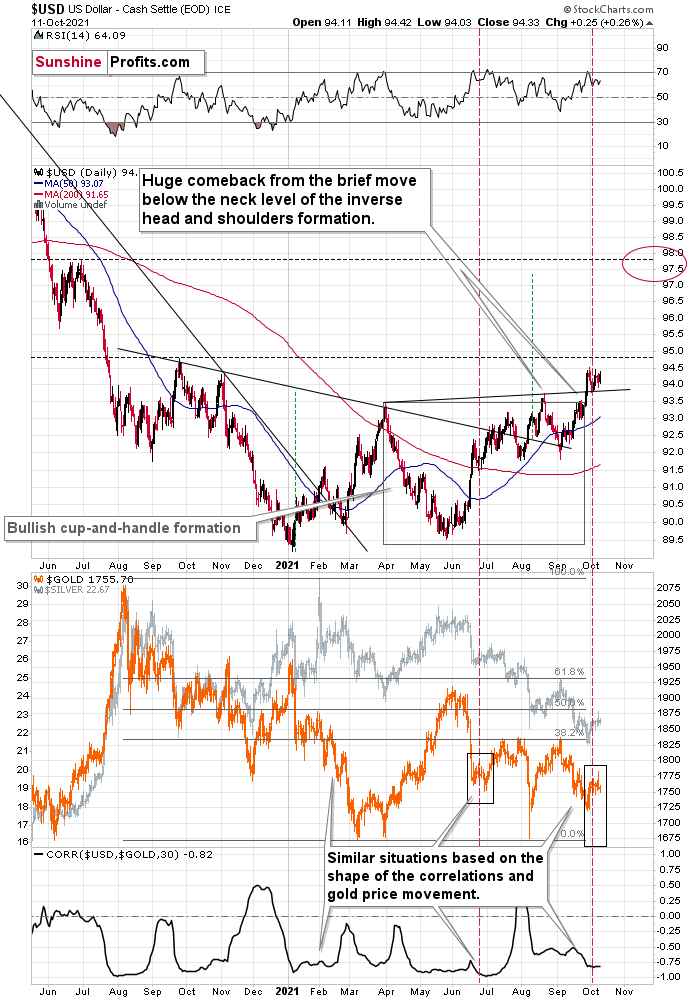
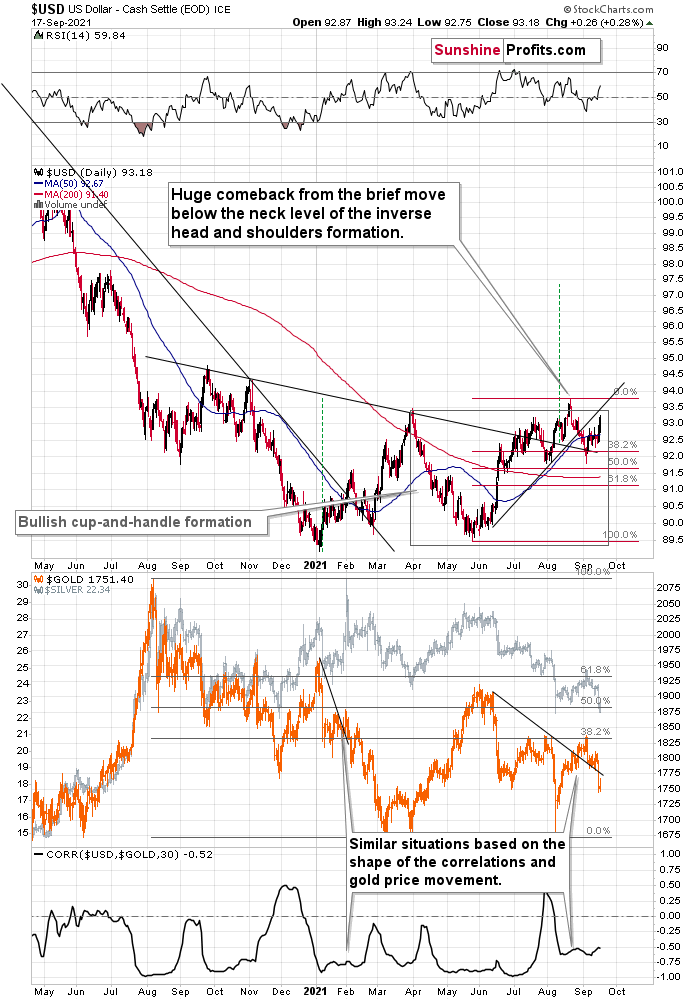
With the USD Index shrugging off the weak U.S. nonfarm payrolls print on Oct. 8 and demonstrating more and more resiliency as the months progress, the dollar basket has not only verified the breakout above the neckline of its inverse (bullish) head & shoulders pattern, but it’s also finding higher levels of support.
To explain, after bursting through its rising resistance line (which is now support), the recent consolidation is perfectly normal within a medium-term uptrend. Moreover, mirroring the behavior that we witnessed in June, the USD Index’s small correction after its RSI (Relative Strength Index) hit 70 was followed by another sharp move higher. As a result, the greenback’s technical foundation remains robust.
For context, I wrote on Oct. 4:
While a short-term consolidation could ensue following the USD Index’s ferocious rally, a similar development occurred in late June. After a short-term corrective downswing proceeded the USD Index’s sharp rally, the USD Index continued its medium-term ascent soon after. And while gold demonstrated the opposite price action in late June – recording a short-term rally and following that up with a medium-term drop to lower lows – the 2021 theme of ‘USD Index up, PMs down’ should continue to play out over the next few months.
To that point, with gold, silver and mining stocks often moving inversely to the U.S. dollar, the greenback’s likely uprising could sink the precious metals over the medium term.
Please see below:
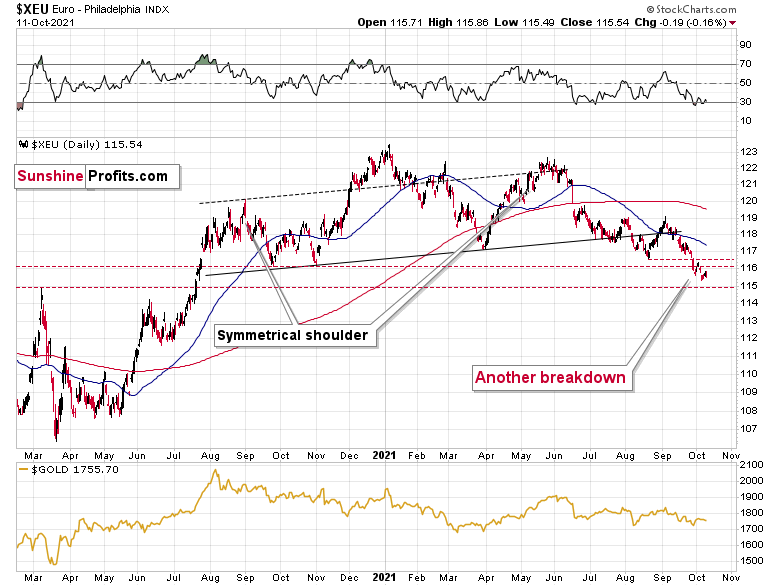
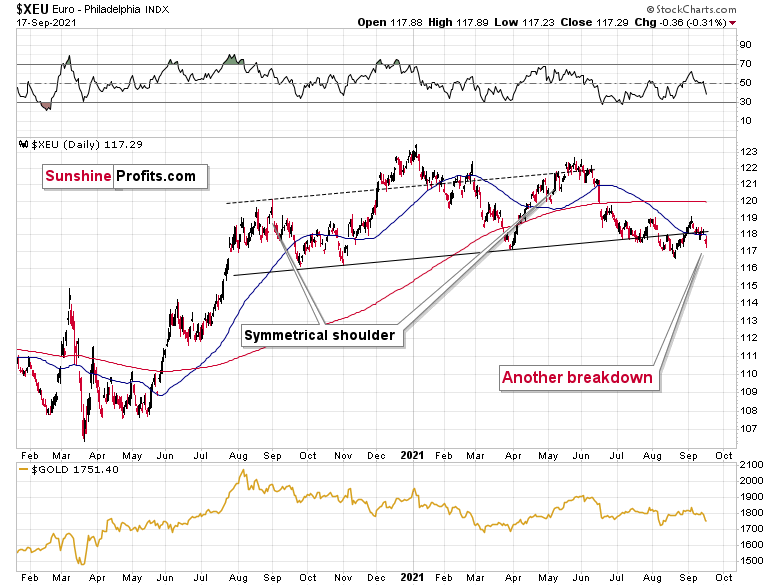
Equally bullish for the greenback, with the USD Index’s technical strength signaling an ominous ending for the Euro Index, the latter has struggled immensely in recent weeks.
And while the Euro Index bounced on Oct. 8 following the weak U.S. nonfarm payrolls print, the European currency closed at another 2021 low on Oct. 7 and has continued its freefall below the neckline of its bearish head & shoulders pattern. As a result, the next stop could be ~1.1500 (the March 2020 highs, then likely lower). For context, the EUR/USD accounts for nearly 58% of the movement of the USD Index, and that’s why the euro’s behavior is so important.
Please see below:
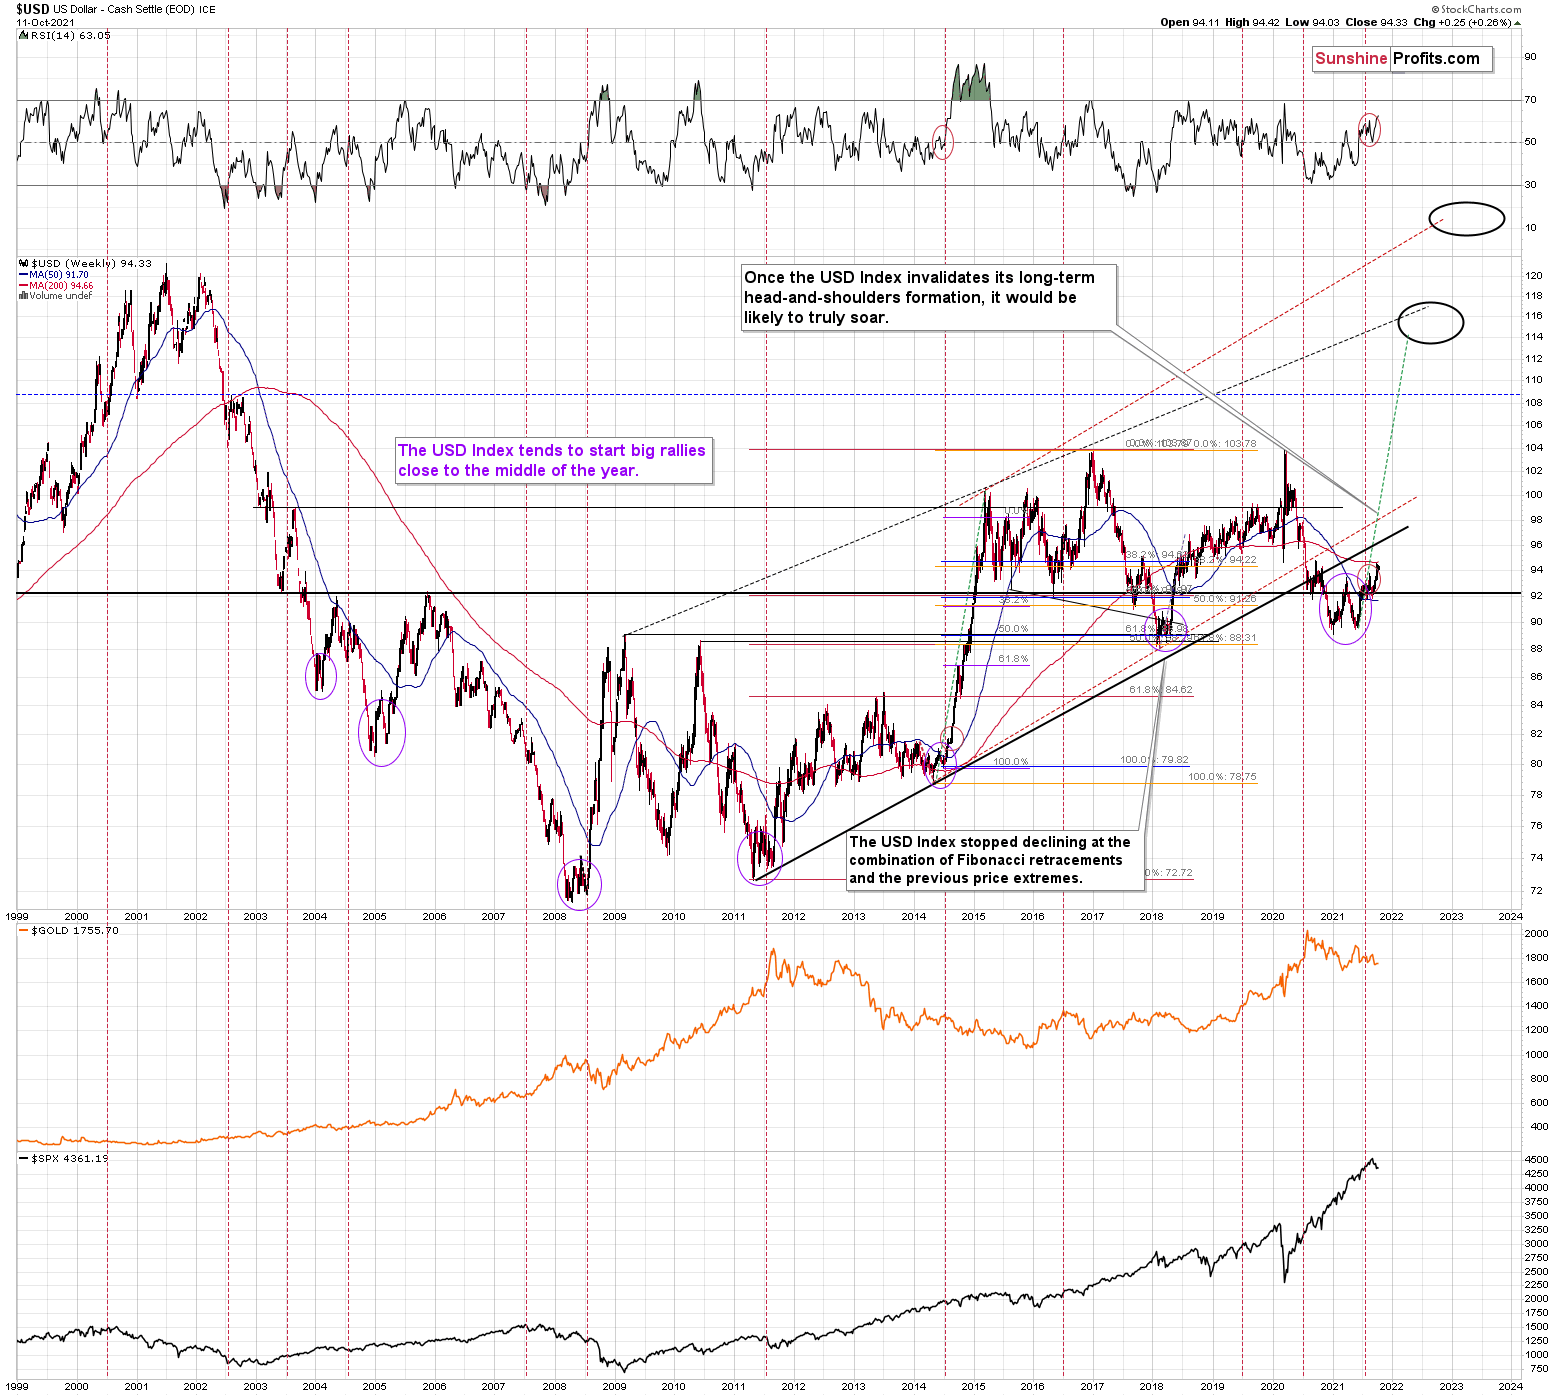
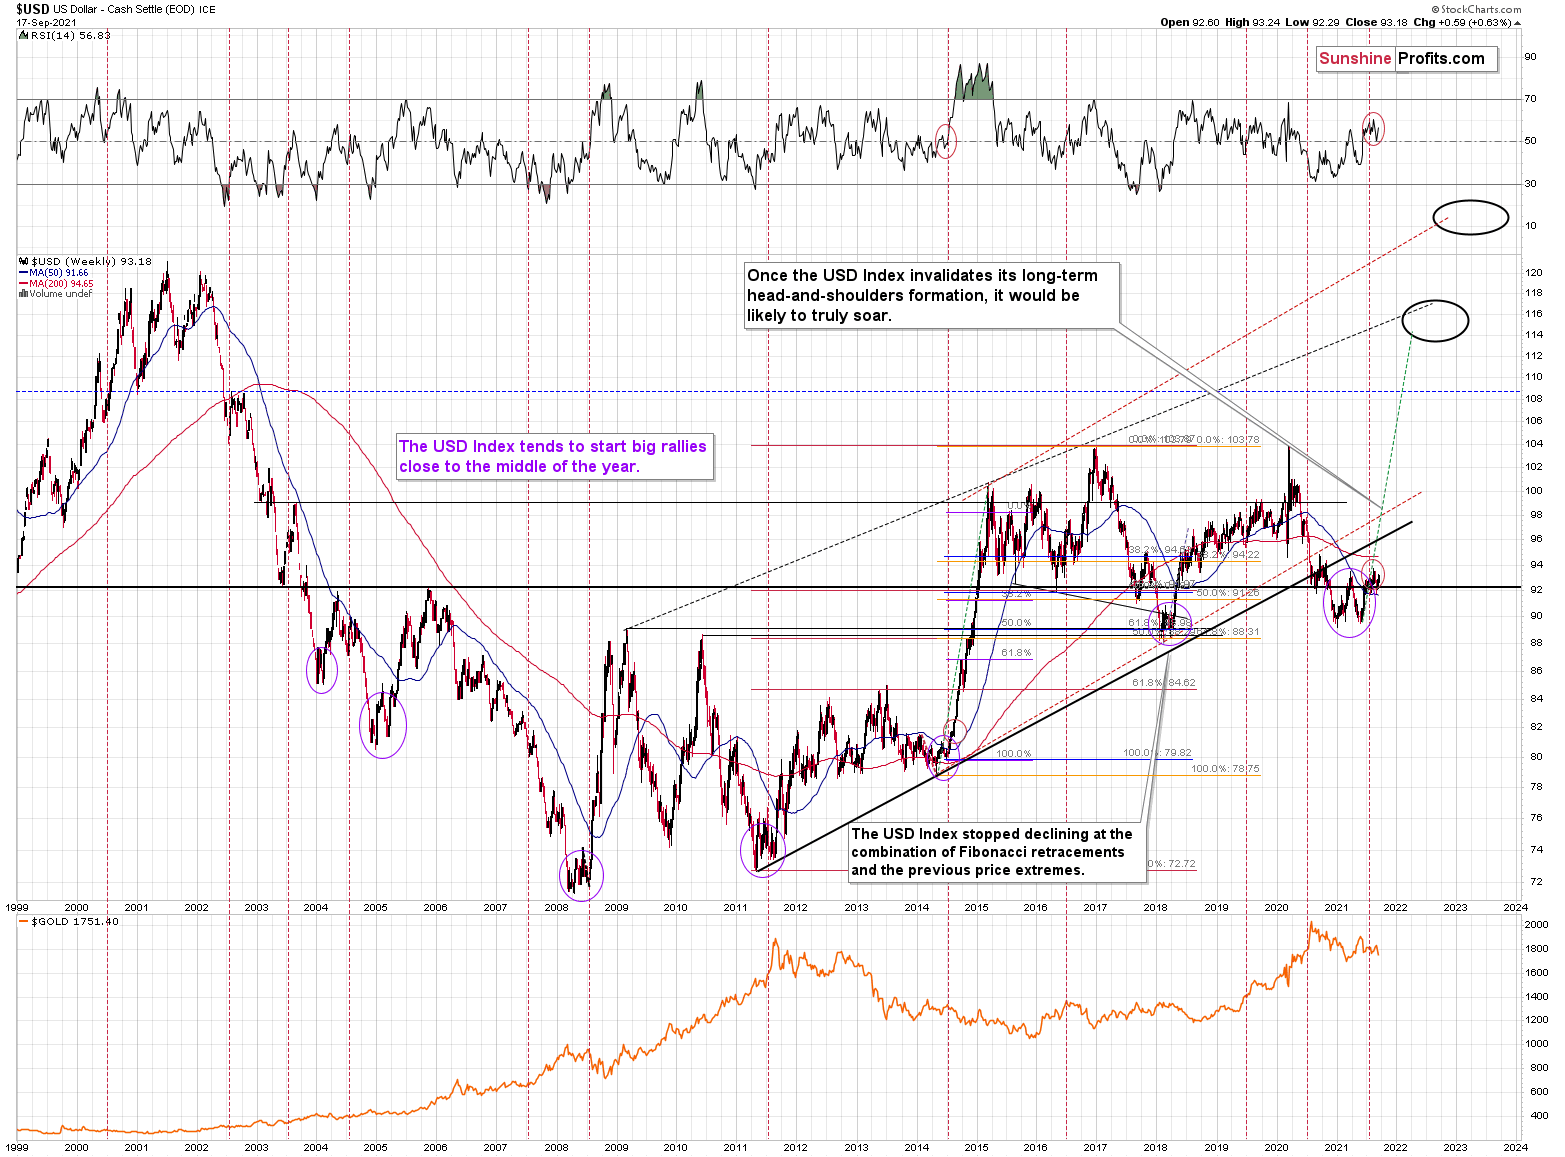
Adding to our confidence (don’t get me wrong, there are no certainties in any market; it’s just that the bullish narrative for the USDX is even more bullish in my view), the USD Index often sizzles in the summer sun and major USDX rallies often start during the middle of the year. Summertime spikes have been mainstays on the USD Index’s historical record and in 2004, 2005, 2008, 2011, 2014 and 2018 a retest of the lows (or close to them) occurred before the USD Index began its upward flights (which is exactly what’s happened this time around).
Furthermore, profound rallies (marked by the red vertical dashed lines below) followed in 2008, 2011 and 2014. With the current situation mirroring the latter, a small consolidation on the long-term chart is exactly what occurred before the USD Index surged in 2014. Likewise, the USD Index recently bottomed near its 50-week moving average; an identical development occurred in 2014. More importantly, though, with bottoms in the precious metals market often occurring when gold trades in unison with the USD Index (after ceasing to respond to the USD’s rallies with declines), we’re still far away from that milestone in terms of both price and duration.
Moreover, as the journey unfolds, the bullish signals from 2014 have resurfaced once again. For example, the USD Index’s RSI is hovering near a similar level (marked with red ellipses), and back then, a corrective downswing also occurred at the previous highs. More importantly, though, the short-term weakness was followed by a profound rally in 2014, and many technical and fundamental indicators signal that another reenactment could be forthcoming.
Please see below:
Just as the USD Index took a breather before its massive rally in 2014, it seems that we saw the same recently. This means that predicting higher gold prices (or the ones of silver) here is likely not a good idea.
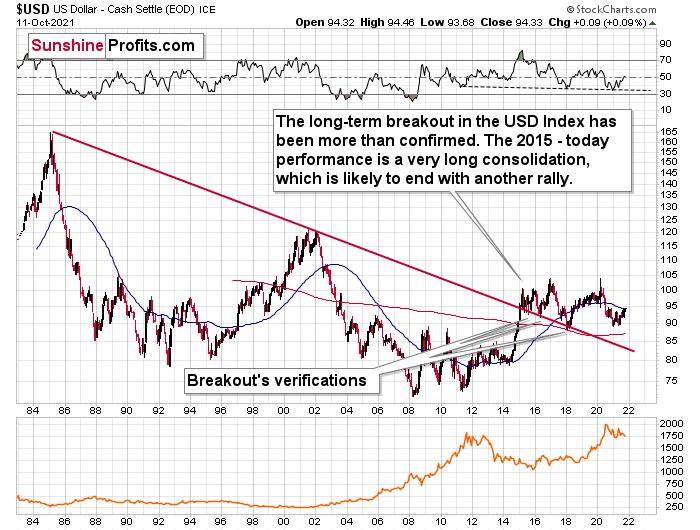
Continuing the theme, the eye in the sky doesn’t lie. And with the USDX’s long-term breakout clearly visible, the wind still remains at the dollar’s back.
Please see below:
The bottom line?
As the drama unfolds, the ~98 target is likely to be reached over the medium term, and the USDX will likely exceed 100 at some point over the medium or long term. Keep in mind though: we’re not bullish on the greenback because of the U.S.’ absolute outperformance. It’s because the region is fundamentally outperforming the Eurozone, the EUR/USD accounts for nearly 58% of the movement of the USD Index, and the relative performance is what really matters.
In conclusion, the USD Index remains ripe for an upward re-rating and the greenback’s ability to shrug off bad fundamental news has cemented its bullish foundation. Moreover, with the EUR/USD holding on by a thread, the currency pair’s pain is the USD Index’s gain. In addition, with the U.S. 10-Year Treasury yield closing the Oct. 8 session at its highest level since Jun. 3 and the Fed poised to announce its taper timeline in the coming months, plenty of reinforcements support a stronger U.S. dollar over the medium term. And since gold, silver and mining stocks have strong negative correlations with the U.S. dollar, the latter’s uprising could lead to the former’s downsizing.
Thank you for reading our free analysis today. Please note that the above is just a small fraction of the full analyses that our subscribers enjoy on a regular basis. They include multiple premium details such as the interim target for gold that could be reached in the next few weeks. We invite you to subscribe now and read today’s issue right away.
Sincerely,
Przemyslaw Radomski, CFA
Founder, Editor-in-chief -
Gold Investment Update: Miners - What the HUI Index Says About the Medium-Term
October 4, 2021, 11:08 AMIgnoring cycles, trends, and technical patterns is a potential recipe for disaster. The HUI index can tell us a lot about the near future.
After the HUI Index sunk to a new 2021 low last week, the index further validated the breakdown below the neckline of its bearish head & shoulders pattern. For context, H&S’ breakdowns have coincided with the largest declines in the HUI Index in recent decades. And while gold’s triangle-vertex-based reversal point may stop the bleeding in the very short-term, the HUI Index’s wounds are far from healed. To explain, I’ve been sounding the alarm on the HUI Index since the New Year (the index has declined by more than 29% YTD) and I wrote the following on Sep. 13:
The HUI Index plunged by nearly 6% last week, and the reversal of the previous corrective upswing mirrors its behavior from 2013. In addition, with its stochastic oscillator and its RSI (Relative Strength Index) also a spitting image, an ominous re-enactment of 2013 implies significantly lower prices over the medium term.
Please see below:
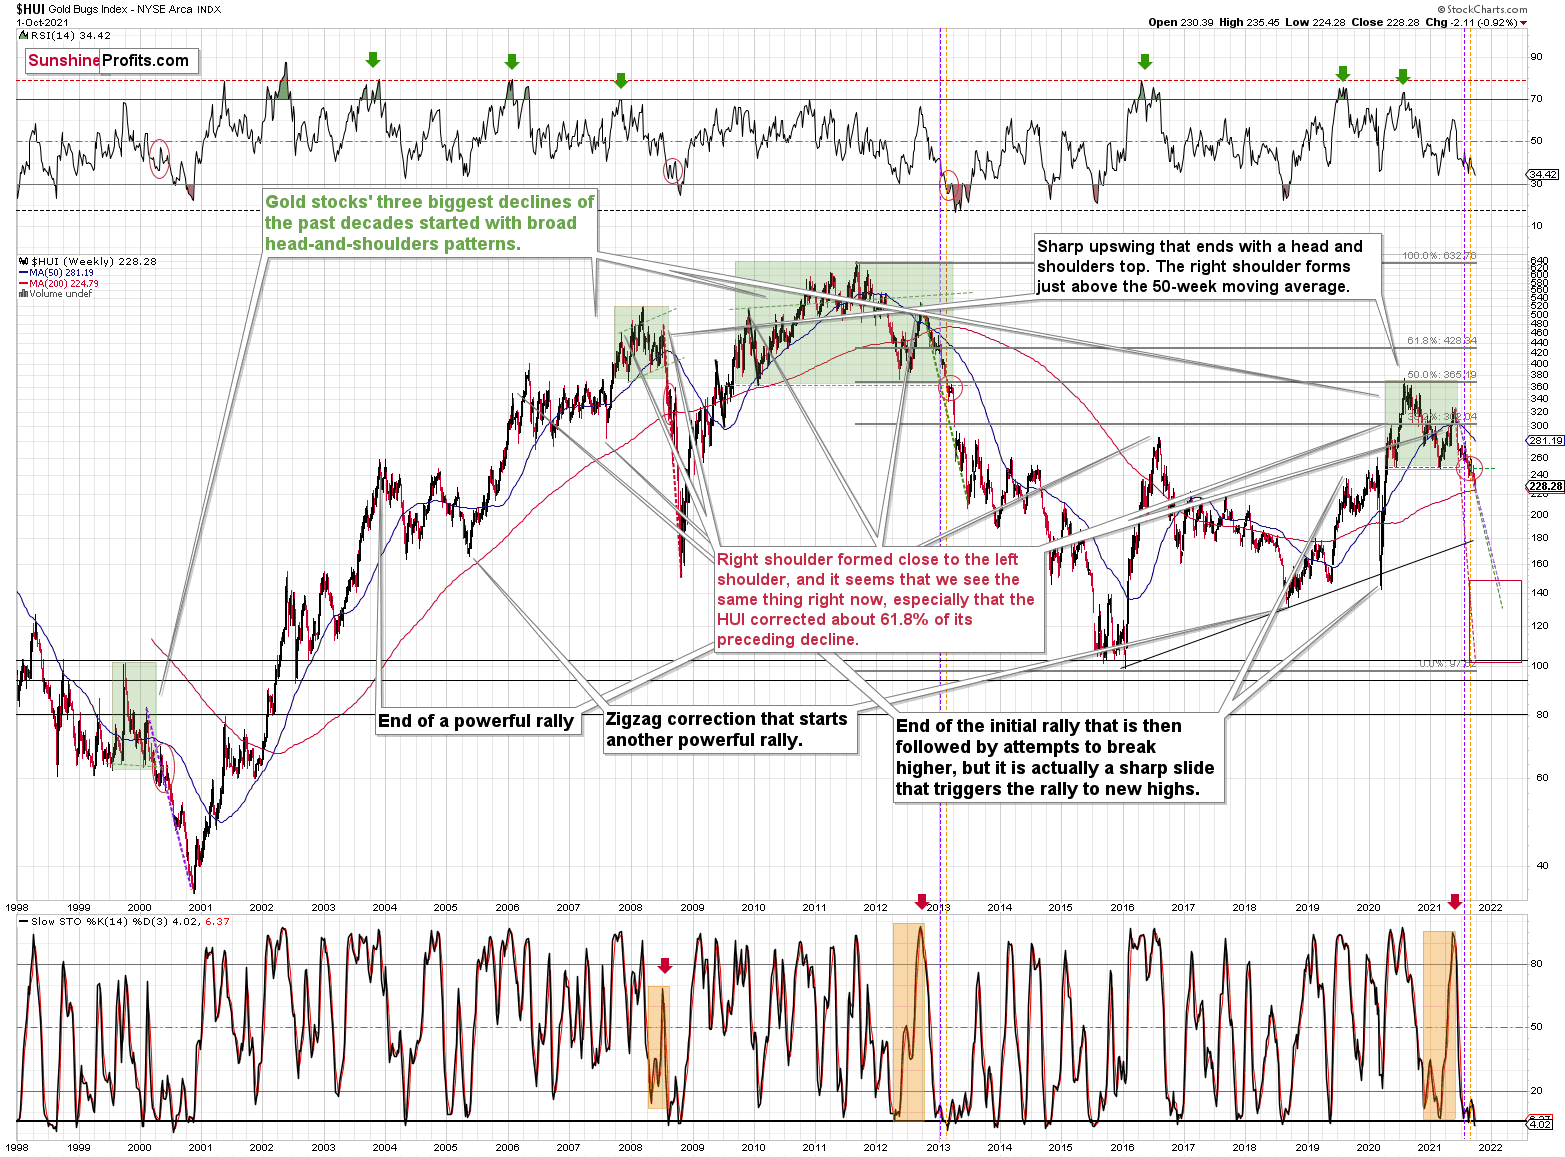
Furthermore, while I’ve also been warning about the ominous similarity to 2012-2013, the HUI Index continues to hop into the time machine. To explain, the vertical, dashed lines above demonstrate how the HUI Index is following its 2012-2013 playbook. For example, after a slight buy signal from the stochastic indicator in 2012, the short-term pause was followed by another sharp drawdown. For context, after the HUI Index recorded a short-term buy signal in late 2012 – when the index’s stochastic indicator was already below the 20 level (around 10) and the index was in the process of forming the right shoulder of a huge, medium-term head-and-shoulders pattern – the index moved slightly higher, consolidated, and then fell off a cliff. Thus, the HUI Index is quite likely to decline to its 200-week moving average (or so) before pausing and recording a corrective upswing. That’s close to the 220 level. Thereafter, the index will likely continue its bearish journey and record a final medium-term low some time in December.
Furthermore, I warned previously that the miners’ drastic underperformance of gold was an extremely bearish sign. There were several weeks when gold rallied visibly, and the HUI Index actually declined modestly. And now, gold stocks are trading close to their previous 2021 lows, while gold is almost right in the middle between its yearly high and its yearly low.
And why is this so important? Well, because the bearish implications of gold stocks’ extreme underperformance still remain intact.
Let’s keep in mind that the drastic underperformance of the HUI Index also preceded the bloodbath in 2008 as well as in 2012 and 2013. To explain, right before the huge slide in late September and early October 2008, gold was still moving to new intraday highs; the HUI Index was ignoring that, and then it declined despite gold’s rally. However, it was also the case that the general stock market suffered materially. If stocks didn’t decline so profoundly back then, gold stocks’ underperformance relative to gold would have likely been present but more moderate.
Nonetheless, broad head & shoulders patterns have often been precursors to monumental collapses. For example, when the HUI Index retraced a bit more than 61.8% of its downswing in 2008 and in between 50% and 61.8% of its downswing in 2012 before eventually rolling over, in both (2008 and 2012) cases, the final top – the right shoulder – formed close to the price where the left shoulder topped. And in early 2020, the left shoulder topped at 303.02. Thus, three of the biggest declines in the gold mining stocks (I’m using the HUI Index as a proxy here) all started with broad, multi-month head-and-shoulders patterns. And in all three cases, the size of the declines exceeded the size of the head of the pattern. As a reminder, the HUI Index recently completed the same formation.
Yes, the HUI Index moved back below the previous lows and the neck level of the formation, which – at face value – means that the formation was invalidated, but we saw a similar “invalidation” in 2000 and in 2013. Afterwards, the decline followed anyway. Consequently, I don’t think that taking the recent move higher at its face value is appropriate. It seems to me that the analogies to the very similar situation from the past are more important.
As a result, we’re confronted with two bearish scenarios:
- If things develop as they did in 2000 and 2012-2013, gold stocks are likely to bottom close to their early-2020 low.
- If things develop like in 2008 (which might be the case, given the extremely high participation of the investment public in the stock market and other markets), gold stocks could re-test (or break slightly below) their 2016 low.
In both cases, the forecast for silver, gold, and mining stocks is extremely bearish for the next several months.
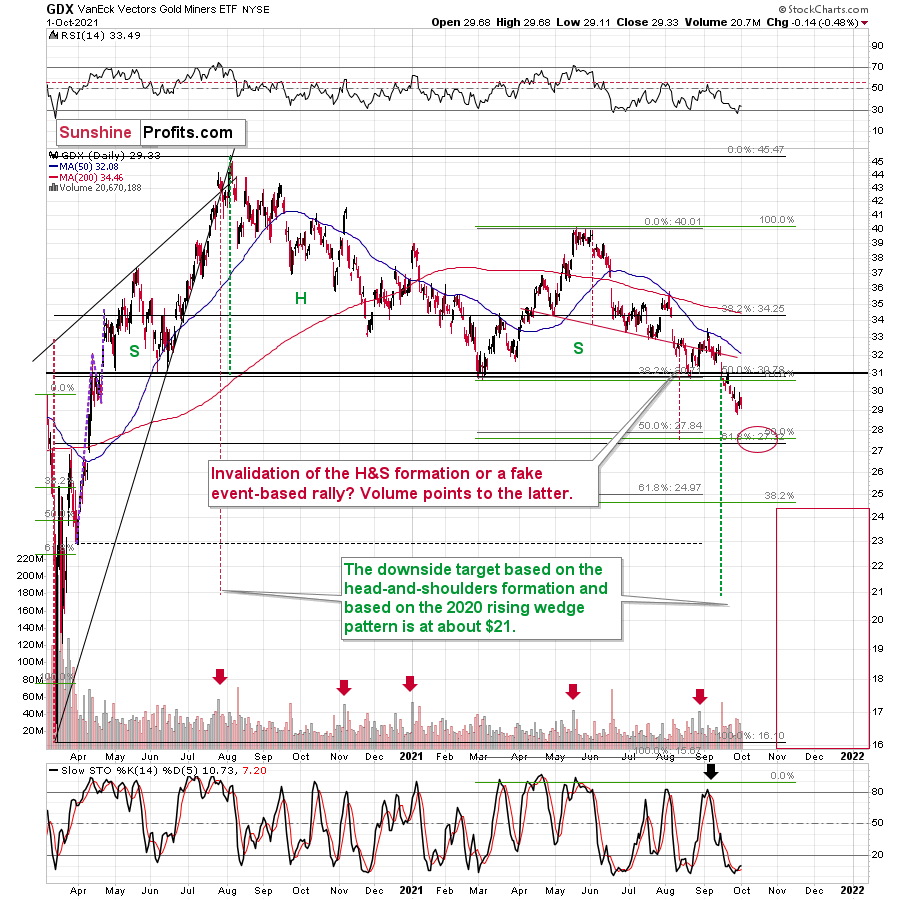
For even more confirmation, let’s compare the behavior of the GDX ETF and the GDXJ ETF. Regarding the former, the GDX ETF closed at a new 2021 low last week and sunk below $30 for the first time since April 2020. For context, I warned of a forthcoming calamity on Sep. 7:
I wrote:
Large spikes in daily volume are often bearish, not bullish. To explain, three of the last four volume outliers preceded an immediate top (or near) for the GDX ETF, while the one that preceded the late July rally was soon followed by the GDX ETF’s 2020 peak. Thus, when investors go ‘all in,’ material declines often follow. And with that, spike-high volume during the GDX ETF’s upswings often presents us with great shorting opportunities.
Moreover, even after the forecast became reality, the GDX ETF’s medium-term outlook remains quite bearish. For example, while gold bounced late last week and recouped its losses, the GDX ETF’s tepid rise further validated the senior miners’ underperformance.
As a result, the relative weakness implies lower lows over the next few months.
Please see below:
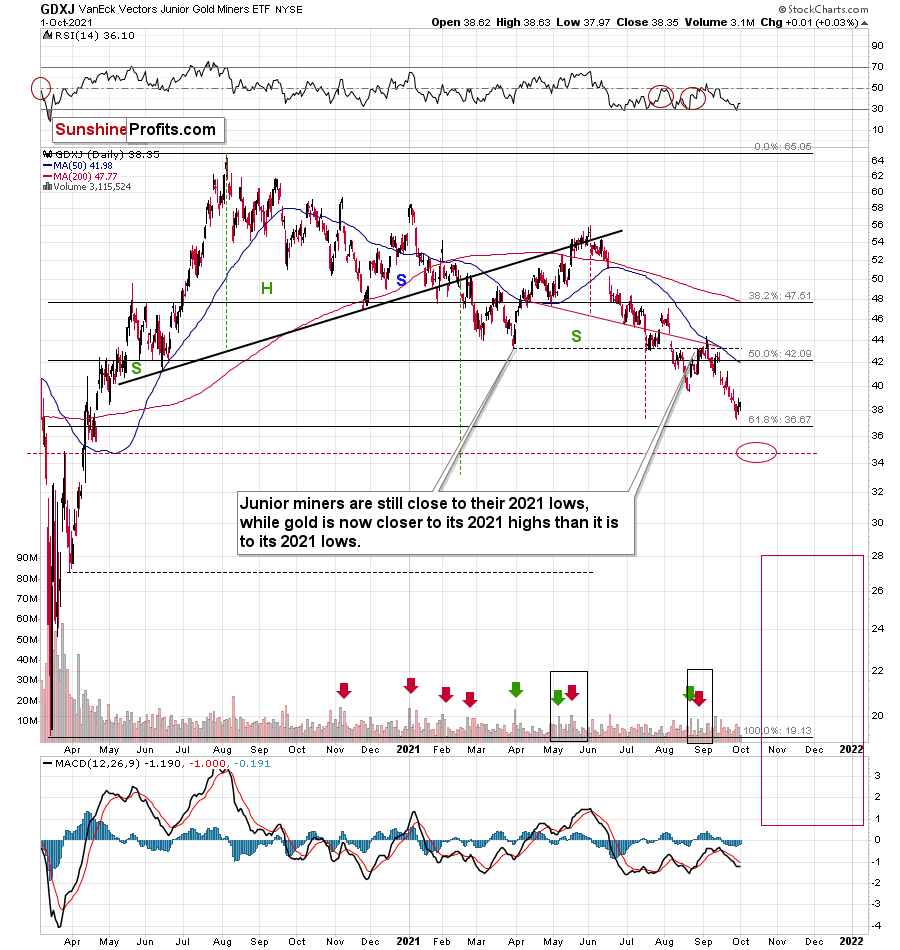
As for the GDXJ ETF, I wrote on Sep. 7 that overzealous investors would likely end the week disappointed:
With the current move quite similar to the corrective upswing recorded in mid-May, the springtime bounce was also followed by a sharp drawdown. As a result, the GDXJ ETF could be near its precipice, as its 50-day moving average is right ahead. And with the key level now acting as resistance, investors’ rejection on Sep. 3 could indicate that the top is already here.
And while the junior miners followed the roadmap to perfection, the GDXJ ETF still elicits material weakness. As a result, the GDXJ ETF remains poised to reach the ~$35 level over the medium term.
Please see below:
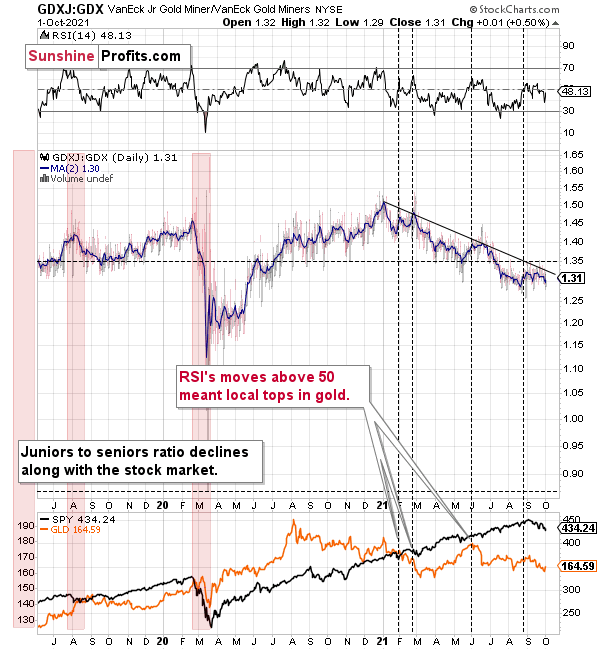
Finally, while I’ve been warning for months that the GDXJ/GDX ratio was destined for devaluation, the downtrend remains intact. And with the ratio reversing lower after reaching its declining resistance line, the medium-term implications remain unchanged. On top of that, if a stock-market swoon enters the equation, the ratio’s drawdown could be fast and furious (like what happened during the March 2020 crash).
To explain, when the ratio’s RSI jumped above 50 three times in 2021, it coincided with short-term peaks in gold. Second, the trend in the ratio this year has been clearly down, and there’s no sign of a reversal, especially when you consider that the ratio broke below its 2019 support (which served as resistance in mid-2020). When the same thing happened in 2020, the ratio then spiked even below 1.
The bottom line?
If the ratio is likely to continue its decline, then on a short-term basis we can expect it to decline to 1.27 or so. If the general stock market plunges, the ratio could move even lower, but let’s assume that stocks decline moderately (just as they did in the last couple of days) or that they do nothing or rally slightly. They’ve done all the above recently, so it’s natural to expect that this will be the case. Consequently, the trend in the GDXJ to GDX ratio would also be likely to continue, and thus expecting a move to about 1.26 - 1.27 seems rational.
If the GDX is about to decline to approximately $28 before correcting, then we might expect the GDXJ to decline to about $28 x 1.27 = $35.56 or $28 x 1.26 = $35.28. In other words, ~$28 in the GDX is likely to correspond to about $35 in the GDXJ.
Is there any technical support around $35 that would be likely to stop the decline? Yes. It’s provided by the late-Feb. 2020 low ($34.70) and the late-March high ($34.84). There’s also the late-April low at $35.63. Conservatively, I’m going to place the profit-take level just above the latter.
Consequently, it seems that expecting the GDXJ to decline to about $35 is justified from the technical point of view as well.
Speaking of ratios, there was also a major breakdown in the gold to gold stocks ratio which most likely heralds severe declines in the following weeks/months, and if you’re interested in it, I recorded a video about it here (or search for “Sunshine Profits” on YouTube – it’s the Oct. 2 video).
In conclusion, gold, silver, and mining stocks have all broken down technically, and their fundamental outlooks also remain quite treacherous over the next few months. With the USD Index hitting a new 2021 high last week and U.S. Treasury yields also rallying, the pairs’ upward momentum should continue over the medium term. Moreover, with the general stock market also showing signs of stress, a profound decline could add to the precious metals’ ills. As a result, gold, silver, and mining stocks’ weakness should continue before lasting bottoms likely form near the end of the year.
Thank you for reading our free analysis today. Please note that the above is just a small fraction of the full analyses that our subscribers enjoy on a regular basis. They include multiple premium details such as the interim target for gold that could be reached in the next few weeks. We invite you to subscribe now and read today’s issue right away.
Sincerely,
Przemyslaw Radomski, CFA
Founder, Editor-in-chief -
Gold Investment Update: Medium-Term Downtrend – Gold Miners in the Lead
September 27, 2021, 11:00 AMGold, silver, and mining stocks don’t need any help from the USDX or the stock market; they can decline all on their own – the miners in particular.
Last week, mining stocks declined quite visibly, and it happened without significant help from the USD Index and from the general stock market. Silver and gold were practically flat week-over-week, so was the USD Index, and the general stock market (S&P 500) was up by 0.51%. This means that gold stocks and silver stocks should have closed the week relatively unchanged (as gold and silver did), or move somewhat higher (similarly to other stocks, as sometimes miners take their lead).
Instead, all important proxies for the mining stocks moved lower and closed the week at new daily and weekly 2021 lows. The HUI Index and the GDX ETF were down by about 3%, the silver stocks (SIL ETF) were down by 3.6%, and the GDXJ ETF (proxy for junior miners) was down by 3.83%, which means that our short position in the latter just became even more profitable.
Most importantly, it means that mining stocks continue to show weakness relative to gold, which tells us that the medium-term downtrend remains well intact. It also tells us that what I wrote previously about the medium-term link between the general stock market and mining stocks was most likely correct. Namely, that miners can decline without a decline in other stocks. A decline in the latter, will (as I still expect to see it sooner or later) simply exacerbate the decline’s volatility.
Let’s take a look at the charts, starting with the long-term HUI Index chart – the flagship proxy for gold stocks.
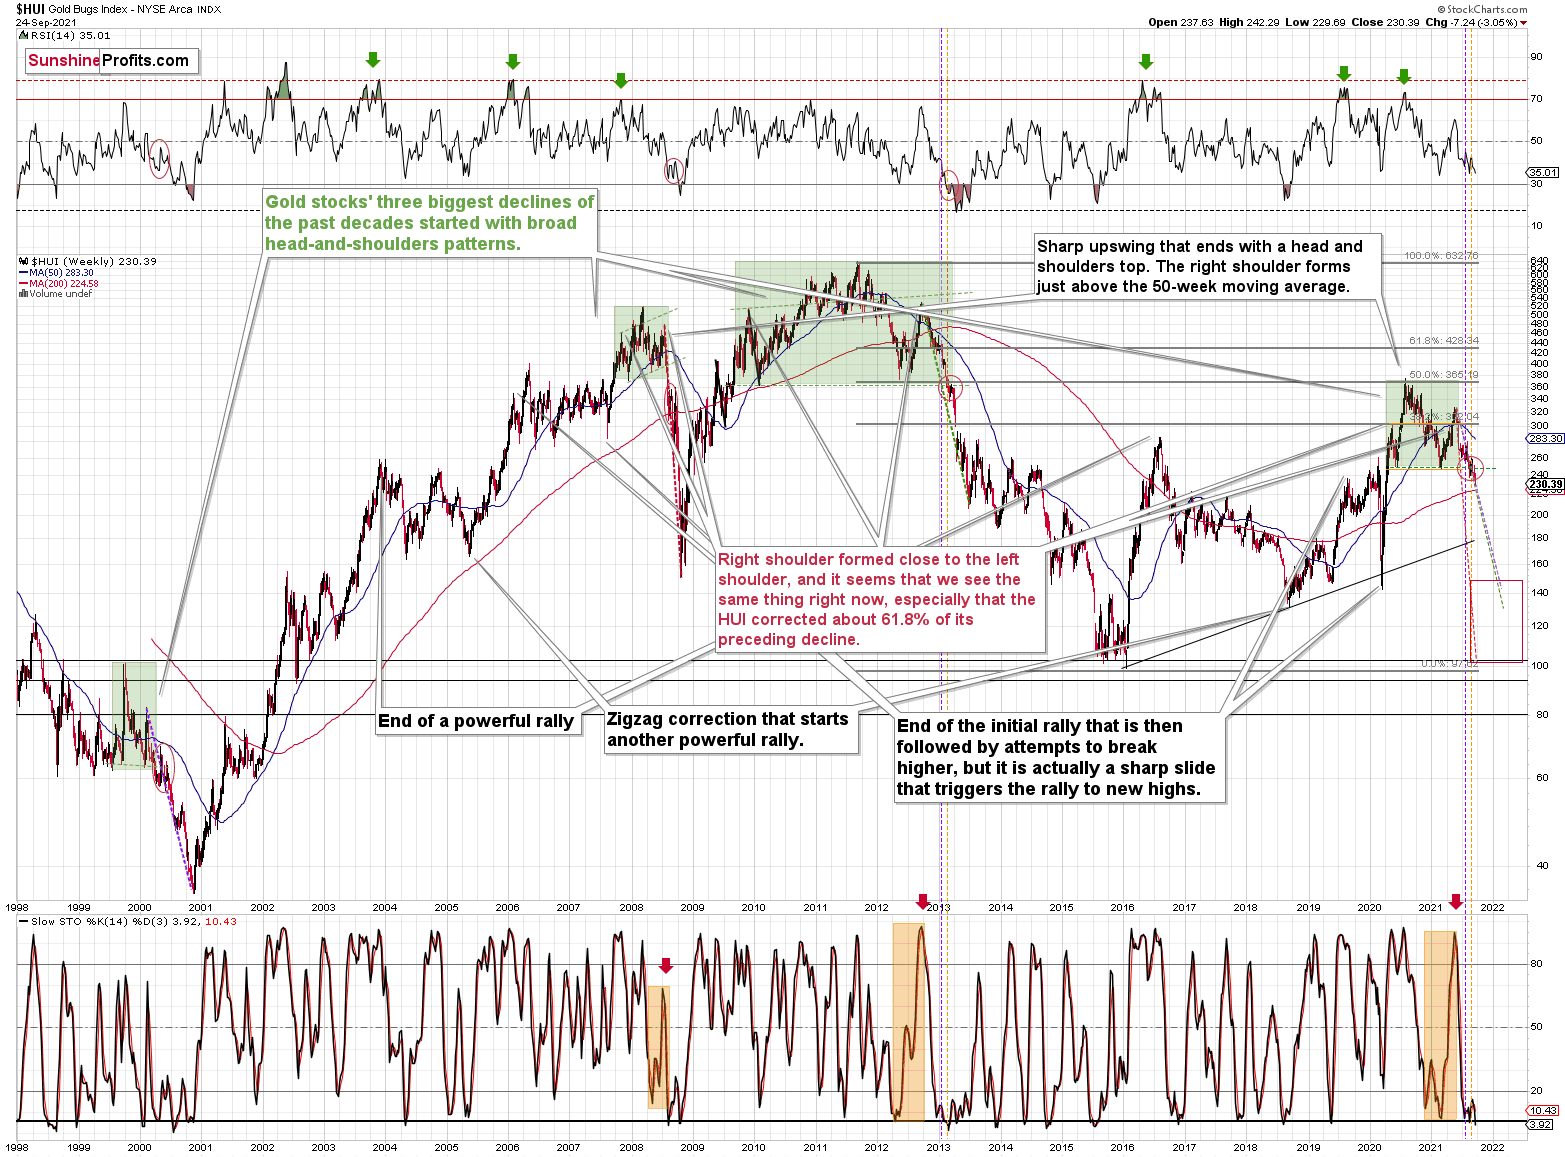
The clearest and most important thing that you can see on this chart is that gold miners continued their decline after completing – and verifying – the breakdown below the broad head and shoulders pattern (marked in green). Just like in the case of the previous similar patterns (also marked in green), mining stocks are likely to now decline profoundly. The 3% decline that we saw last week is likely just a small beginning of the entire slide.
Yes, the Stochastic indicator is very oversold, but please note that it was the same in 2013 during the powerful post-head-and-shoulders-breakdown slide. And it didn’t cause the decline to end or reverse.
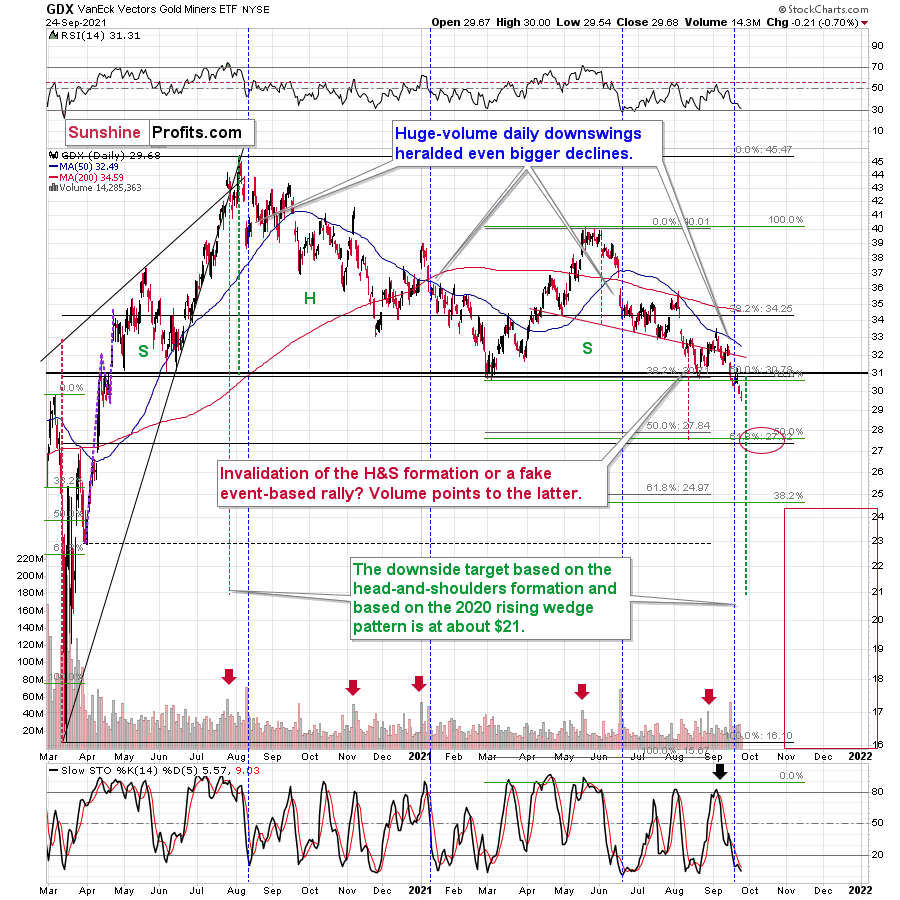
The breakdown to yearly lows is also crystal-clear in case of the GDX ETF. The weekly close below the previous 2021 lows is critical, but it’s worth noting that it was also a close below the psychologically important (as its round) $30 level.
The next target for the GDX ETF is based mainly on the 61.8% Fibonacci retracement level based on the entire 2020 rally. The previous retracements worked quite well, so it seems that this technique shouldn’t be ignored.
The 38.2% retracement served as support in November 2020. The decline below this level triggered a short-term rebound.
The 50% retracement served as support in March and August 2021. This level was particularly strong as it corresponded to the previous – May and June 2020 – lows. Reaching this level triggered rebounds. The first one was quite significant, and the second one was of only short-term importance.
When the GDX ETF moves to its 61.8% it’s likely to rebound in the short term (and probably in the short term only), not only because of the retracement itself, but also because two additional techniques confirm this level as a short-term target. One is the support provided by the late-March 2020 high, and the other is the previous head and shoulders pattern that formed between April and early August 2021. Based on the size of the head (red, dashed lines), GDX is likely to decline to about $28.
And while the GDX is likely to decline, so is its counterpart focused on junior mining stocks – the GDXJ ETF.
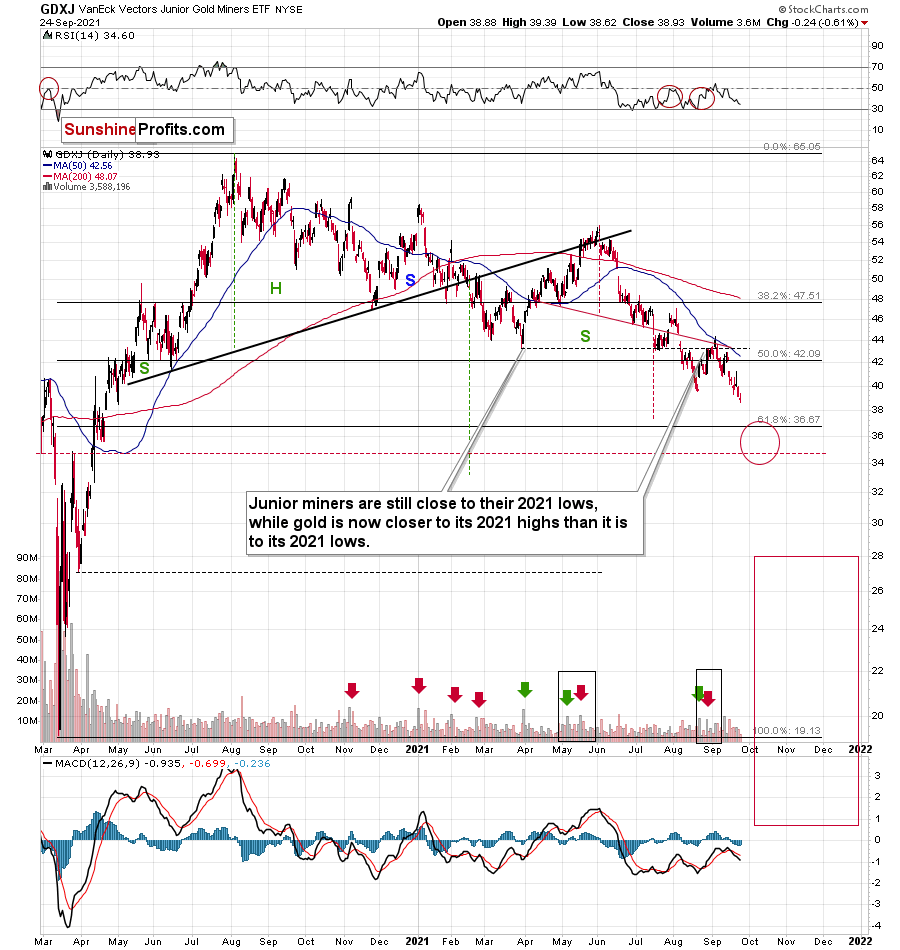
In the case of the GDXJ, the downside target is broader, as the 61.8% Fibonacci retracement, the late-March 2020 high, and the head-and-shoulders-based target are not so aligned.
A decline to the 61.8% Fibonacci retracement here would more or less correspond to the analogous move in the GDX in percentage terms. However, if the junior miners underperform (as they’ve been underperforming seniors for months), they could move even lower before rebounding.
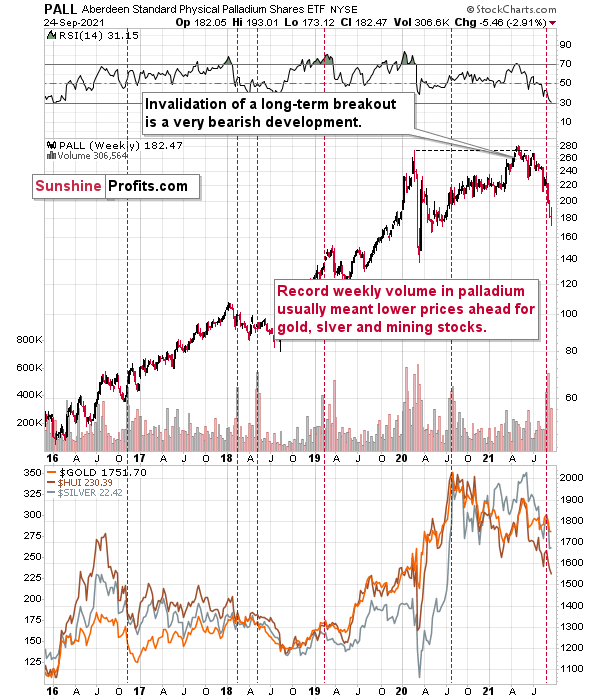
On a different note, let’s take a look at what’s happening in a less popular part of the precious metals sector – palladium.
On Sep. 7, I wrote the following:
Also adding credibility to the conclusions drawn from the volume spikes in the GDX ETF and the GDXJ ETF, last week, the Aberdeen Standard Physical Palladium Shares (PALL) ETF recorded a new 2021 high for weekly volume. And with abnormal volume offering a window into investor sentiment, historical euphoria preceded minor-to-massive declines in gold and silver (the red vertical dashed lines below). As a result, several areas of the precious metals market are sounding the alarm.
Last week’s volume spike was an anomaly, and whenever we see one on a given market, it’s useful to check what happened when we saw it previously. At times, you can notice some regularities – a pattern. And such a pattern could have important trading implications. That’s the case with palladium volume spikes, which – while rather inconsequential for palladium itself – were practically always followed by lower gold, silver, and mining stock prices. The implications for the said markets for the following weeks are thus bearish.
And indeed, the precious metals sector declined right after that volume spike. So far, the decline was only modest from the long-term point of view. Since some of the declines that followed the previous huge-volume signals from palladium were much bigger (especially the one following the 2020 top), we might see even lower prices of PMs and miners in the next weeks and months as well.
Thank you for reading our free analysis today. Please note that the above is just a small fraction of the full analyses that our subscribers enjoy on a regular basis. They include multiple premium details such as the interim target for gold that could be reached in the next few weeks. We invite you to subscribe now and read today’s issue right away.
Sincerely,
Przemyslaw Radomski, CFA
Founder, Editor-in-chief -
Gold Investment Update: How Do You Get Inflation Under Control?
September 23, 2021, 10:48 AMRaise the dollar, drop the metals. Under most possible scenarios, things don’t look good for gold, silver, and mining stocks – for the medium-term.
With the USD Index and U.S. Treasury yields the main fundamental drivers of the PMs’ performance, some confusion has arisen due to their parallel and divergent moves. For example, sometimes the USD Index rises while U.S. Treasury yields fall, or vice-versa, and sometimes the pair move higher/lower in unison. However, it’s important to remember that different economic environments have different impacts on the USD Index and U.S. Treasury yields.
To explain, the USD Index benefits from both the safe-haven bid (stock market volatility) and economic outperformance relative to its FX peers. Conversely, U.S. Treasury yields only benefit from the latter. Thus, when economic risks intensify (like what we witnessed with Evergrande on Sep. 20), the USD Index often rallies while U.S. Treasury yields often fall. Thus, the economic climate is often the fundamental determinant of the pairs’ future paths.
For context, I wrote on Apr.16:
The PMs suffer during three of four possible scenarios:
- When the bond market and the stock market price in risk, it’s bearish for the PMs
- When the bond market and the stock market don’t price in risk, it’s bearish for the PMs
- When the bond market doesn’t price in risk, but the stock market does, it’s bearish for the PMs
- When the bond market prices in risk and the stock market doesn’t, it’s bullish for the PMs
Regarding scenario #1, when the bond market and the stock market price in risk (economic stress), the USD Index often rallies and its strong negative correlation with the PMs upends their performance. Regarding scenario #2, when the bond market and the stock market don’t price in risk, U.S. economic strength supports a stronger U.S. dollar and rising U.S, Treasury yields reduce the fundamental attractiveness of gold. For context, the PMs are non-yielding assets, and when interest rates rise, bonds become more attractive relative to gold (for some investors). Regarding scenario #3, when the stock market suffers and U.S. Treasury yields are indifferent, the usual uptick in the USD Index is a bearish development for the PMs (for the same reasons outlined in scenario #1). Regarding scenario #4, when the bond market prices in risk (lower yields) and the stock market doesn’t, inflation-adjusted (real) interest rates often decline, and risk-on sentiment can hurt the USD Index. As a result, the cocktail often uplifts the PMs due to lower real interest rates and a weaker U.S. dollar.
The bottom line? The USD Index and U.S. Treasury yields can move in the same direction or forge different paths. However, while a stock market crash is likely the most bearish fundamental outcome that could confront the PMs, scenario #2 is next in line. While it may (or may not) seem counterintuitive, a strong U.S. economy is bearish for the PMs. When U.S. economic strength provides a fundamental thesis for both the USD Index and U.S. Treasury yields to rise (along with real interest rates), the double-edged sword often leaves gold and silver with deep lacerations.
In the meantime, though, with investors eagerly awaiting the Fed’s monetary policy decision today, QE is already dying a slow death. Case in point: not only has the USD Index recaptured 93 and surged above the neckline of its inverse (bullish) head & shoulders pattern, but the greenback’s fundamentals remain robust. With 78 counterparties draining more than $1.240 trillion out of the U.S. financial system on Sep. 21, the Fed’s daily reverse repurchase agreements hit another all-time high.
Please see below:
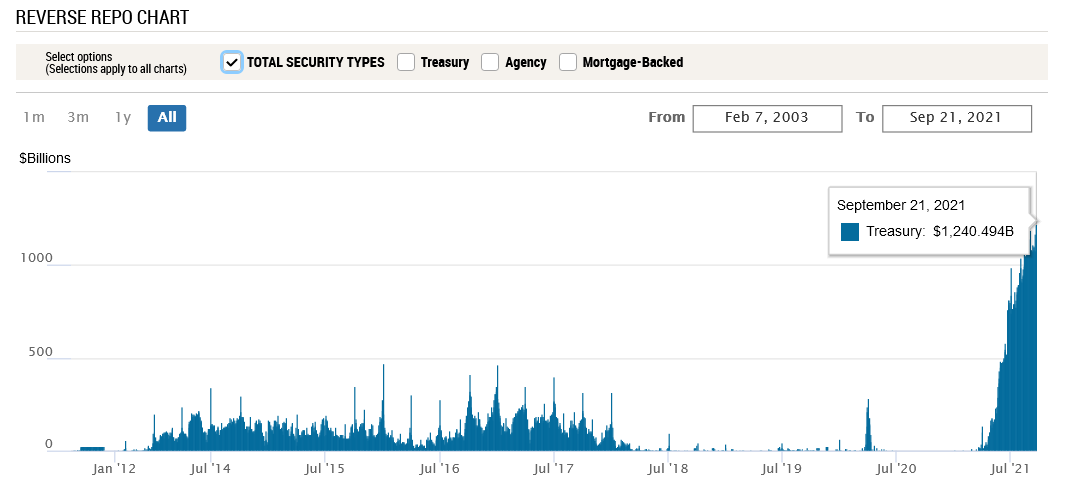 Source: New York Fed
To explain, a reverse repurchase agreement (repo) occurs when an institution offloads cash to the Fed in exchange for a Treasury security (on an overnight or short-term basis). And with U.S. financial institutions currently flooded with excess liquidity, they’re shipping cash to the Fed at an alarming rate. And while I’ve been warning for months that the activity is the fundamental equivalent of a taper – due to the lower supply of U.S. dollars (which is bullish for the USD Index) – the psychological effect is not the same. However, as we await a formal taper announcement from the Fed, the U.S. dollar’s fundamental foundation remains quite strong.
Furthermore, with the Wall Street Journal (WSJ) publishing a rather cryptic article on Sep. 10 titled “Fed Officials Prepare for November Reduction in Bond Buying,” messaging from the central bank’s unofficial mouthpiece implies that something is brewing. And while the Delta variant and Evergrande provide the Fed with an excuse to elongate its taper timeline, surging inflation has the Fed increasingly handcuffed.
As a result, Goldman Sachs Chief U.S. Economist David Mericle expects the Fed to provide “advance notice” today and set the stage for an official taper announcement in November. He wrote:
“While the start date now appears set, the pace of tapering is an open question. Our standing forecast is that the FOMC will taper at a pace of $15bn per meeting, split between $10bn in UST and $5bn in MBS, ending in September 2022. But a number of FOMC participants have called instead for a faster pace that would end by mid-2022, and we now see $15bn per meeting vs. $15bn per month as a close call.”
On top of that, with stagflation bubbling beneath the surface, another hawkish shift could materialize.
To explain, I wrote on Jun. 17:
On Apr. 30, I warned that Jerome Powell, Chairman of the U.S. Federal Reserve (Fed), was materially behind the inflation curve.
I wrote:
With Powell changing his tune from not seeing any “unwelcome” inflation on Jan. 14 to “we are likely to see upward pressure on prices, but [it] will be temporary” on Apr. 28, can you guess where this story is headed next?
And with the Fed Chair revealing on Jun. 16 what many of us already knew, he conceded:
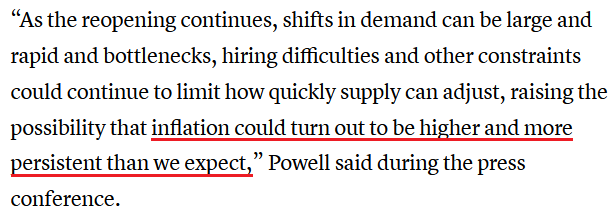 Source: CNBC
Moreover, while Powell added that “our expectation is these high inflation readings now will abate,” he also conceded that “you can think of this meeting that we had as the ‘talking about talking about’ [tapering] meeting, if you’d like.”
However, because actions speak louder than words, notice the monumental shift below?
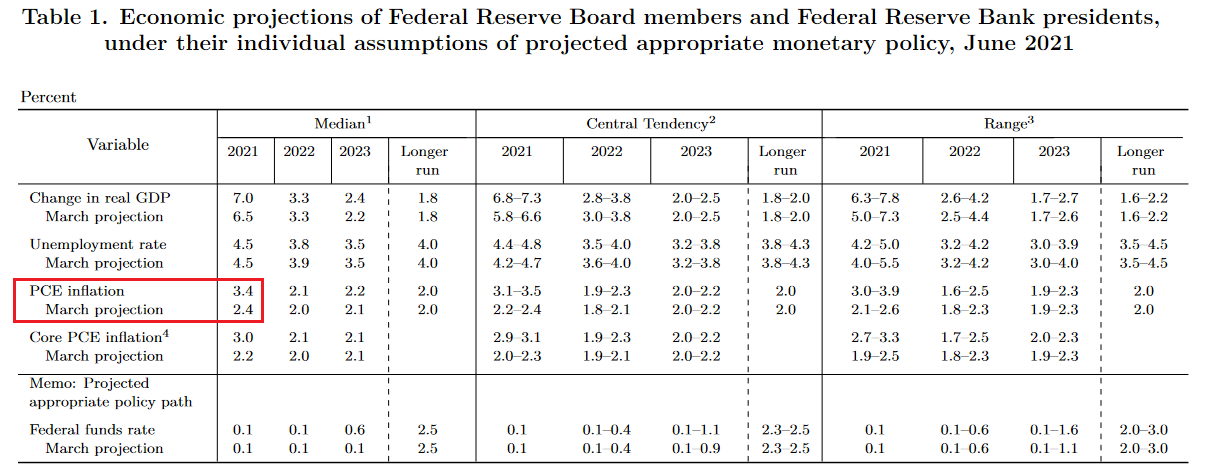 Source: U.S. Fed
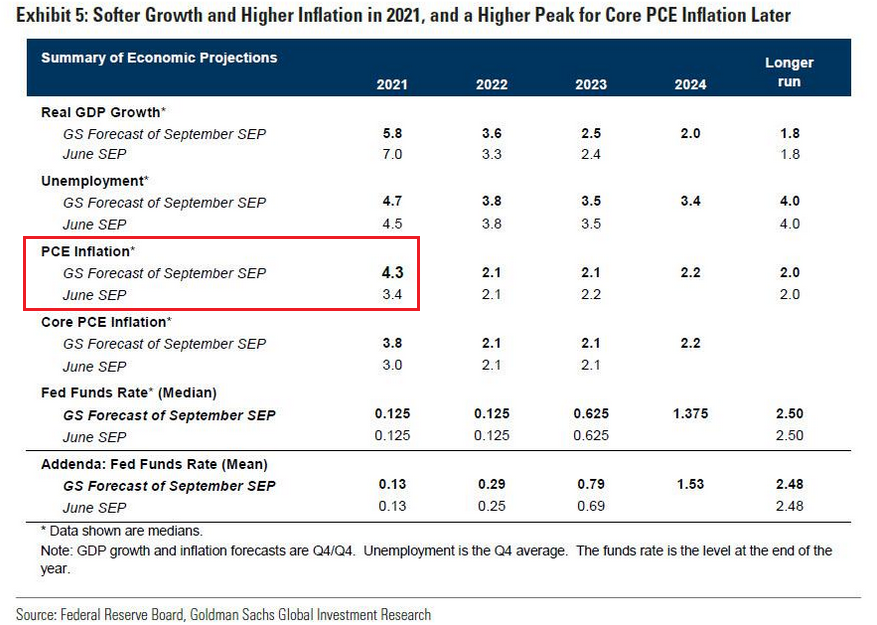
To explain, if you analyze the red box, you can see that the Fed increased its 2021 Personal Consumption Expenditures (PCE) Index projection from a 2.4% year-over-year (YoY) rise to a 3.4% YoY rise. But even more revealing, the original projection was made only three months ago. Thus, the about face screams of inflationary anxiety.
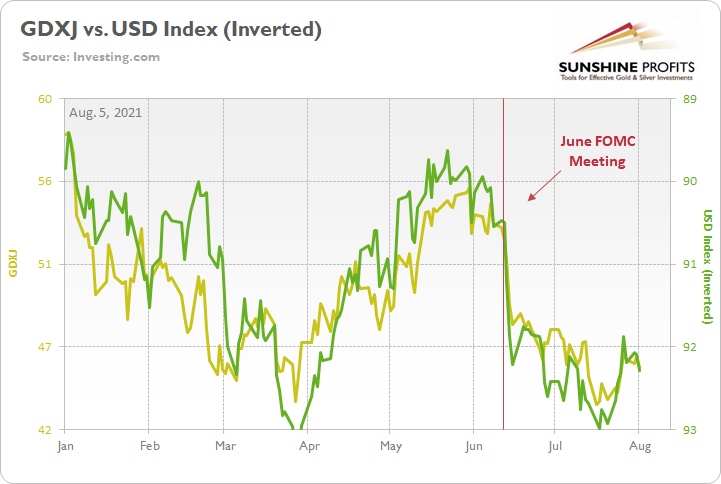
What’s more, I highlighted on Aug. 5 that the hawkish upward revision increased investors’ fears of a faster rate-hike cycle and contributed to the rise in the USD Index and the fall in the GDXJ ETF (our short position).
Please see below:
And why is all of this so important? Well, with Mericle expecting the Fed to increase its 2021 PCE Index projection from 3.4% to 4.3% today (the red box below), if the Fed’s message shifts from we’re adamant that inflation is “transitory” to “suddenly, we’re not so sure,” a re-enactment of the June FOMC meeting could uplift the USD Index and upend the PMs once again. For context, the FOMC’s July meeting did not include a summary of its economic projections and today’s ‘dot plot’ will provide the most important clues.
Please see below:
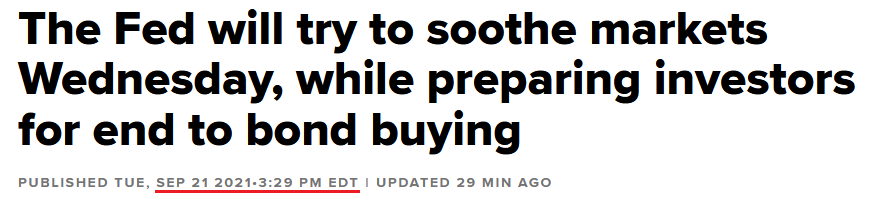
Finally, with CNBC proclaiming on Sep. 21 that the Fed is “widely expected to indicate it is getting ready to announce it will start paring back its $120 billion in monthly purchases of Treasuries and mortgage-backed securities,” even the financial media expects some form of “advance notice.”
 Source: CNBC
The bottom line? While the Delta variant and Evergrande have provided the Fed with dovish cover, neither addresses the underlying problem. With inflation surging and the Fed’s 2% annual target looking more and more like wishful thinking, reducing its bond-buying program, increasing the value of the U.S. dollar, and decreasing commodity prices is the only way to get inflation under control. In absence, the Producer Price Index (PPI) will likely continue its upward momentum and the cost-push inflationary spiral will likely continue as well.
In conclusion, the gold miners underperformed gold once again on Sep. 21 and the relative weakness is profoundly bearish. Moreover, while the USD Index was roughly flat, Treasury yields rallied across the curve. And while Powell will do his best to thread the dovish needle today, he’s stuck between a rock and a hard place: if he talks down the U.S. dollar (like he normally does), commodity prices will likely rise, and inflation will likely remain elevated. If he acknowledges reality and prioritizes controlling inflation, the U.S. dollar will likely surge, and the general stock market should suffer. As a result, with the conundrum poised to come to a head over the next few months (maybe even today), the PMs are caught in the crossfire and lower lows will likely materialize over the medium term.
Thank you for reading our free analysis today. Please note that the above is just a small fraction of the full analyses that our subscribers enjoy on a regular basis. They include multiple premium details such as the interim target for gold that could be reached in the next few weeks. We invite you to subscribe now and read today’s issue right away.
Sincerely,
Przemyslaw Radomski, CFA
Founder, Editor-in-chief -
Gold Investment Update: USD Bears Are Fresh Out of Honey Pots
September 20, 2021, 1:47 PMThe declining medium-term outlook for gold, silver, and mining stocks will eat away at the honey pot of US dollar bears. Get ready for bee stings.
With headline after headline attempting to knock the USD Index off of its lofty perch, I warned on Sep. 13 that dollar bears will likely run out of honey sooner rather than later.
I wrote:
While the USD Index was under fundamental fire in recent weeks, buyers eagerly hit the bid near the 38.2% Fibonacci retracement level. And after positive sentiment lifted the greenback back above the neckline of its inverse (bullish) head & shoulders pattern last week, the USDX’s medium-term outlook remains profoundly bullish.
More importantly, though, after the USD Index rallied by 0.63% last week and further validated its bullish breakout, gold, silver, and mining stocks ran in the opposite direction. And with the divergence likely to accelerate over the medium term, the swarm should sting the precious metals during the autumn months.
Please see below:
Conversely, if the USD Index encounters resistance as it attempts to make a new 2021 high, gold, silver, and mining stocks could enjoy an immaterial corrective upswing. However, the optimism will likely be short lived, and it’s likely a matter of when, not if, the USD Index reaches the illustrious milestone.
Equally bullish for the greenback, with the USD Index’s technical strength signaling an ominous ending for the Euro Index, I warned on Sep. 13 that the latter faced a tough road ahead.
I wrote:
While I have less conviction in the Euro Index’s next move relative to the USD Index, more likely than not, the Euro Index should break down once again and the bearish momentum should resume over the medium term.
And after the Euro Index sunk below the neckline of its bearish head & shoulders pattern last week, lower lows remains the most likely outcome over the medium term.
Please see below:
Adding to our confidence (don’t get me wrong, there are no certainties in any market; it’s just that the bullish narrative for the USDX is even more bullish in my view), the USD Index often sizzles in the summer sun and major USDX rallies often start during the middle of the year. Summertime spikes have been mainstays on the USD Index’s historical record and in 2004, 2005, 2008, 2011, 2014 and 2018 a retest of the lows (or close to them) occurred before the USD Index began its upward flights (which is exactly what’s happened this time around).
Furthermore, profound rallies (marked by the red vertical dashed lines below) followed in 2008, 2011 and 2014. With the current situation mirroring the latter, a small consolidation on the long-term chart is exactly what occurred before the USD Index surged in 2014. Likewise, the USD Index recently bottomed near its 50-week moving average; an identical development occurred in 2014. More importantly, though, with bottoms in the precious metals market often occurring when gold trades in unison with the USD Index (after ceasing to respond to the USD’s rallies with declines), we’re still far away from that milestone in terms of both price and duration.
Moreover, as the journey unfolds, the bullish signals from 2014 have resurfaced once again. For example, the USD Index’s RSI is hovering near a similar level (marked with red ellipses), and back then, a corrective downswing also occurred at the previous highs. More importantly, though, the short-term weakness was followed by a profound rally in 2014, and many technical and fundamental indicators signal that another reenactment could be forthcoming.
Please see below:
Just as the USD Index took a breather before its massive rally in 2014, it seems that we saw the same recently. This means that predicting higher gold prices (or the ones of silver) here is likely not a good idea.
Continuing the theme, the eye in the sky doesn’t lie. And with the USDX’s long-term breakout clearly visible, the wind still remains at the greenback’s back.
Please see below:

The bottom line?
Once the momentum unfolds, ~94.5 is likely the USD Index’s first stop, ~98 is likely the next stop after that, and the USDX will likely exceed 100 at some point over the medium or long term. Keep in mind though: we’re not bullish on the greenback because of the U.S.’ absolute outperformance. It’s because the region is fundamentally outperforming the Eurozone, the EUR/USD accounts for nearly 58% of the movement of the USD Index, and the relative performance is what really matters.
In conclusion, the USD Index’s sweet performance left sour tastes in the precious metals’ mouths. And with the former’s bullish breakout signaling an ominous future for the latter, gold, silver, and mining stocks will likely confront new lows over the medium term. However, once the autumn months fade and the winter weather approaches, buying opportunities may present themselves. And with unprecedented monetary and fiscal policy likely to underwrite new highs in the coming years, the long-term outlook for gold, silver, and mining stocks remains extremely bright.
Thank you for reading our free analysis today. Please note that the above is just a small fraction of the full analyses that our subscribers enjoy on a regular basis. They include multiple premium details such as the interim target for gold that could be reached in the next few weeks. We invite you to subscribe now and read today’s issue right away.
Sincerely,
Przemyslaw Radomski, CFA
Founder, Editor-in-chief


Gold Alerts
More-
Status
New 2024 Lows in Miners, New Highs in The USD Index
January 17, 2024, 12:19 PM -
Status
Soaring USD is SO Unsurprising – And SO Full of Implications
January 16, 2024, 8:40 AM -
Status
Rare Opportunity in Rare Earth Minerals?
January 15, 2024, 2:06 PM
Dear Sunshine Profits,


