

-
Gold Investment Update: A Massive Slide – Be Ready For More!
August 9, 2021, 7:38 AMWhat a week! Gold has dropped almost $60 since Friday, and silver came along reaching new yearly lows! Are you prepared for a wild ride downwards?
The USD Index (USDX)
While many investors forecasted a sharp decline in the USD Index, I warned on Aug. 2 that the stars were aligning for the greenback. And with gold, silver and mining stocks exhibiting strong negative correlations with the U.S. dollar, the latter’s rise could result in the former’s demise.
I wrote:
With the USD Index demonstrating late-week strength and bouncing off of the 38.2% Fibonacci retracement level, the greenback may have recorded a short-term bottom. In both 2008 and 2014, small moves lower solidified the USD Index’s short-term bottoms and remarkable rallies followed. In fact, the rapid reversals in both cases occurred with RSIs near 50 (close to the current reading of 53.32) and it’s likely a matter of when, not if, the greenback records a significant upward re-rating. The bottom line? The PMs will likely bear the brunt of the USD Index’s forthcoming strength.
And after the USD Index soared back above the neckline of its inverse (bullish) head & shoulders pattern last week – and caused gold, silver and mining stocks to plunge in the process – the USDX remains poised to recapture ~98 over the medium term.
Please see below:
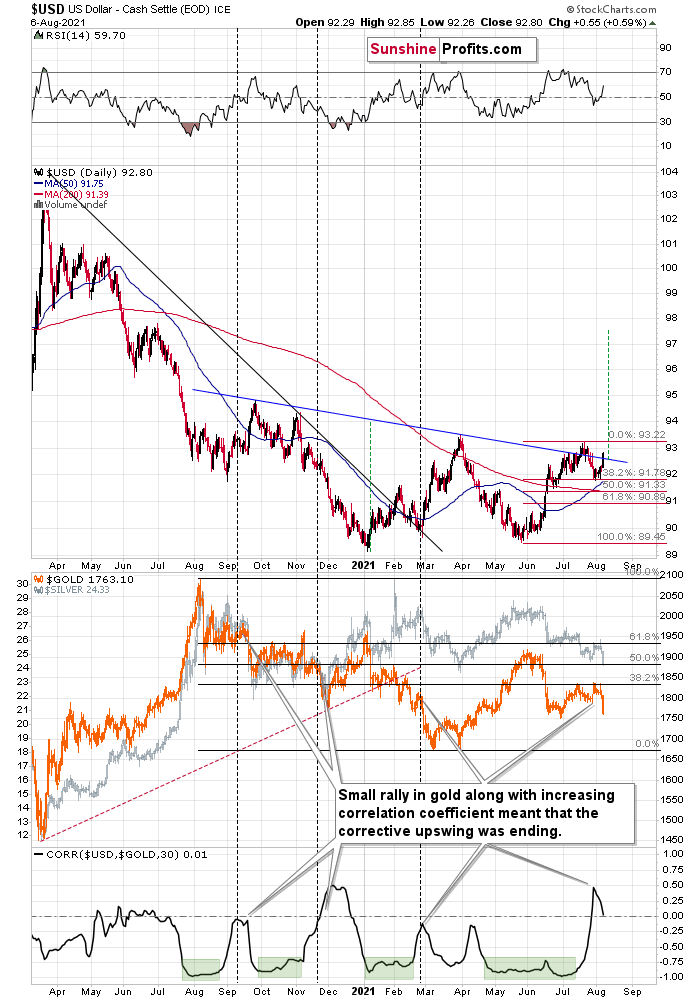
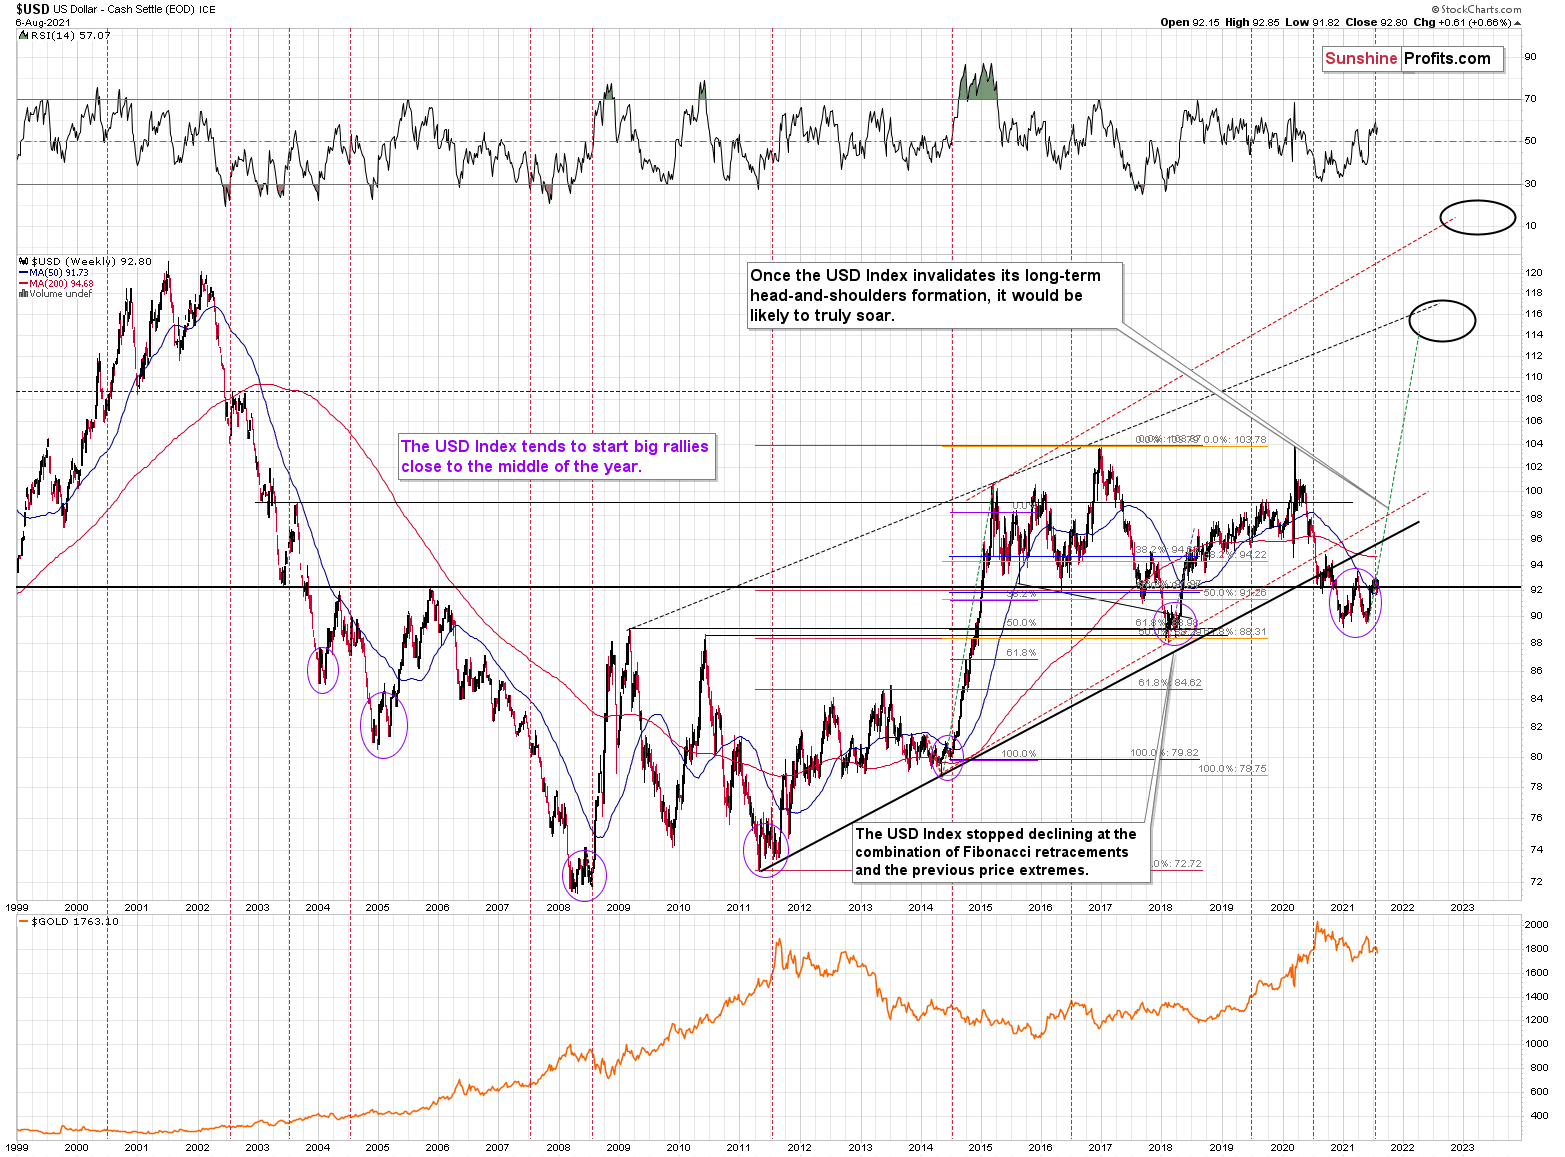
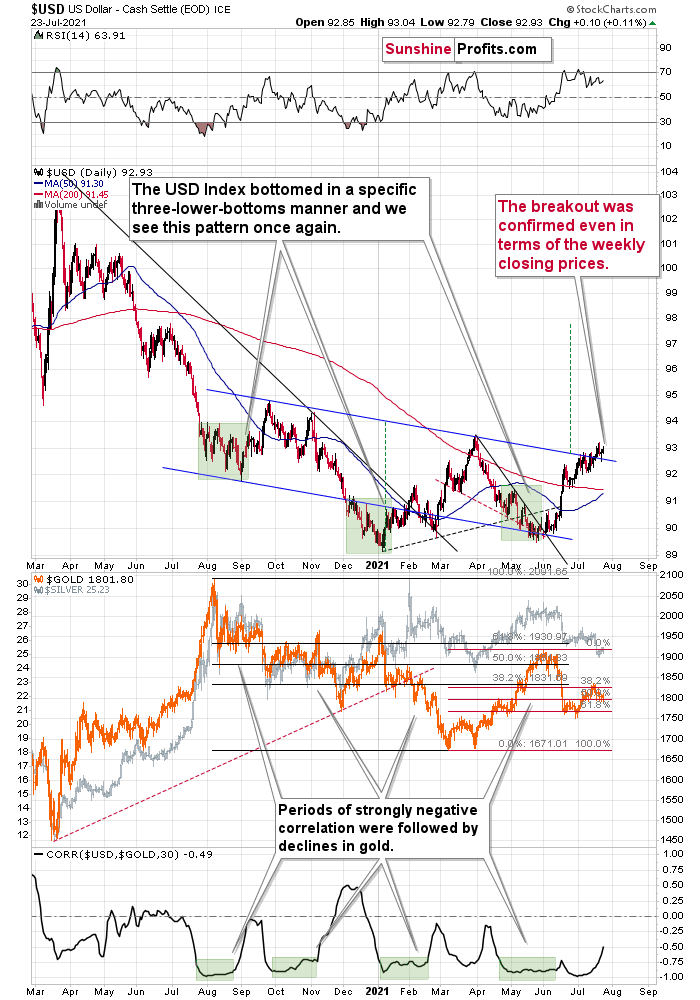
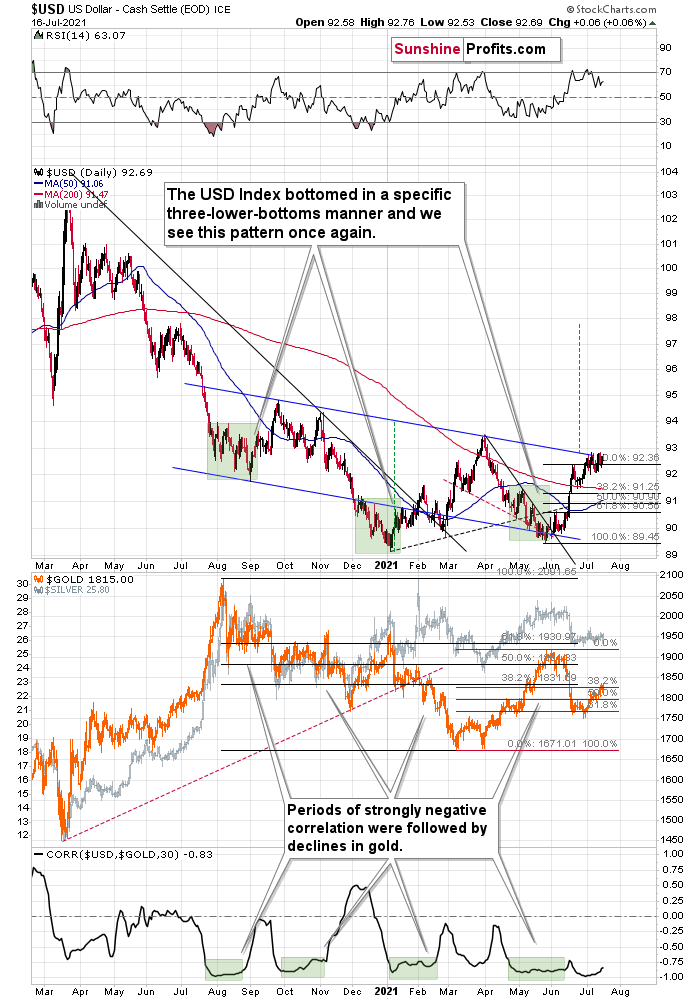
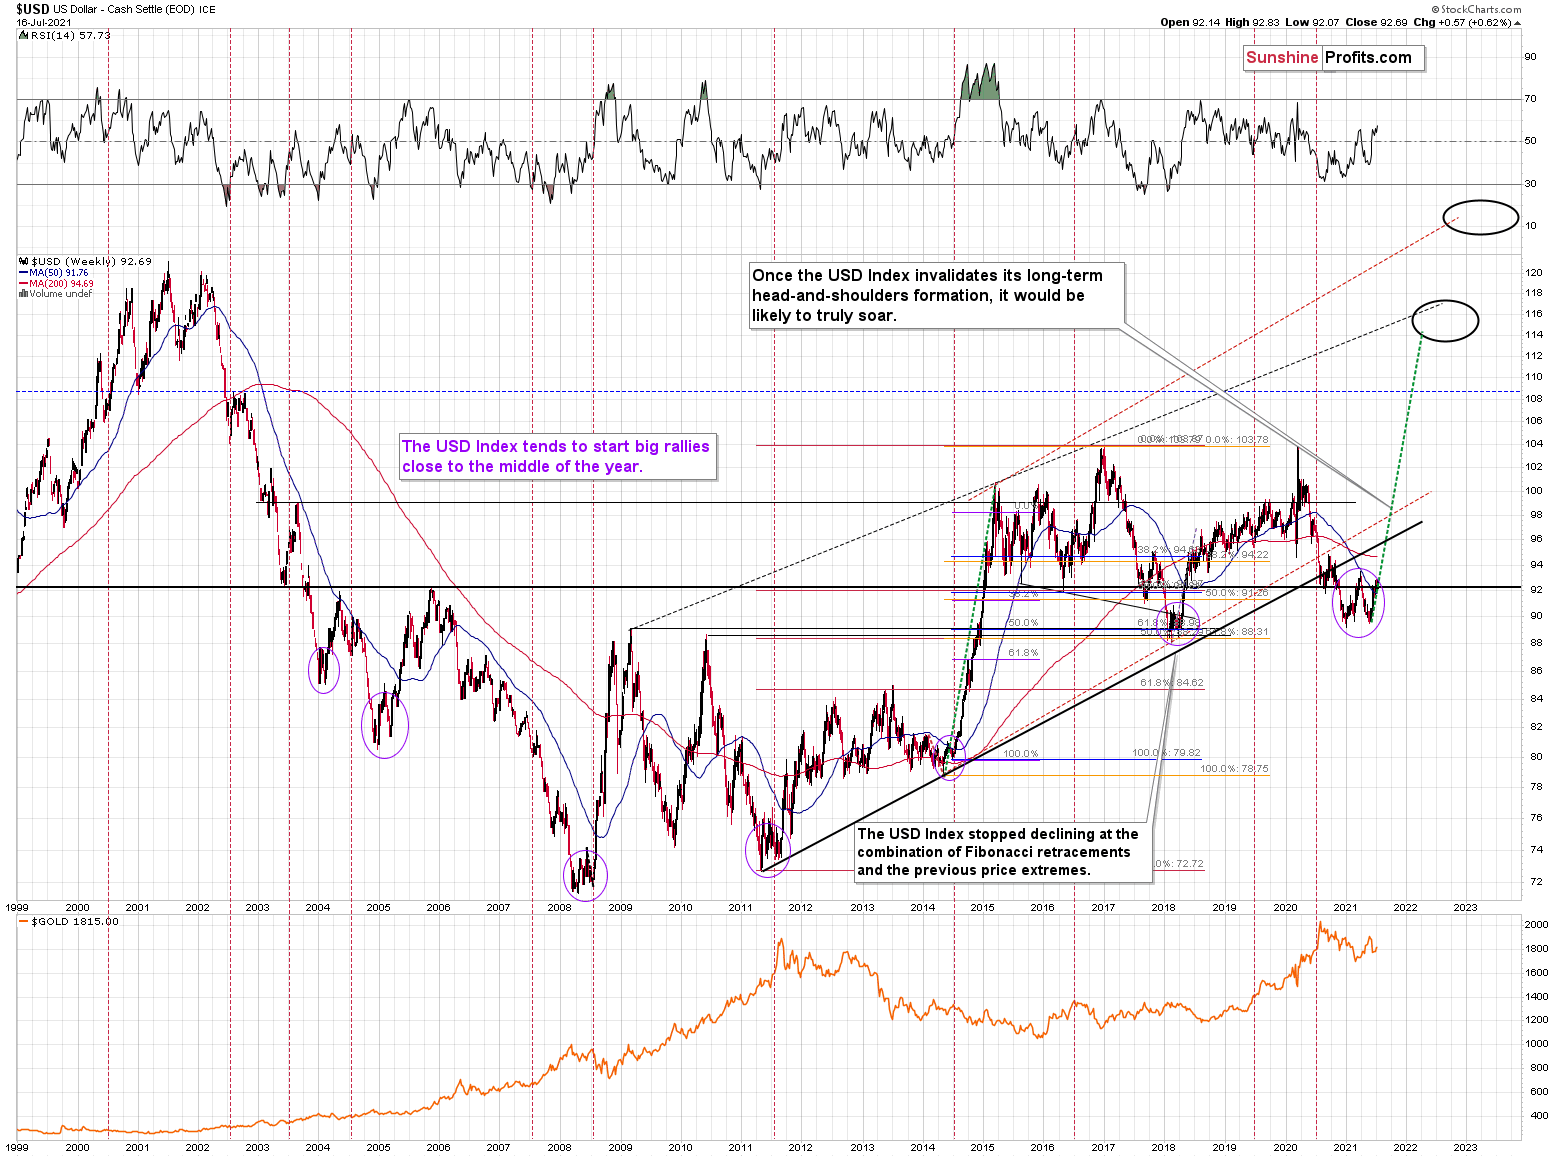
To explain, the USD Index often sizzles in the summer sun and major USDX rallies often start during the middle of the year. For example, summertime spikes have been mainstays on the USD Index’s historical record and in 2004, 2005, 2008, 2011, 2014 and 2018, a retest of the lows (or close to them) occurred before the USD Index began its upward flights.
What’s more, profound rallies (marked by the red vertical dashed lines below) followed in 2008, 2011 and 2014. And with the current situation mirroring the latter, a small consolidation on the long-term chart is exactly what occurred before the USD Index surged in 2014. Likewise, the USD Index recently bottomed near its 50-week moving average; an identical development occurred in 2014. More importantly, though, with bottoms in the precious metals market often occurring when gold trades in unison with the USD Index (after ceasing to respond to the USD’s rallies with declines), we’re still far away from that milestone in terms of both price and duration.
Please see below (quick reminder: you can click on the chart to enlarge it):
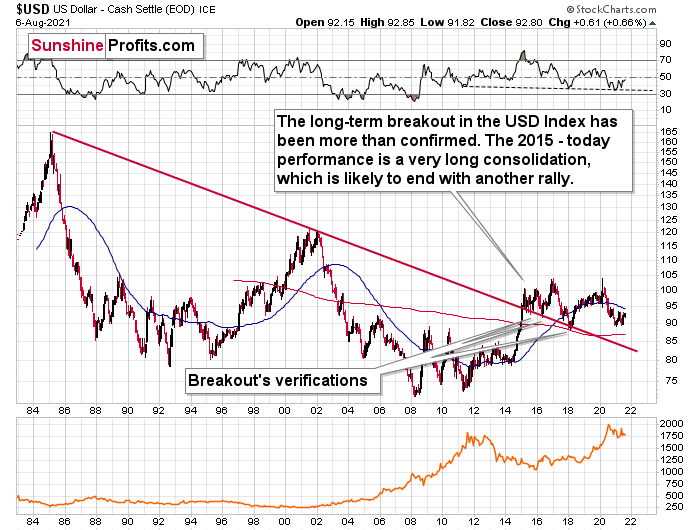
Just as the USD Index took a breather before its massive rally in 2014, it seems that we saw the same recently. This means that predicting higher gold prices here is likely not a good idea.
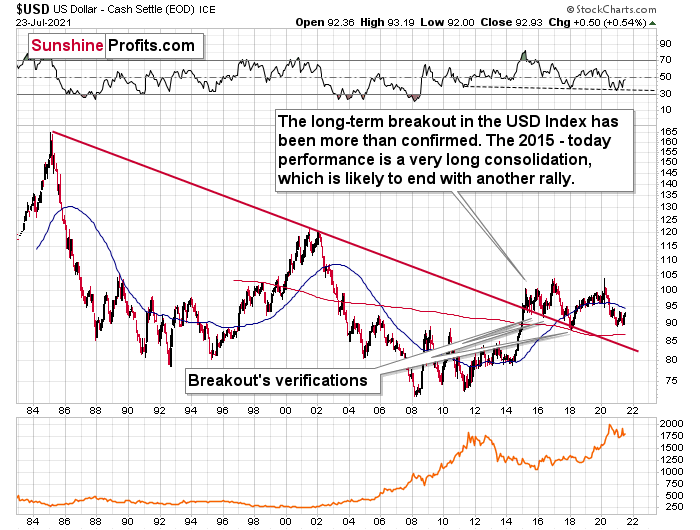
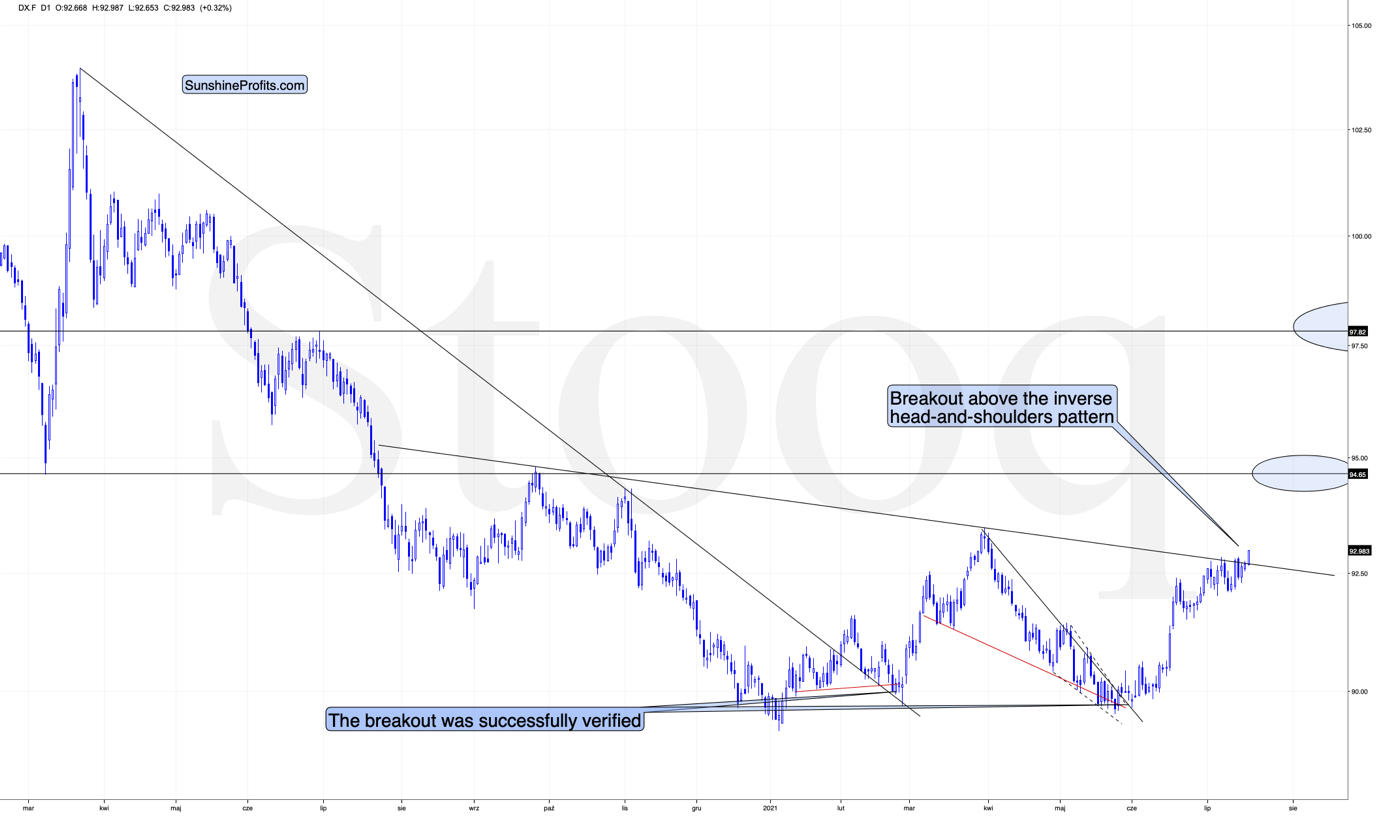
As further evidence, the eye in the sky doesn’t lie. And with the USDX’s long-term breakout clearly visible, the smart money is already backing the greenback.
Please see below:
The bottom line?
Once the momentum unfolds, ~94.5 is likely the USD Index’s first stop, ~98 is likely the next stop, and the USDX will likely exceed 100 at some point over the medium or long term. Keep in mind though: we’re not bullish on the greenback because of the U.S.’ absolute outperformance. It’s because the region is fundamentally outperforming the Eurozone, the EUR/USD accounts for nearly 58% of the movement of the USD Index, and the relative performance is what really matters.
In conclusion, the USD Index’s comeback dropped the guillotine on gold, silver and mining stocks, and with the GDXJ ETF (profits on our short position here increased further) also plunging by more than 5% last week, the greenback is having a profound impact on the precious metals. Moreover, with the latter also pressured by rising interest rates and the Fed’s increasingly hawkish rhetoric, lower lows are likely to materialize over the medium term. However, with robust fundamentals signaling a significant comeback over the long term, we eagerly await the opportunity to go long the precious metals once again.
Thank you for reading our free analysis today. Please note that the above is just a small fraction of the full analyses that our subscribers enjoy on a regular basis. They include multiple premium details such as the interim target for gold that could be reached in the next few weeks. We invite you to subscribe now and read today’s issue right away.
Sincerely,
Przemyslaw Radomski, CFA
Founder, Editor-in-chief -
Gold Investment Update: Gold Jumps for Joy Only to Hit the Ceiling… Hard
August 2, 2021, 10:01 AMPowell’s recent dovish remarks started a sugar high among investors. However, it seems like the hangover has already begun.
The Gold Miners
While gold, silver and mining stocks jumped for joy following Fed Chairman Jerome Powell’s dovish remarks on Jul. 28, their sugar high ended on Jul. 30. And while I warned that FOMC press conferences often elicit short-term bursts of optimism, it was likely another case of ‘been there, done that.’
I wrote prior to the announcement:
While the PMs may record a short-term bounce – which often occurs following Powell’s pressers – lower lows are still likely to materialize in the coming months.
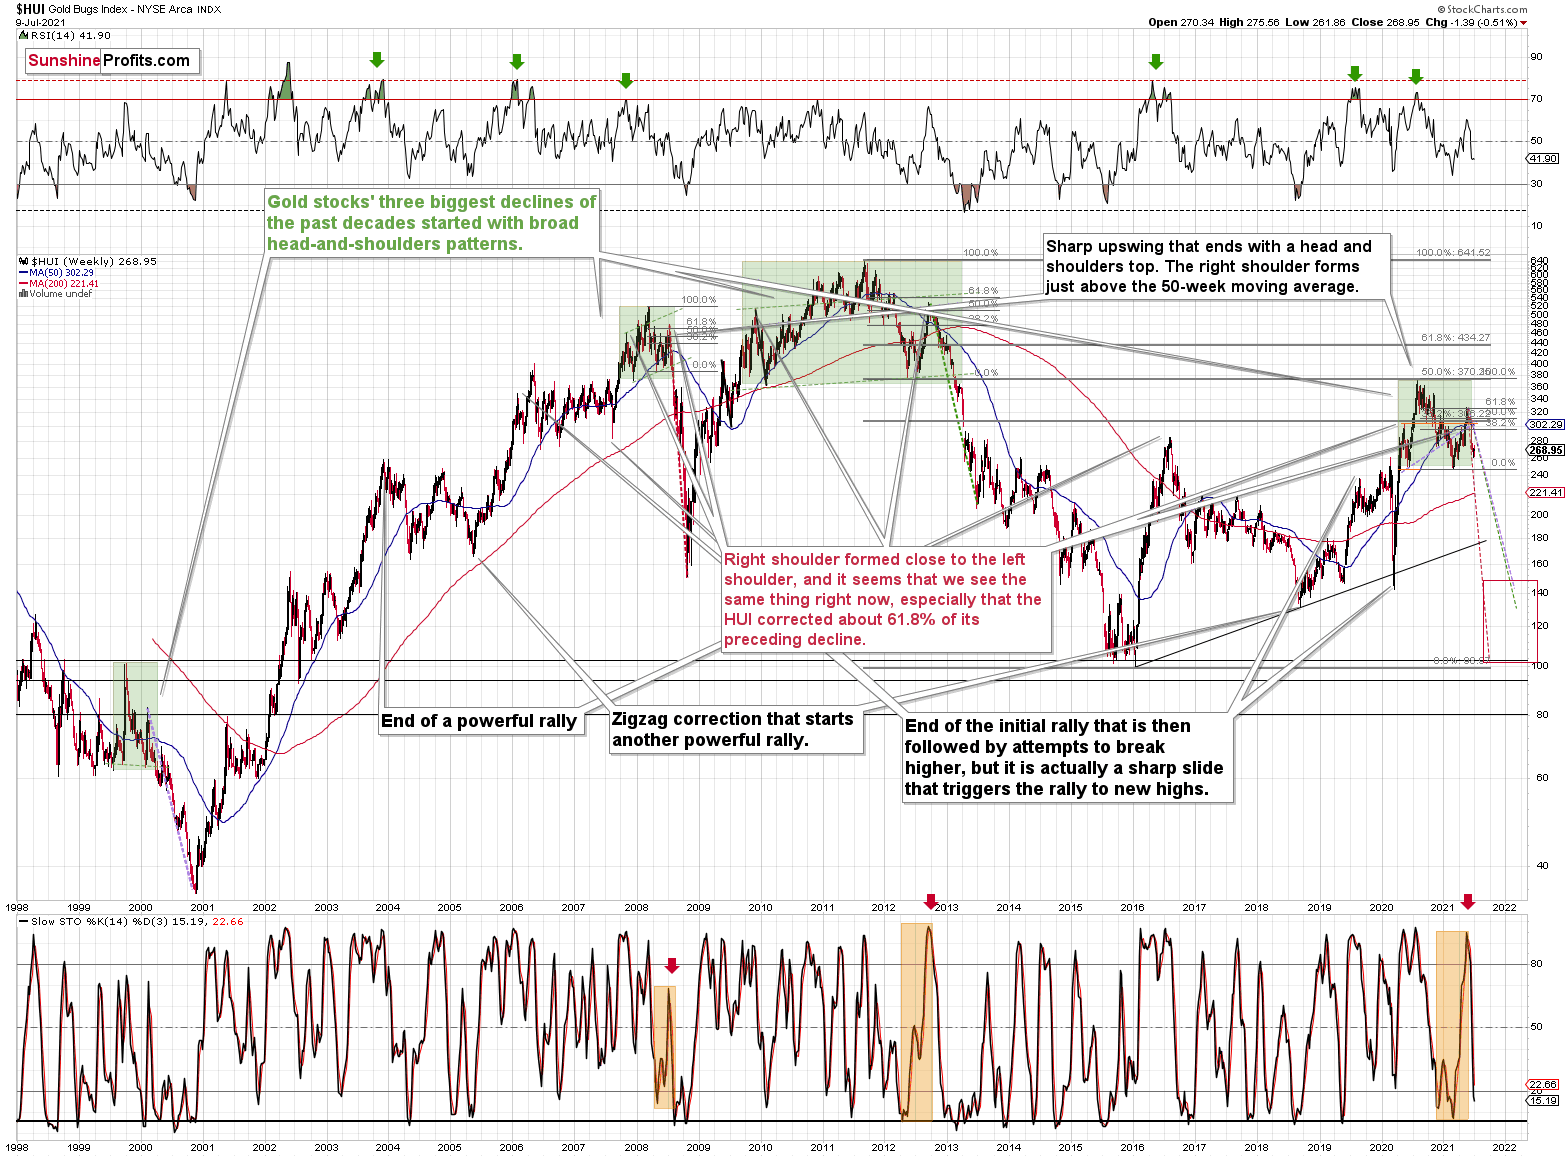
In the meantime, though, did you notice the tiny buy signal from the HUI Index’s stochastic indicator? And taking that into consideration, is it time to shift to the long side of the trade? Well, for one, it seems very likely that gold miners are declining similarly to how they declined in 2008 and 2012-2013. In both cases, there were local corrections within the decline. As a result, the recent strength does not justify adjusting our short positions in the junior mining stocks, and I continue to view them as prudent from the risk to reward point of view.
Second, after the HUI Index recorded an identical short-term buy signal in late 2012 – when the index’s stochastic indicator was already below the 20 level (around 10) and the index was in the process of forming the right shoulder of a huge, medium-term head-and-shoulders pattern – the HUI Index moved slightly higher, consolidated, and then fell off a cliff.
Please see below:
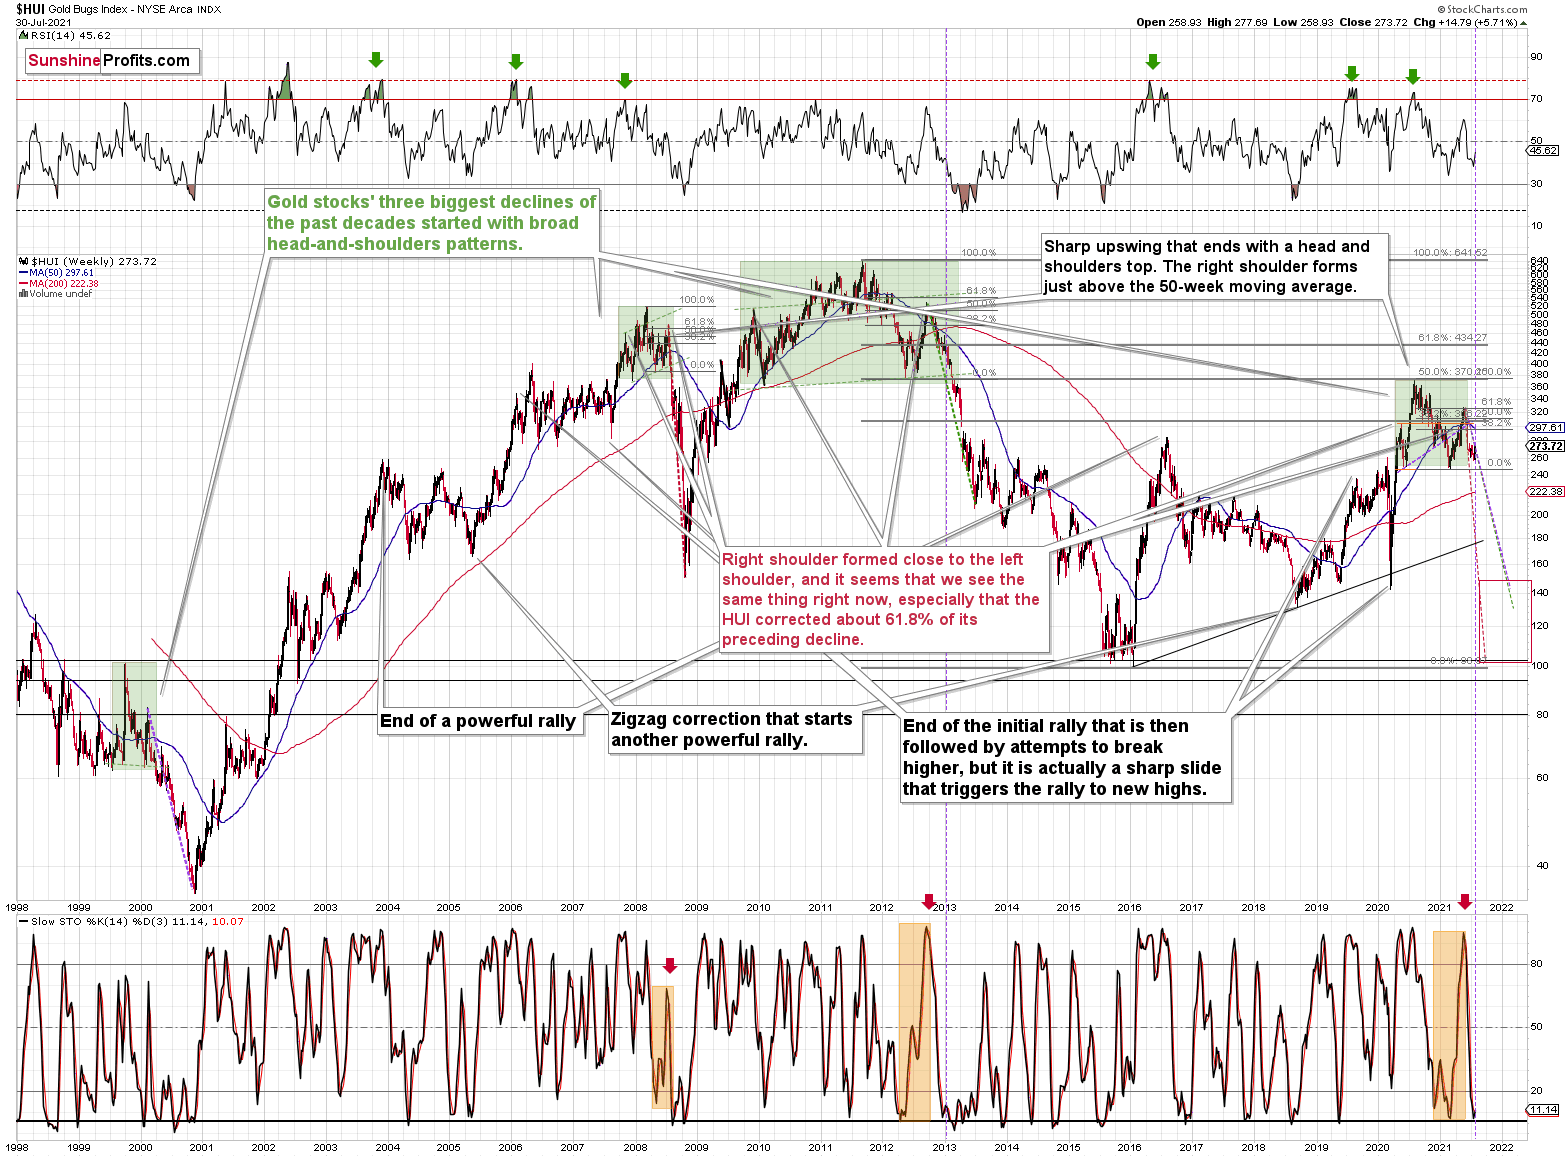
Can you see the HUI’s rally at the end of 2012 that followed a small buy signal from the stochastic indicator? I marked it with a purple, dashed line.
No? That’s because it’s been practically nonexistent. The HUI Index moved higher by so little that it’s impossible to see it from the long-term point of view.
With the shape of gold’s recent price action, its RSI, and its MACD indicators all mirroring the bearish signals that we witnessed back in December 2012, the current setup signals that we’re likely headed for a similar swoon. Thus, with both gold and the HUI Index sounding the alarm, if the bullish momentum continues, it’s likely to be very limited in terms of size and duration. Conversely, the following slide is likely to be truly profound.
For context, I warned previously that the miners’ drastic underperformance of gold was an extremely bearish sign. I wrote the following about the week beginning on May 24:
(…) gold rallied by almost $30 ($28.60) and at the same time, the HUI – a flagship proxy for the gold stocks… Declined by 1.37. In other words, gold stocks completely ignored gold’s gains. That shows exceptional weakness on the weekly basis and is a very bearish sign for the following weeks.
If it wasn’t extreme enough, we saw this one more time. Precisely, something similar happened during the week beginning on July 6. The gold price rallied by $27.40, and the HUI Index declined by 1.39.
Likewise, with the HUI Index’s ominous signals still present, if history rhymes (as it tends to), medium-term support will likely materialize in the 100-to-150 range. For context, high-end 2020 support implies a move back to 150, while low-end 2015 support implies a move back to 100. And yes, it could really happen, even though such predictions seem unthinkable.
In addition, the drastic underperformance of the HUI Index also preceded the bloodbath in 2008. To explain, right before the huge slide in late September and early October, gold was still moving to new intraday highs; the HUI Index was ignoring that, and then it declined despite gold’s rally. However, it was also the case that the general stock market suffered materially. If stocks didn’t decline back then so profoundly, gold stocks’ underperformance relative to gold would have likely been present but more moderate.
Nonetheless, bearish head & shoulders patterns have often been precursors to monumental collapses. For example, when the HUI Index retraced a bit more than 61.8% of its downswing in 2008 and in between 50% and 61.8% of its downswing in 2012 before eventually rolling over, in both (2008 and 2012) cases, the final top – the right shoulder – formed close to the price where the left shoulder topped. And in early 2020, the left shoulder topped at 303.02. Thus, three of the biggest declines in the gold mining stocks (I’m using the HUI Index as a proxy here) all started with broad, multi-month head-and-shoulders patterns. And in all three cases, the size of the declines exceeded the size of the head of the pattern.
Furthermore, when the HUI Index peaked on Sep. 21, 2012, that was just the initial high in gold. At that time, the S&P 500 was moving back and forth with lower highs. And what was the eventual climax? Well, gold made a new high before peaking on Oct. 5. In conjunction, the S&P 500 almost (!) moved to new highs, and despite bullish tailwinds from both parties, the HUI Index didn’t reach new heights. The bottom line? The similarity to how the final counter-trend rally ended in 2012 (and to a smaller extent in 2008) remains uncanny.
As a result, we’re confronted with two bearish scenarios:
- If things develop as they did in 2000 and 2012-2013, gold stocks are likely to bottom close to their early-2020 low.
- If things develop like in 2008 (which might be the case, given the extremely high participation of the investment public in the stock market and other markets), gold stocks could re-test (or break slightly below) their 2016 low.
In both cases, the forecast for silver, gold, and mining stocks is extremely bearish for the next several months.
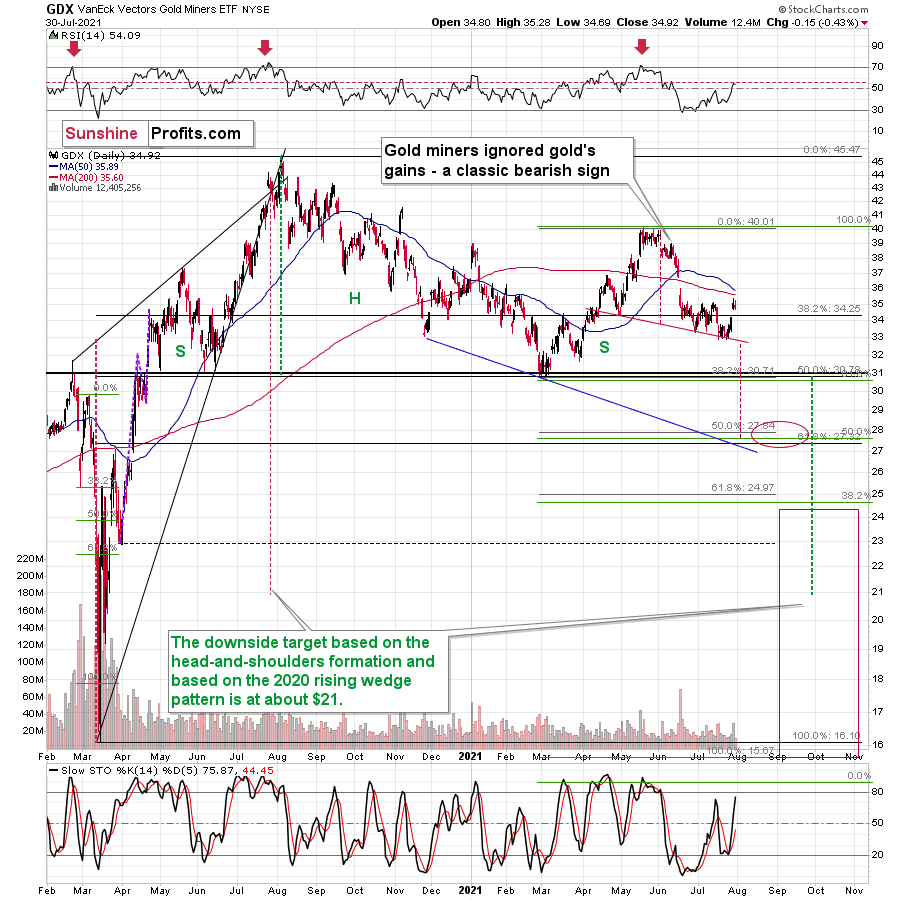
As further evidence, let’s compare the behavior of the GDX ETF and the GDXJ ETF. Regarding the former, the senior miners’ (GDX) RSI rose above 50 last week. However, the milestone preceded several corrective tops in 2020 and 2021. Thus, last week’s Fed-induced strength has only broadened the right shoulder of its bearish H&S pattern, and if completed, the size of the head implies a drawdown to roughly $28.
Please see below:
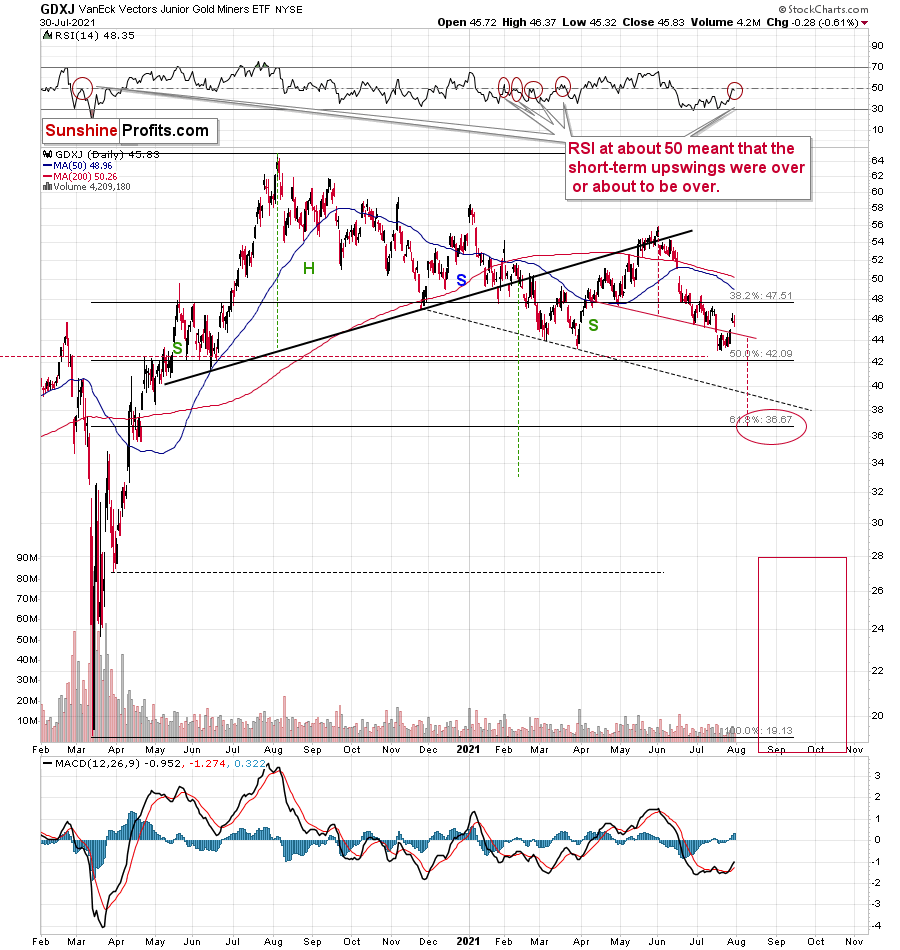
Meanwhile, the GDXJ ETF invalidated the breakdown below the neckline of its bearish H&S pattern last week. However, with the milestone likely a speed bump along the junior miners’ bearish journey, a mosaic of indications signal that their medium-term outlook remains quite somber. For context, with the junior miners’ RSI at 48.35, several flirtations with 50 coincided with the short-term peaks in 2021 and were followed by material declines. I marked these cases with red ellipses. And yes, it was also the case during the final corrective pre-slide upswing in March 2020.
The bottom line?
If gold repeats its June slide, it will decline by about $150. Taking the entire decline into account (since August 2020), for every $1 that gold fell, on average, the GDX was down by about 4 cents (3.945 cents) and GDXJ was down by about 6.5 cents (6.504 cents).
This means that if gold was to fall by about $150 and miners declined just as they did in the past year (no special out- or underperformance), they would be likely to fall by $5.92 (GDX) and $9.76 (GDXJ). This would imply price moves to $27.76 (GDX) and $35.78 (GDXJ).
In conclusion, gold, silver, and mining stocks received a helping hand from the Fed last week, as the charitable contribution uplifted the precious metals. However, while the central bank achieved its objective and talked down the U.S. dollar, prior bouts of short-term optimism faded once reality reemerged. As a result, with the USD Index now in season and the 2012 analogue looking more prescient by the day, gold, silver, and mining stocks will likely suffer profound declines in the coming months. However, with their long-term fundamentals still extremely bullish, new highs will likely dominate the headlines in the coming years.
Thank you for reading our free analysis today. Please note that the above is just a small fraction of the full analyses that our subscribers enjoy on a regular basis. They include multiple premium details such as the interim target for gold that could be reached in the next few weeks. We invite you to subscribe now and read today’s issue right away.
Sincerely,
Przemyslaw Radomski, CFA
Founder, Editor-in-chief -
Gold Investment Update: USDX Defends Its Growth Thesis - Will It Pass With Honors?
July 26, 2021, 9:54 AMThe USDX rose above its inverse H&S pattern neckline. After months-long preparation, is it ready to take its final test… and shine?
The USD Index (USDX)
With investors putting the USD Index through a rigorous exam last week (ending Jul. 23), months of study helped the greenback pass the test with flying colors. Case in point: with the USD Index rising above the neckline of its inverse (bullish) head & shoulders pattern, the head implies a medium-term target of roughly 98. On top of that, with the USD Index’s textbook validation adding to the bullish momentum last week – with the greenback verifying its recent breakout and responding with further strength – the U.S. dollar is likely to graduate with honors in the coming months.
What’s more, the bullish breakout was further validated when the USD Index closed the week above the neck level of its H&S pattern, and it’s difficult to imagine a more sanguine sign for the U.S. dollar. Thus, with the greenback poised to move sharply higher in the coming weeks, gold, silver and mining stocks are likely to head in the opposite direction.
In addition, the USD Index often sizzles in the summer sun. To explain, major USDX rallies often start during the middle of the year, and with the dollar’s bullish IQ often rising with the temperature, gold, silver and mining stocks will likely feel the heat over the medium term.
If you analyze the chart below, you can see that summertime surges have been mainstays on the USD Index’s historical record and double bottoms often signal the end of major declines or ignite significant rallies. For example, in 2004, 2005, 2008, 2011, 2014 and 2018, a retest of the lows (or close to them) occurred before the USD Index began its upward flights. In addition, back in 2008, U.S. equities’ plight added even more wind to the USD Index’s sails. And if the general stock market suffers another profound decline (along with gold miners and silver), a sharp re-rating of the USDX is likely in the cards.
Please see below (quick reminder: you can click on the chart to enlarge it):

On top of that, the eye in the sky doesn’t lie. And with the USDX’s long-term breakout clearly visible, the smart money is already backing the greenback.
Please see below:
As further evidence, the latest Commitments of Traders (COT) report shows that non-commercial (speculative) futures traders have increased their long exposure to the U.S. dollar (the light blue line below). More importantly, though, with longs bouncing off a roughly 10-year low and the current positioning still well below the highs set in previous years, the U.S. dollar still has plenty of room to run.
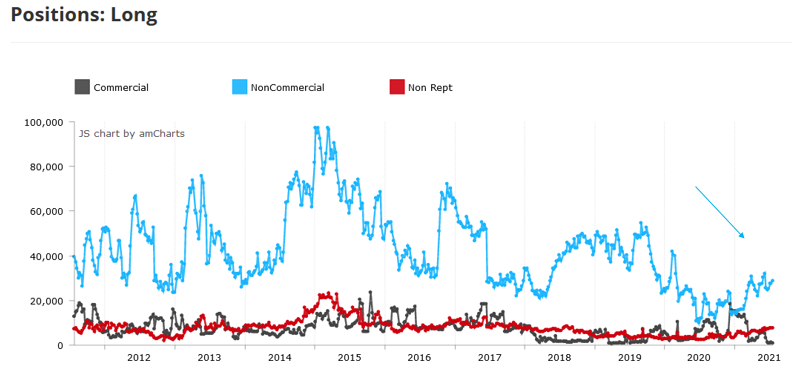 Source: COT
Finally, as the polar opposite of the USD Index, the Euro Index’s recent symmetrical decline mirrors the drawdown that we witnessed in mid-2020. And while the breakdown below the neckline of its bearish head & shoulders pattern still requires further verification, a continuation of the trend could usher the index back to the June 2020 lows or even lower. For context, the EUR/USD accounts for nearly 58% of the movement of the USD Index.
In addition, when the Euro Index reached the neckline of its bearish H&S pattern in early April 2021, late September 2020, and late October 2020, a fierce rally ensued. However, this time around, the corrective upswing has been extremely weak. As a result, with lower highs and lower lows plaguing the Euro Index in recent weeks, it’s likely only a matter of time before the neckline officially breaks.
Please see below:
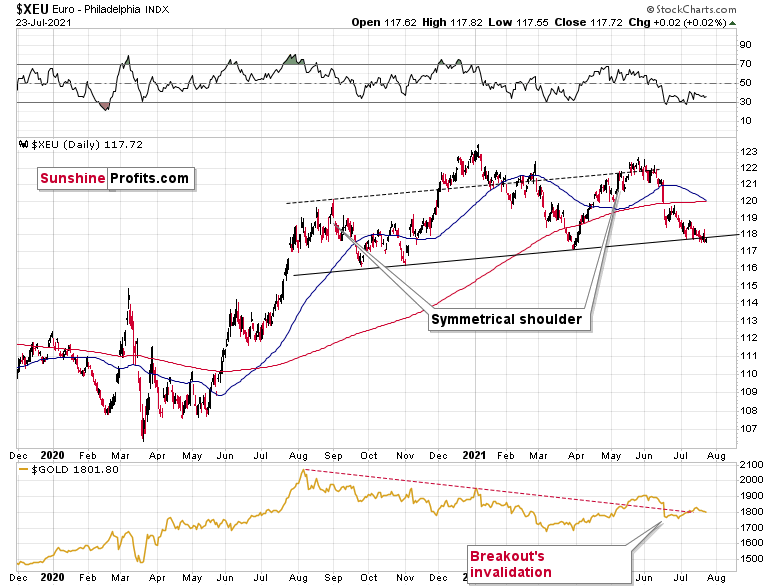
Even more relevant, the completion of the masterpiece could have a profound impact on gold, silver and mining stocks. To explain, gold continues to underperform the euro. If you analyze the bottom half of the chart above, you can see that material upswings in the Euro Index have resulted in diminishing marginal returns for the yellow metal. Thus, the relative weakness is an ominous sign. That’s another point for the bearish price prediction for gold.
The bottom line?
Once the momentum unfolds, ~94.5 is likely the USD Index’s first stop, ~98 is likely the next stop, and the USDX will likely exceed 100 at some point over the medium or long term. Keep in mind though: we’re not bullish on the greenback because of the U.S.’ absolute outperformance. It’s because the region is fundamentally outperforming the Eurozone, and the relative performance is what really matters.
In conclusion, the USD Index will likely emerge victorious in this epic battle of wits. Moreover, with the GDXJ ETF (our short position) avoiding mirroring gold’s recent strength, it seems that when the USDX finally does rally profoundly, junior mining stocks will fall substantially. However, following a profound climax, gold, silver and mining stocks will likely resume their secular uptrends.
Thank you for reading our free analysis today. Please note that the above is just a small fraction of the full analyses that our subscribers enjoy on a regular basis. They include multiple premium details such as the interim target for gold that could be reached in the next few weeks. We invite you to subscribe now and read today’s issue right away.
Sincerely,
Przemyslaw Radomski, CFA
Founder, Editor-in-chief -
Gold Investment Update: USDX - A Crocodile Just About To Strike
July 19, 2021, 8:46 AMTaking a sip from a crocodile pond is risky, but some animals try anyway. And die. Beware, as trying to profit from the PM’s pool now could end alike.
Just as ignoring a crocodile hiding in plain sight, ignoring the USD Index is a dangerous activity. And while investors continue to drink from the pond, the greenback’s nose is literally perched at the water’s surface. The USD Index is currently consolidating below the neckline of its inverse (bullish) head & shoulders pattern, so its wide eyes are also glaringly visible. And with a strike liable to happen at any moment, a leap above 93 could make the USD Index devour gold, silver and mining stocks.
To explain, the USD Index often soars during the summer months (major USDX rallies often start during the middle of the year), and while the greenback’s back-and-forth movement has uplifted the PMs, once the USDX resumes its likely uptrend, the former’s optimism could dissipate rather quickly. As a result, if the ambush ushers the USD Index above 93, the next stop is likely 98.
Please see below:
Furthermore, the seasonal thesis remains intact: I mentioned above that the USD Index often records material upswings during the middle of the year. And with the hunter’s disguise nearly always catching overzealous investors by surprise, will the next trap be any different?
In fact, the USD index seems to be breaking above the neck level of its inverse head-and-shoulders formation at the moment of writing these words.
The week started with a breakout, so there’s plenty of time for the markets to react before the next bigger break takes place (the next weekend). In other words, this week could be quite volatile and nothing like the previous weeks’ boredom. Gold, silver, and mining stocks might slide quite profoundly before we hear Friday’s closing bell.
If you analyze the chart below, you can see that summertime surges have been mainstays on the USD Index’s historical record and double bottoms often signal the end of major declines or ignite significant rallies. For example, in 2004, 2005, 2008, 2011, 2014 and 2018, a retest of the lows (or close to them) occurred before the USD Index began its upward flights. In addition, back in 2008, U.S. equities’ plight added even more wind to the USD Index’s sails. And if the general stock market suffers another profound decline (along with gold miners and silver), a sharp re-rating of the USDX is likely in the cards.
Please see below (quick reminder: you can click on the chart to enlarge it):
On top of that, the eye in the sky doesn’t lie. And with the USDX’s long-term breakout clearly visible, a profound uptrend is already in place.
Please see below:

As another important variable, the Euro Index’s recent symmetrical decline mirrors the drawdown that we witnessed in mid-2020. And if the Euro Index breaks below the neckline of its bearish head & shoulders pattern, the steep decline could usher the index back to the June 2020 lows or even lower. For context, the EUR/USD accounts for nearly 58% of the movement of the USD Index.
In addition, when the Euro Index reached the neckline of its bearish H&S pattern in early April 2021, late September 2020, and late October 2020, a fierce rally ensued. However, this time around, the corrective upswing has been extremely weak. As a result, with lower highs and lower lows plaguing the Euro Index in recent weeks, it’s likely only a matter of time before the neckline breaks.
Please see below:
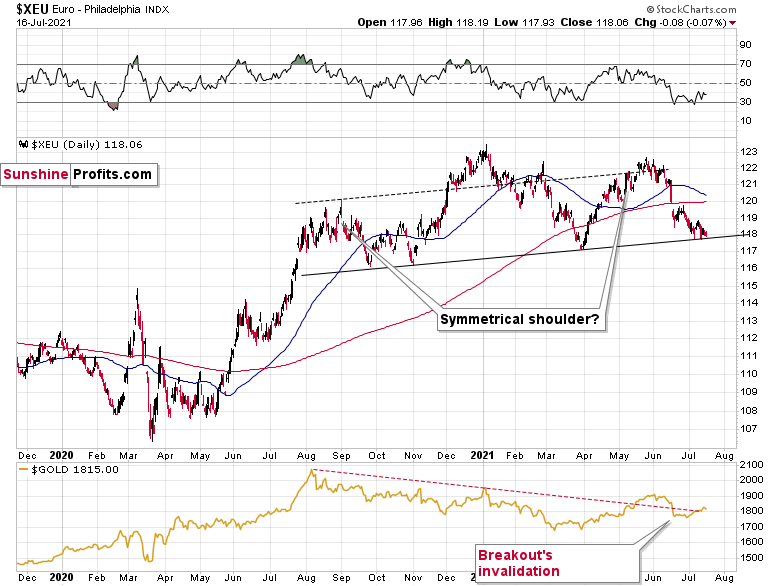
Even more relevant, the completion of the masterpiece could have a profound impact on gold, silver and mining stocks. To explain, gold continues to underperform the euro. If you analyze the bottom half of the chart above, you can see that material upswings in the Euro Index have resulted in diminishing marginal returns for the yellow metal. Thus, the relative weakness is an ominous sign. That’s another point for the bearish price prediction for gold.
The bottom line?
Once the momentum unfolds, ~94.5 is likely the USD Index’s first stop, ~98 is likely the next stop, and the USDX will likely exceed 100 at some point over the medium or long term. Keep in mind though: we’re not bullish on the greenback because of the U.S.’ absolute outperformance. It’s because the region is fundamentally outperforming the Eurozone, and the relative performance is what really matters.
In conclusion, while gold, silver and mining stocks are increasingly treading water, the USD Index’s jaws are expanding. And with the greenback poised to take a bite out of the trio’s performance over the medium term, the precious metals could be in for a long and arduous recovery. However, after the drama unfolds, gold, silver and mining stocks are poised to continue their long-term secular uptrends.
Thank you for reading our free analysis today. Please note that the above is just a small fraction of the full analyses that our subscribers enjoy on a regular basis. They include multiple premium details such as the interim target for gold that could be reached in the next few weeks. We invite you to subscribe now and read today’s issue right away.
Sincerely,
Przemyslaw Radomski, CFA
Founder, Editor-in-chief -
Gold Investment Update: High Time to Move Out of the Penthouse
July 10, 2021, 12:31 PMGold’s days in a glamorous apartment at the top of the PMs’ building are numbered. We’d better prepare for a rapid elevator ride to the first floor.
The Gold Miners
With the gold miners essentially running laps on the treadmill, the HUI Index, the GDX ETF, and the GDXJ ETF are working extremely hard but making little progress. And with the gambit resulting in ‘one step forward, two steps back,’ frustrating exhaustion has mining stocks questioning their every move. To that point, even though the trio transitioned from the conveyor belt to the stairs in recent weeks, history shows that slow climbs often culminate with elevator rides lower. Should we expect a different outcome this time around?
Gold ended the week in the green (up by $27.30), but the HUI Index was stuck in the red (down by 1.39). This is extremely noteworthy, as a similar divergence occurred at the end of May. For context, when the yellow metal rallied by $28.60 in a week back then, the HUI Index fell by 1.37 index points.
In the following weeks, the HUI Index declined by about 50 index points, while gold declined by about $150.
And with the ominous imbalance preceding the pair’s precipitous declines, again, should we expect a different outcome this time around?
Please see below:
To explain, with the HUI Index unable to muster any meaningful relief rallies, I warned that the recent plunge was weeks in the making:
I wrote the following about the week beginning on May 24:
What happened three weeks ago was that gold rallied by almost $30 ($28.60) and at the same time, the HUI – a flagship proxy for the gold stocks… Declined by 1.37. In other words, gold stocks completely ignored gold’s gains. That shows exceptional weakness on the weekly basis and is a very bearish sign for the following weeks.
To that point, with the HUI Index’s ominous signals only increasing, if history rhymes (as it tends to), medium-term support will likely materialize in the 100-to-150 range. For context, high-end 2020 support implies a move back to 150, while low-end 2015 support implies a move back to 100. And yes, it could really happen, even though such predictions seem unthinkable.
Furthermore, with the junior miners often suffering the most during medium-term drawdowns, short positions in the GDXJ ETF will likely offer the best risk-reward ratio. For context, if you held firm in 2008 and 2013 and maintained your short positions, you almost certainly realized substantial profits. And while there are instances when it’s wise to exit one’s short positions, the prospect of missing out on the forthcoming slide makes it quite risky.
Even more bearish, a drastic underperformance by the HUI Index also preceded the bloodbath in 2008. To explain, right before the huge slide in late September and early October, gold was still moving to new intraday highs; the HUI Index was ignoring that, and then it declined despite gold’s rally. However, it was also the case that the general stock market suffered materially. If stocks didn’t decline back then so profoundly, gold stocks’ underperformance relative to gold would have likely been present but more moderate.
Nonetheless, the HUI Index’s bearish head-and-shoulders pattern is already sounding the alarm. When the HUI Index retraced a bit more than 61.8% of its downswing in 2008 and in between 50% and 61.8% of its downswing in 2012 before eventually rolling over, in both (2008 and 2012) cases, the final top – the right shoulder – formed close to the price where the left shoulder topped. And in early 2020, the left shoulder topped at 303.02. Thus, three of the biggest declines in the mining stocks (I’m using the HUI Index as a proxy here), all started with broad, multi-month head-and-shoulders patterns. And in all three cases, the size of the declines exceeded the size of the head of the pattern.
In addition, when the HUI Index peaked on Sep. 21, 2012, that was just the initial high in gold. At that time, the S&P 500 was moving back and forth with lower highs. And what was the eventual climax? Well, gold made a new high before peaking on Oct. 5. In conjunction, the S&P 500 almost (!) moved to new highs, and despite bullish tailwinds from both parties, the HUI Index didn’t reach new heights. The bottom line? The similarity to how the final counter-trend rally ended in 2012 (and to a smaller extent in 2008) remains uncanny.
As a result, we’re confronted with two bearish scenarios:
- If things develop as they did in 2000 and 2012-2013, gold stocks are likely to bottom close to their early-2020 low.
- If things develop like in 2008 (which might be the case, given the extremely high participation of the investment public in the stock market and other markets), gold stocks could re-test (or break slightly below) their 2016 low.
Keep in mind though: scenario #2 most likely requires equities to participate. In 2008 and 2020, sharp drawdowns in the HUI Index coincided with significant drawdowns of the S&P 500. However, with the Fed turning hawkish and investors extremely allergic to higher interest rates, the likelihood of a three-peat remains relatively high.
As further evidence, let’s analyze the behavior of the GDX ETF and the GDXJ ETF. Regarding the former, the senior miners celebrated gold’s strength by falling to their previous lows on Jul. 8. If this is not a shocking proof of extreme underperformance, then I don’t know what would be one.
Please see below:
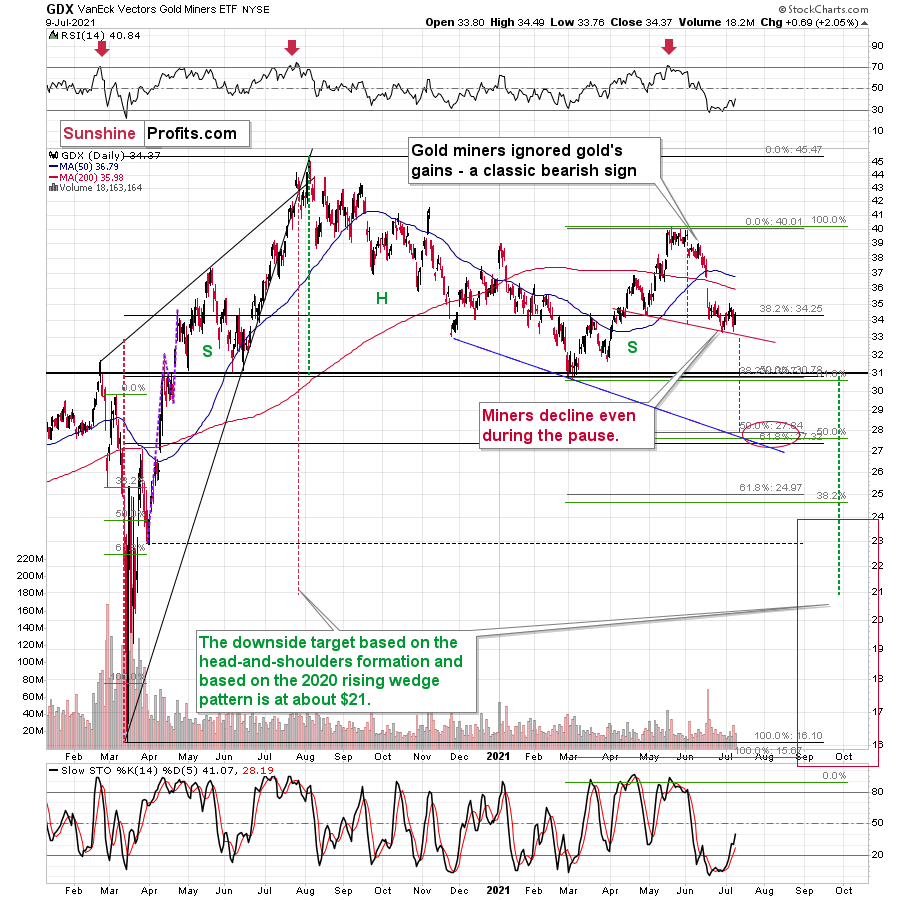
Regarding the latter, on Jun. 29 (the June low), the GDXJ ETF closed at $45.83. And on Jul. 8, it closed at $45.53. Ladies and gentlemen, we had a breakdown.
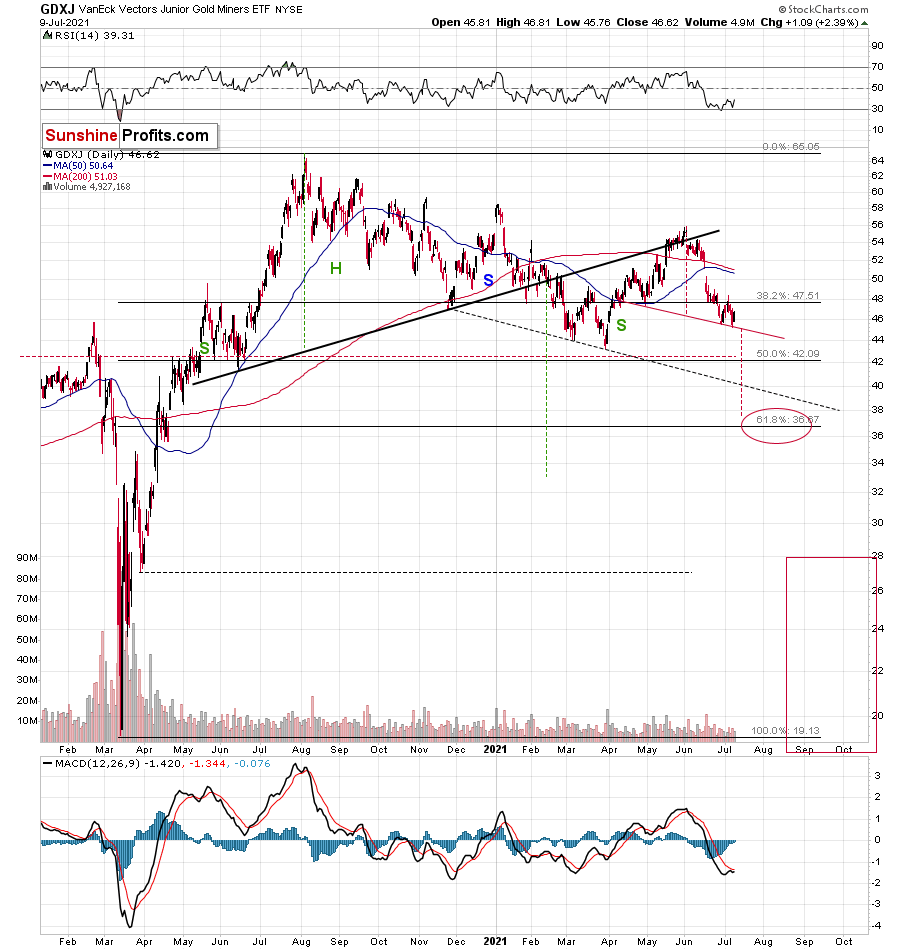
Of course, we see that the breakdown was invalidated, but the fact that it moved to new lows while gold rallied is extremely bearish. It seems like the junior miners simply can’t wait to break to new lows.
The bottom line?
If gold repeats its June slide, it will decline by about $150. Taking the entire decline into account (since August 2020), for every $1 that gold fell, on average, the GDX was down by about 4 cents (3.945 cents) and GDXJ was down by about 6.5 cents (6.504 cents).
This means that if gold was to fall by about $150 and miners declined just as they did so far in the past year (no special out- or underperformance), they would be likely to fall by $5.92 (GDX) and $9.76 (GDXJ). Given the Jul. 8 closing prices, this would imply price moves to $27.76 (GDX) and $35.78 (GDXJ). So, the profits on the current short position are likely to soar.
In conclusion, while the HUI Index, the GDX ETF and the GDXJ ETF are likely to have some small breathers along the way, their sprints lower are likely far from finished. When we combine their extreme underperformance relative to gold with the bearish 2008 and 2012 analogues, the gold miners might just huff and puff and blow their own houses down. As a result, while 2021 has already delivered two desperate pleas for more oxygen, the trio will likely require a third ventilator in the coming months. The outlook for the following weeks remains very bearish.
Thank you for reading our free analysis today. Please note that the above is just a small fraction of the full analyses that our subscribers enjoy on a regular basis. They include multiple premium details such as the interim target for gold that could be reached in the next few weeks. We invite you to subscribe now and read today’s issue right away.
Sincerely,
Przemyslaw Radomski, CFA
Founder, Editor-in-chief


Gold Alerts
More-
Status
New 2024 Lows in Miners, New Highs in The USD Index
January 17, 2024, 12:19 PM -
Status
Soaring USD is SO Unsurprising – And SO Full of Implications
January 16, 2024, 8:40 AM -
Status
Rare Opportunity in Rare Earth Minerals?
January 15, 2024, 2:06 PM
Dear Sunshine Profits,


