

-
Gold Investment Update: Will Gold Break Your Heart?
November 15, 2021, 9:36 AMInfatuated with gold? Many people are, but love affairs with commodities (or stocks) are dangerous. They’ll steal your heart, then dump you.
Our critics often forget that we’re focusing on the medium-term outlook in precious metals, not intraday price moves. They’ll say “Look, gold moved up today. You were wrong Radomski.” That’s nice, but where will it be one or two months from now?
While gold, silver and mining stocks’ optimism resurfaced with a vengeance last week, the trio have broken plenty of hearts since peaking in August 2020. Thus, will the current rallies end in marriage or be another mirage?
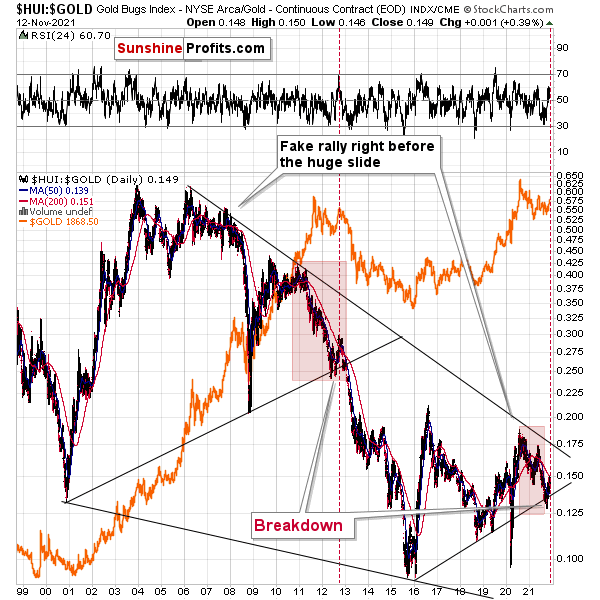
To begin, while the HUI Index/gold ratio invalidated the breakdown below its rising support line, a similar development occurred in 2013 and the downtrend still resumed.
On top of that, I marked (with the shaded red boxes below) just how similar the current price action is to 2013. And back then, after a sharp decline was followed by a small corrective upswing before the plunge, the ratio’s current behavior mirrors its historical counterpart. Furthermore, the end of the corrective upswing in 2013 occurred right before the gold price sunk to its previous lows (marked with red vertical dashed lines in the middle of the chart below). Thus, the ratio is already sending ominous warnings about the PMs’ future path.
Even more revealing, the ratio is dangerously close to its 200-day moving average. And when a similar development occurred in 2013 – with the ratio rising slightly above its 200-day moving average (marked with the red vertical dashed line below) – a sharp reversal occurred, mining stocks materially underperformed, and the ratio plunged.
Please see below:
Likewise, while the GDX ETF rallied again last week, I warned previously that a corrective upswing to $35 was a possibility (the senior miners reached this level intraday on Nov. 12). However, with the GDX ETF’s RSI (Relative Strength Index) signaling overbought conditions, the air should come out of the balloon sooner rather than later.
Please see below:
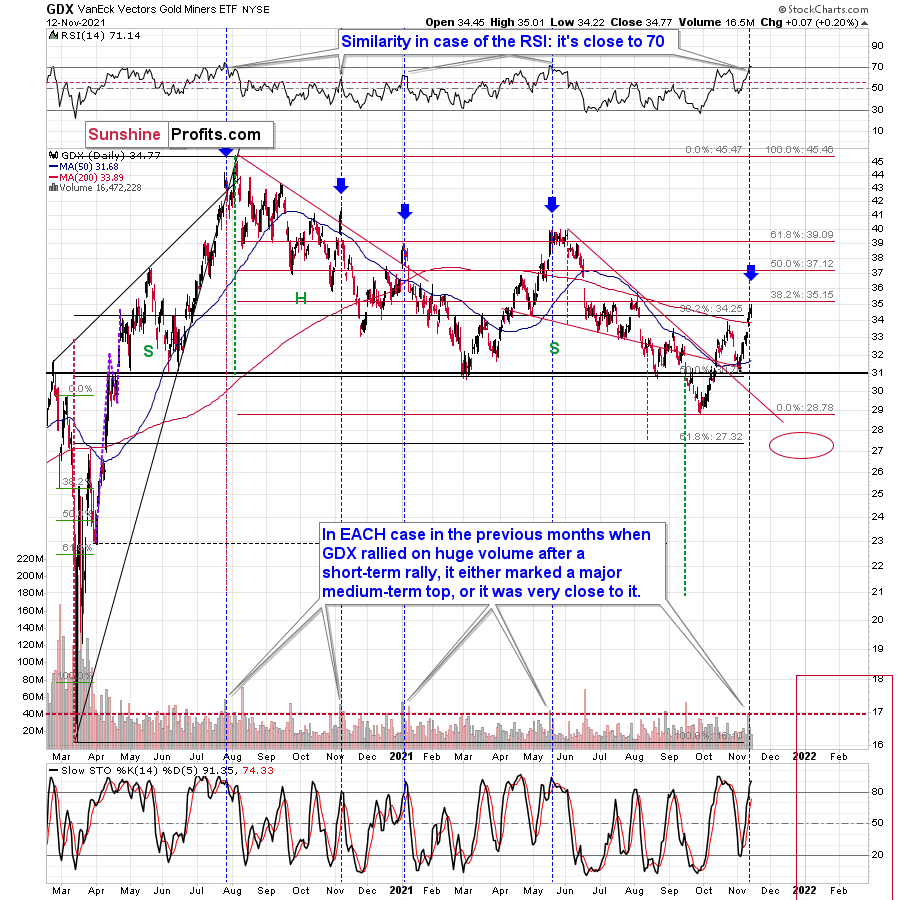
To explain, the GDX ETF rallied on huge volume on Nov. 11 and there were only 4 cases in the recent past when we saw something like that after a visible short-term rally.
In EACH of those 4 cases, GDX was after a sharp daily rally.
In EACH of those 4 cases, GDX-based RSI indicator (upper part of the chart above) was trading close to 70.
The rallies that immediately preceded these 4 cases:
- The July 27, 2020 session was immediately preceded by a 29-trading-day rally that took the GDX about 42% higher. It was 7 trading days before the final top (about 24% of time).
- The November 5, 2020 session was immediately preceded by a 5- trading -day rally that took the GDX about 14%-15% higher (the high-volume day / the top). It was 1 trading day before the final top (20% of time).
- The January 4, 2021 session was immediately preceded by a 26-trading-day rally that took the GDX about 17%-18% higher (the high-volume day / the top). It was 1 trading day before the final top (about 4% of time).
- The May 17, 2021 session was immediately preceded by a 52-trading-day rally that took the GDX about 30% higher. It was 7 trading days before the final top (about 13% of time).
So, as you can see, these sessions have even more in common than it seemed at first sight. The sessions formed soon before the final tops (4% - 24% of time of the preceding rally before the final top), but the prices didn’t move much higher compared to how much they had already rallied before the high-volume sessions.
Consequently, since the history tends to rhyme, we can expect the GDX ETF to move a bit higher here, but not significantly so, and we can expect this extra move higher to take between an additional 0 and 7 trading days (based on the Nov. 12 session, so as of Nov. 15 it’s between 0 and 6 trading days).
Why 0 – 6 trading days (as of today – Nov. 15)? Because with the 4% timeline now in the rearview, the latter represents the updated 24% timeline based on the preceding rally (that took 30 trading days).
Since it’s unlikely to take the mining stocks much higher, and the reversal could take place as soon as today (also in gold and silver price), I don’t think that making adjustments to the current short positions in the mining stocks is justified from the risk to reward point of view.
Is there a meaningful resistance level that would be likely to trigger a decline in mining stocks? Yes! The GDX ETF is just below its 38.2% Fibonacci retracement level based on the August 2020 – September 2021 decline. The resistance is slightly above $35, so that’s when the final top could form.
As for the GDXJ ETF, the gold junior miners have already hit their 38.2% Fibonacci retracement level (potential resistance) and the top may be upon us. Moreover, when the GDXJ ETF’s RSI increased above (or near) 70 in mid-2020 and in mid-2021, sharp drawdowns followed.
As a result, those historical readings provided us with great shorting opportunities.
In conclusion, investors have fallen in love with gold, silver, and mining stocks once again. However, when it comes time for matrimony, the precious metals often leave investors at the altar. As a result, while we remain bullish on gold, silver, and mining stocks’ long-term prospects, timing is important. And while the recent upswings may seem like the beginning of a new bull market, several reliable indicators beg to differ. Thus, caution is warranted, and new lows will likely materialize over the medium term.
Thank you for reading our free analysis today. Please note that the above is just a small fraction of the full analyses that our subscribers enjoy on a regular basis. They include multiple premium details such as the interim target for gold that could be reached in the next few weeks. We invite you to subscribe now and read today’s issue right away.
Sincerely,
Przemyslaw Radomski, CFA
Founder, Editor-in-chief -
Early (Gold Video) Heads-up before the Next Week
November 14, 2021, 9:57 AMThe early heads-up video is available to premium subscribers.
-
Gold Investment Update: USD Index – Are New Milestones in the Cards?
November 8, 2021, 9:46 AMWhile the greenback’s failed breakout on Nov. 4th may seem bearish, it faced a similar situation in August and October, only to recover and achieve new highs.
After the USD Index’s negative response to the ECB’s monetary policy meeting on Oct. 28, I warned on Oct. 29 that dollar bears were unlikely to celebrate for much longer. I wrote:
Based on the rather random comment during the conference, the traders panicked and bought the EUR/USD, which triggered declines in the USD Index (after all, the EUR/USD is the largest component of the USDX).
Was the breakout to new 2021 lows invalidated? No. The true breakout was above the late-March highs (the August highs also served as a support level, but the March high is more important here) and it wasn’t invalidated.
What was the follow-up action? At the moment of writing these words, the USDX is up and trading at about 93.52, which is just 0.07 below the August high in terms of the closing prices. Consequently, it could easily be the case that the USD Index ends today’s session (and the week) back above this level.
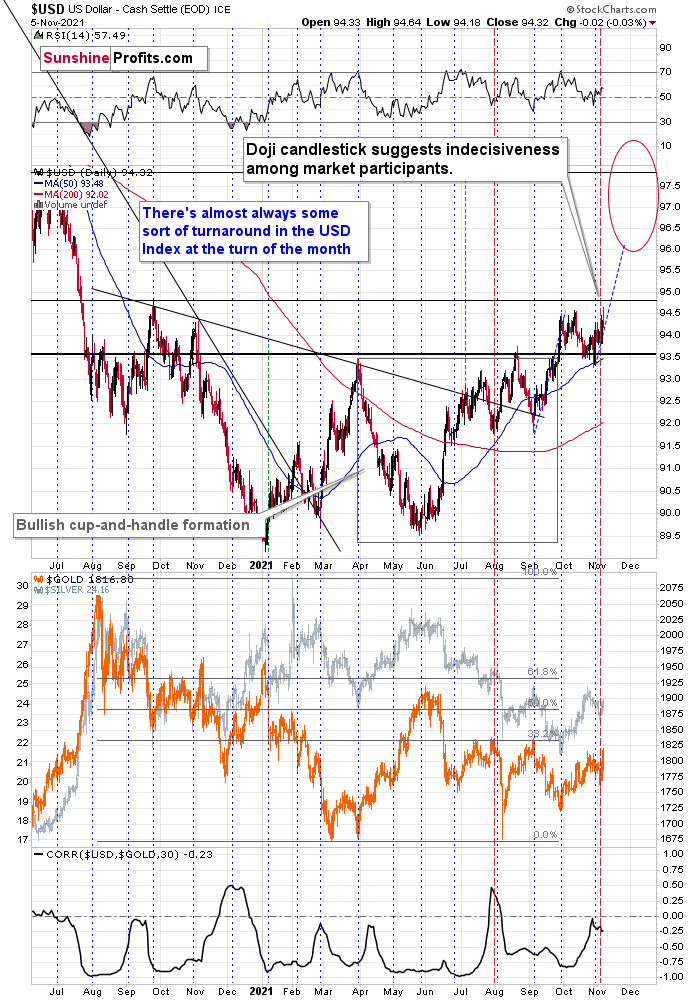
You’ve probably heard the saying that time is more important than price. It’s the end of the month, so let’s check what happened in the case of previous turns of the month; that’s where we usually see major price turnarounds. I marked the short-term turnarounds close to the turns of the month with horizontal dashed blue lines, and it appears that, in the recent past, there was practically always some sort of a turnaround close to the end of the month. Consequently, seeing a turnaround (and a bottom) in the USD index now would be perfectly normal.
And after the forecast turned into reality, the USD Index surged above 94 and remains poised to resume its uptrend over the medium term. To explain, if we zoom in on the four-hour chart, it highlights the importance of the price action on Nov. 5. During the session, the USD Index hit a new 2021 intraday high before a small reversal occurred. This might seem bearish at the first sight (it’s a failed breakout, after all)…
However, similar developments were also present in August and October. After the dollar basket attempted to make new highs and failed, the greenback eventually regained its composure and achieved the milestones. As a result, another 2021 high should occur sooner rather than later.
Please see below:
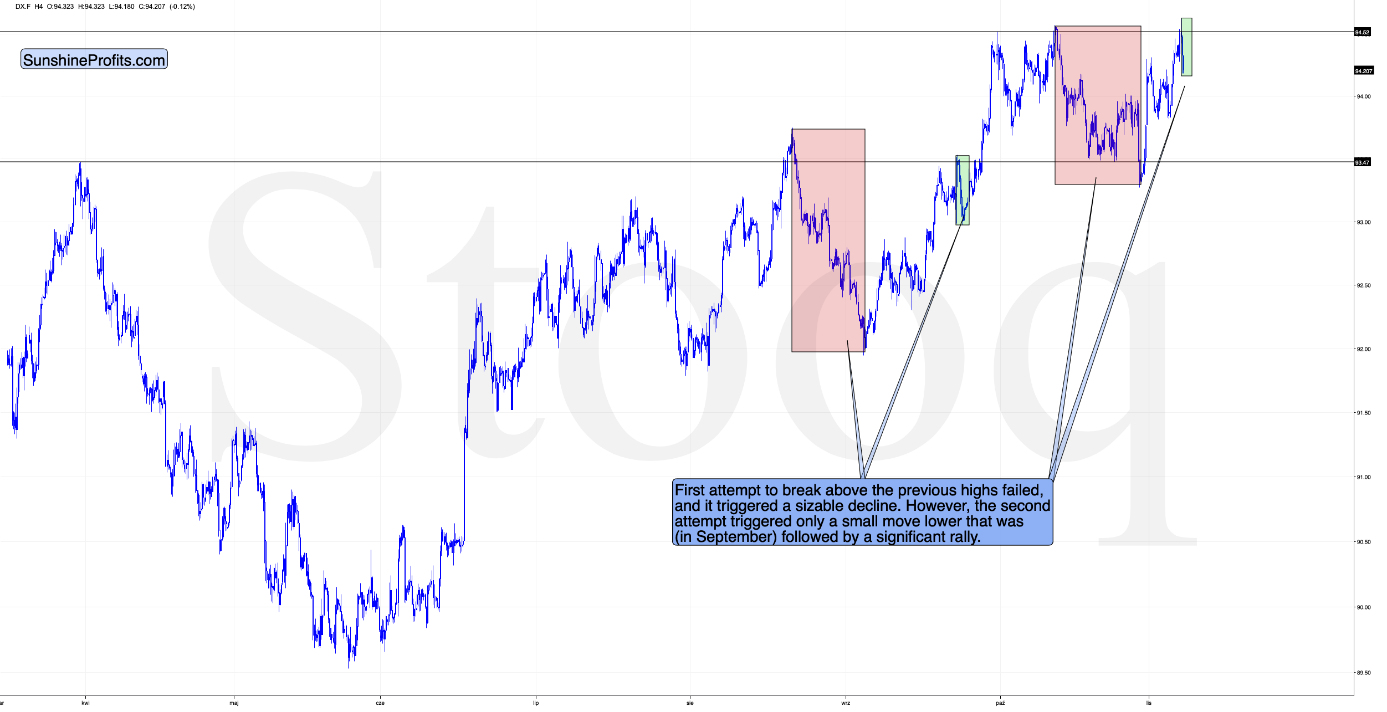
The first failed attempt to break above the previous highs triggered sizable short-term declines. This happened in August (marked with red). The second – September – attempt triggered only a small correction (marked with green) that was then followed by a bigger rally.
Similarly, the – marked with red – October invalidation was followed by a sizable decline, and the current one (marked with green), is relatively small. And it’s likely to be followed by a short-term rally, just like the September correction was.
On top of that, as you can see on the below chart, the current setup for the USD Index and gold mirrors what we witnessed in early August. Following its sharp summertime rally, the USD Index moved close to its 50-day moving average without reaching it. And after buyers stepped in, the USD Index resumed its uptrend and made a new 2021 high. Moreover, with a similar pattern and a similar reading on the USD Index’s RSI (Relative Strength Index) present today, the greenback’s outlook remains robust. I marked both cases with red, vertical, dashed lines below.
More importantly, though gold, silver, and mining stocks’ upswings concluded once the USD Index bottomed close to its 50-day moving average in August and sharp drawdowns followed. Moreover, while gold, silver, and mining stocks’ recent rallies were likely underwritten by expectations of a weaker USD Index (it did fail to move to new highs, right?) , technical (as described above and below) and fundamental realities contrast this thesis.
As a result, the 2021 theme of ‘USD Index up, PMs down’ will likely resume over the medium term.
Please see below:
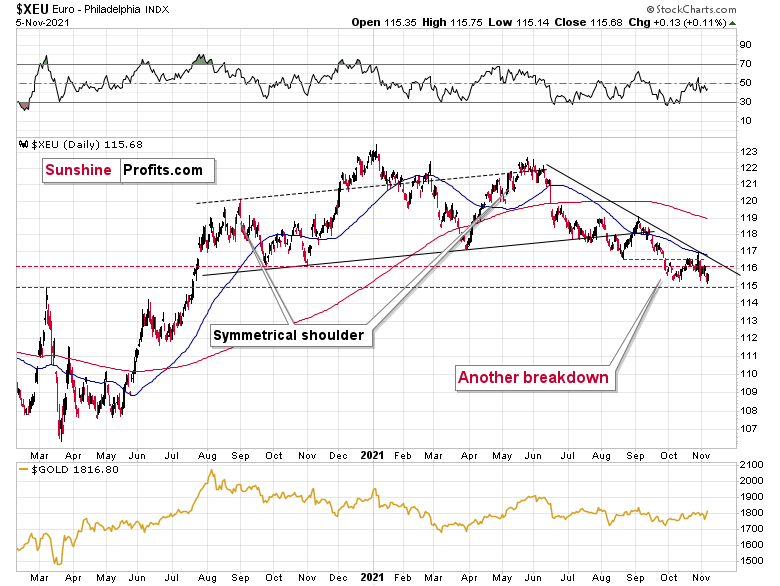
Equally bullish for the greenback, the Euro Index remains overvalued and should suffer a material drawdown over the medium term. For example, the index’s previous lows, its 50-day moving average, and its declining resistance line combined to create major resistance and the Euro Index is now retesting its 2021 lows.
As a result, the next temporary stop could be ~1.1500 (the March 2020 highs, then likely lower). For context, the EUR/USD accounts for nearly 58% of the movement of the USD Index, and that’s why the euro’s behavior is so important.
Please see below:
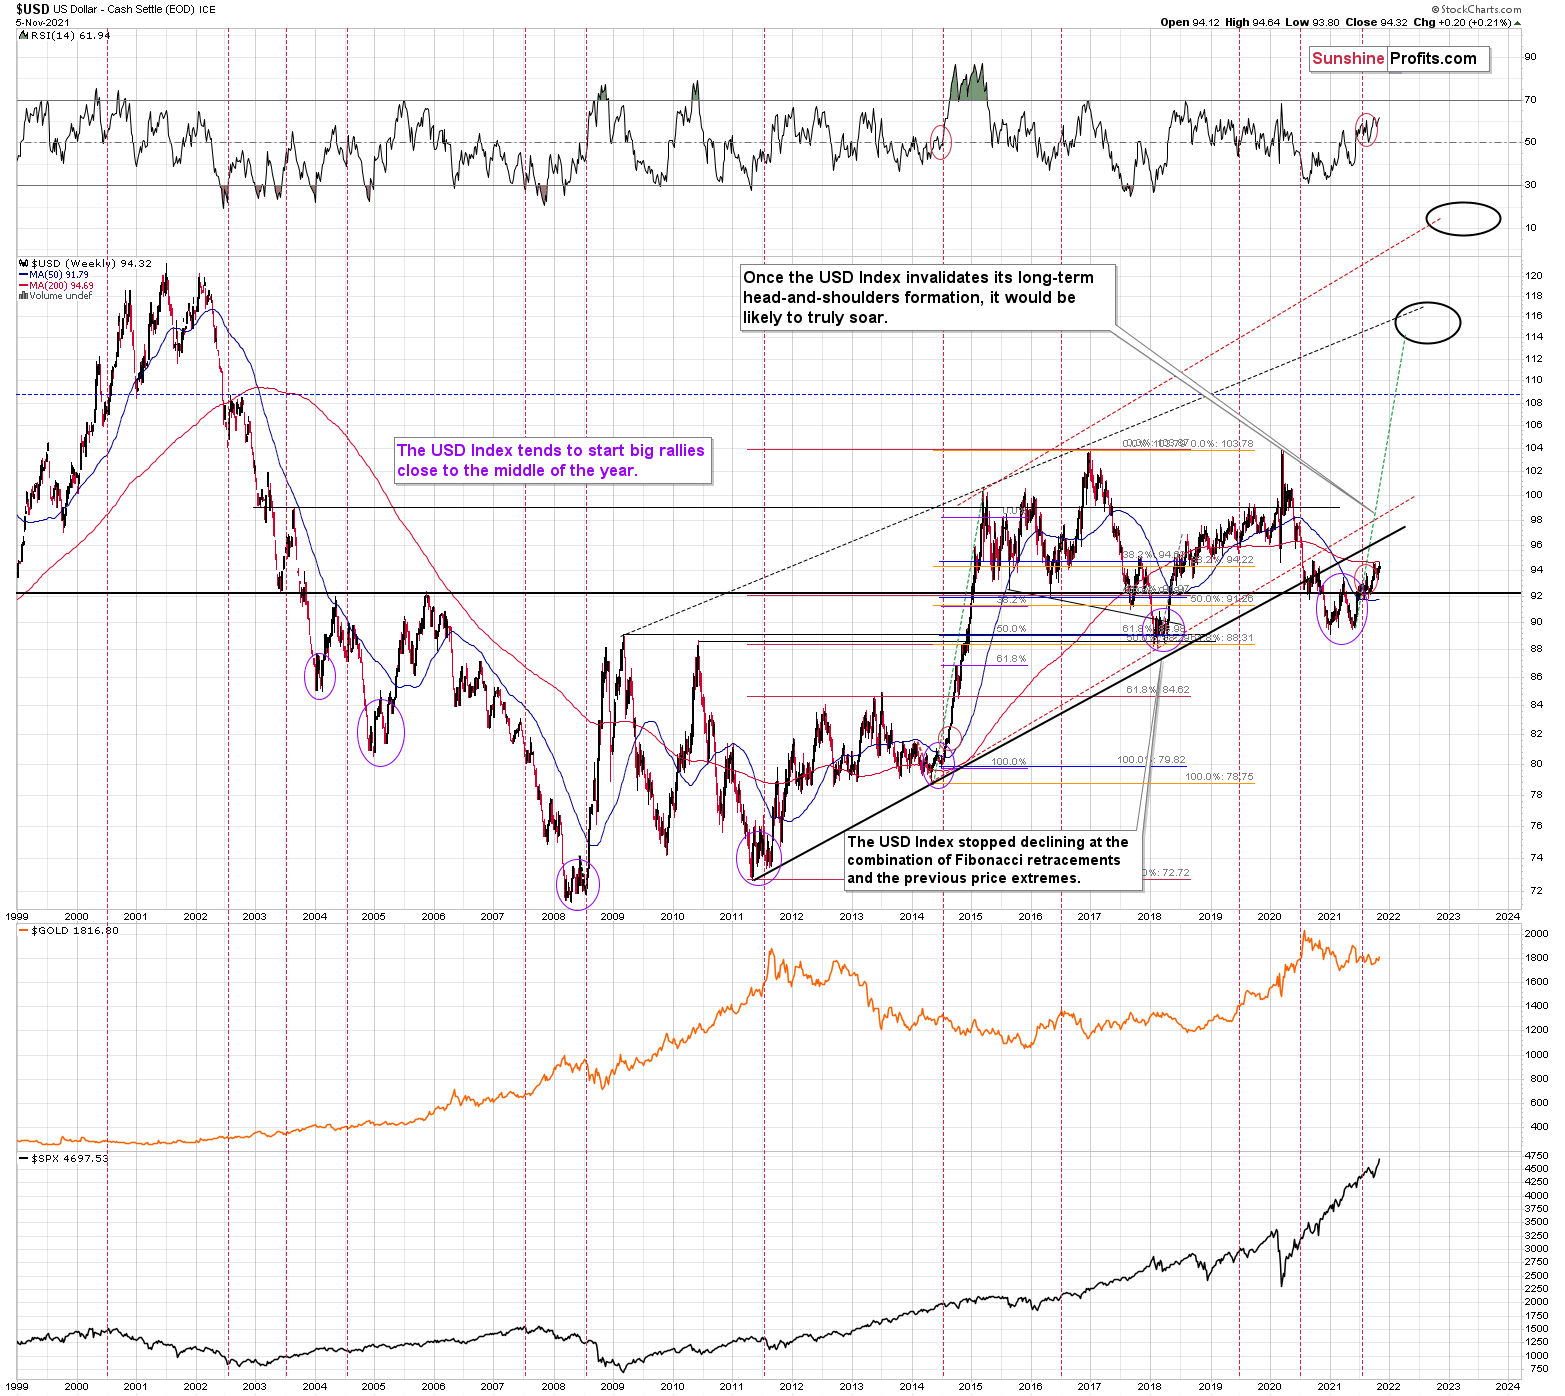
Adding to our confidence (don’t get me wrong, there are no certainties in any market; it’s just that the bullish narrative for the USDX is even more bullish in my view), the USD Index often sizzles in the summer sun and major USDX rallies often start during the middle of the year. Summertime spikes have been mainstays on the USD Index’s historical record and in 2004, 2005, 2008, 2011, 2014 and 2018 a retest of the lows (or close to them) occurred before the USD Index began its upward flights (which is exactly what’s happened this time around).
Furthermore, profound rallies (marked by the red vertical dashed lines below) followed in 2008, 2011 and 2014. With the current situation mirroring the latter, a small consolidation on the long-term chart is exactly what occurred before the USD Index surged in 2014. Likewise, the USD Index recently bottomed near its 50-week moving average; an identical development occurred in 2014. More importantly, though, with bottoms in the precious metals market often occurring when gold trades in unison with the USD Index (after ceasing to respond to the USD’s rallies with declines), we’re still far away from that milestone in terms of both price and duration.
Moreover, as the journey unfolds, the bullish signals from 2014 have resurfaced once again. For example, the USD Index’s RSI is hovering near a similar level (marked with red ellipses), and back then, a corrective downswing also occurred at the previous highs. More importantly, though, the short-term weakness was followed by a profound rally in 2014, and many technical and fundamental indicators signal that another reenactment could be forthcoming.
Please see below:
Just as the USD Index took a breather before its massive rally in 2014, it seems that we saw the same recently. This means that predicting higher gold prices (or the ones of silver) here is likely not a good idea.
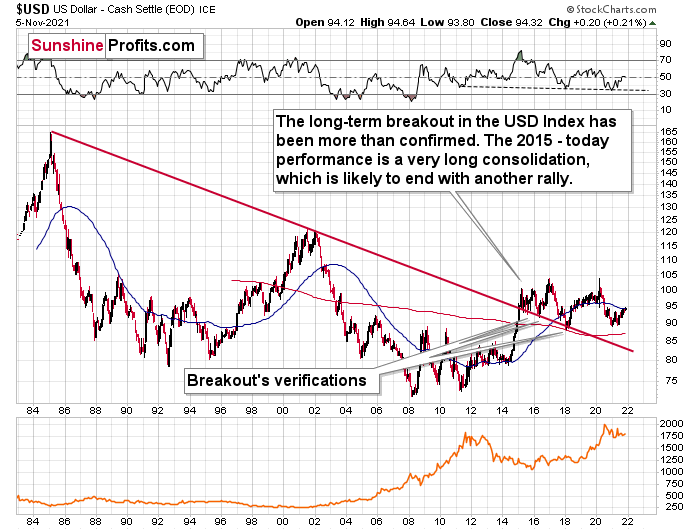
Continuing the theme, the eye in the sky doesn’t lie. And with the USDX’s long-term breakout clearly visible, the wind still remains at the dollar’s back.
Please see below:
The bottom line?
With my initial 2021 target of 94.5 already hit, the ~98 target is likely to be reached over the medium term, and the USDX will likely exceed 100 at some point over the medium or long term. Keep in mind though: we’re not bullish on the greenback because of the U.S.’ absolute outperformance. It’s because the region is fundamentally outperforming the Eurozone, the EUR/USD accounts for nearly 58% of the movement of the USD Index, and the relative performance is what really matters.
In conclusion, the USD Index remains in the driver’s seat and new highs should materialize over the medium term. And while gold, silver and mining stocks have rode the S&P 500 higher recently, history has been unkind when the precious metals ignore technical and fundamental realities. Moreover, with gold, silver, and mining stocks’ strong negative correlations with the U.S. dollar standing the test of time, it’s likely only a matter of time before investors realize this as well.
Thank you for reading our free analysis today. Please note that the above is just a small fraction of the full analyses that our subscribers enjoy on a regular basis. They include multiple premium details such as the interim target for gold that could be reached in the next few weeks. We invite you to subscribe now and read today’s issue right away.
Sincerely,
Przemyslaw Radomski, CFA
Founder, Editor-in-chief -
Early (Gold Video) Heads-up before the Next Week
November 6, 2021, 10:35 AMBased on Friday’s (and last week’s in general) rally, it seems that the outlook for gold might be bullish. But is it? I recorded a video, where I’m talking about two reversal in gold as well as about the recent performance of mining stocks.
-
Gold Investment Update: What Does November Hold for the Miners?
November 1, 2021, 1:58 PMAs a new month begins, the downtrend in the GDX and GDXJ should resume. When will a new buying opportunity finally present itself?
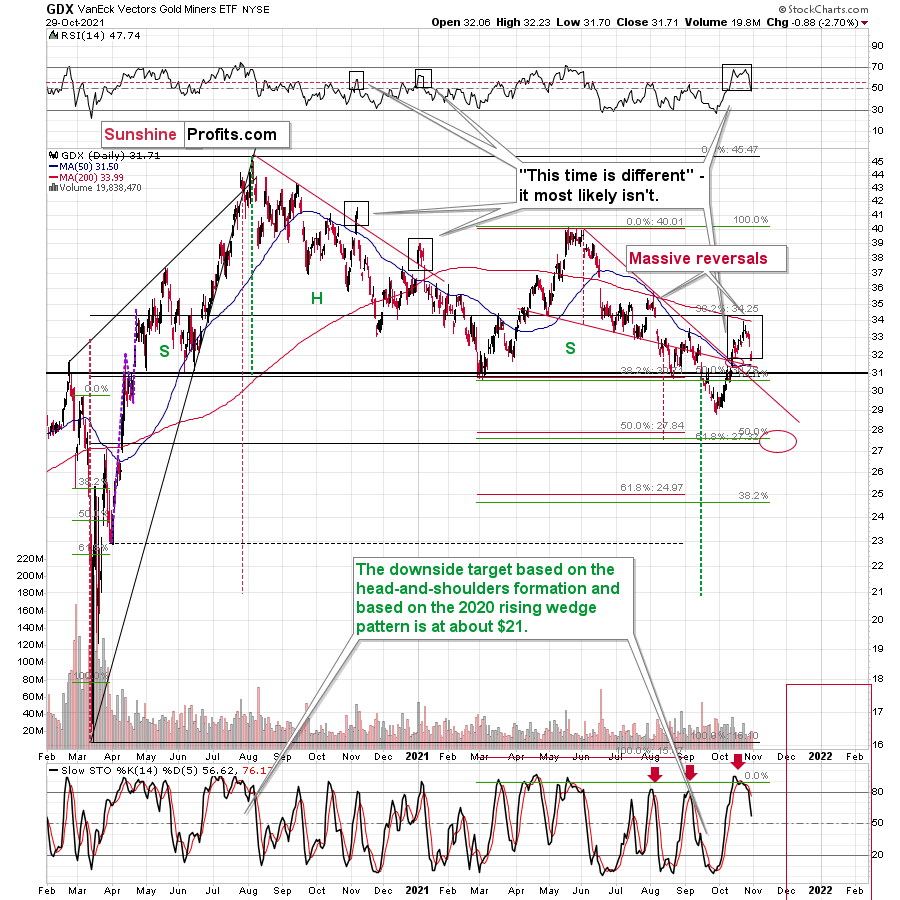
Let’s compare the behavior of the GDX ETF and the GDXJ ETF. Regarding the former, the GDX ETF reversed sharply after reaching its 200-day moving average and a confluence of bearish indicators signaled a similar outcome. For context, I wrote on Oct. 25:
Small breakout mirrors what we witnessed during the senior miners’ downtrend in late 2020/early 2021. Moreover, when the GDX ETF’s RSI (Relative Strength Index) approached 70 (overbought conditions) back then, the highs were in (or near) and sharp reversals followed.
Furthermore, after a sharp intraday reversal materialized on Oct. 22, the about-face is similar to the major reversal that we witnessed in early August. On top of that, with the GDX ETF’s stochastic indicator also screaming overbought conditions, the senior miners are likely to move lower sooner rather than later.
Also, please note that the GDX ETF reversed right after moving close to its 200-day moving average, which is exactly what stopped it in early August. Yes – that’s another link between now and early August.
And after declining sharply on Oct. 28 and Oct. 29, the senior miners further cemented their underperformance of gold. Moreover, with relative underperformance often a precursor to much larger declines, the outlook for the GDX ETF remains quite bearish.
Please see below:
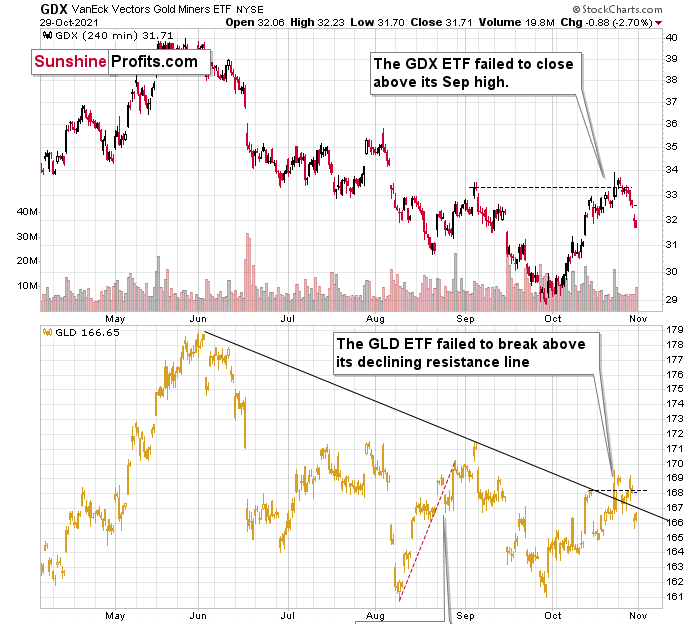
As further evidence, the GDX ETF’s four-hour chart offers some important insights. To explain, the senior miners failed to hold their early September highs and last week’s plunge removed any and all doubt. Likewise, the GLD ETF suffered a sharp drawdown and its recent breakout was also invalidated.
Furthermore, my three-day rule for confirming breakouts/breakdowns proved prescient once again. Conversely, investors that piled into mining stocks are likely regretting their decision to act on unconfirmed signals. And as we look ahead, the technicals imply that caution is warranted and more downside is likely for the GDX ETF.
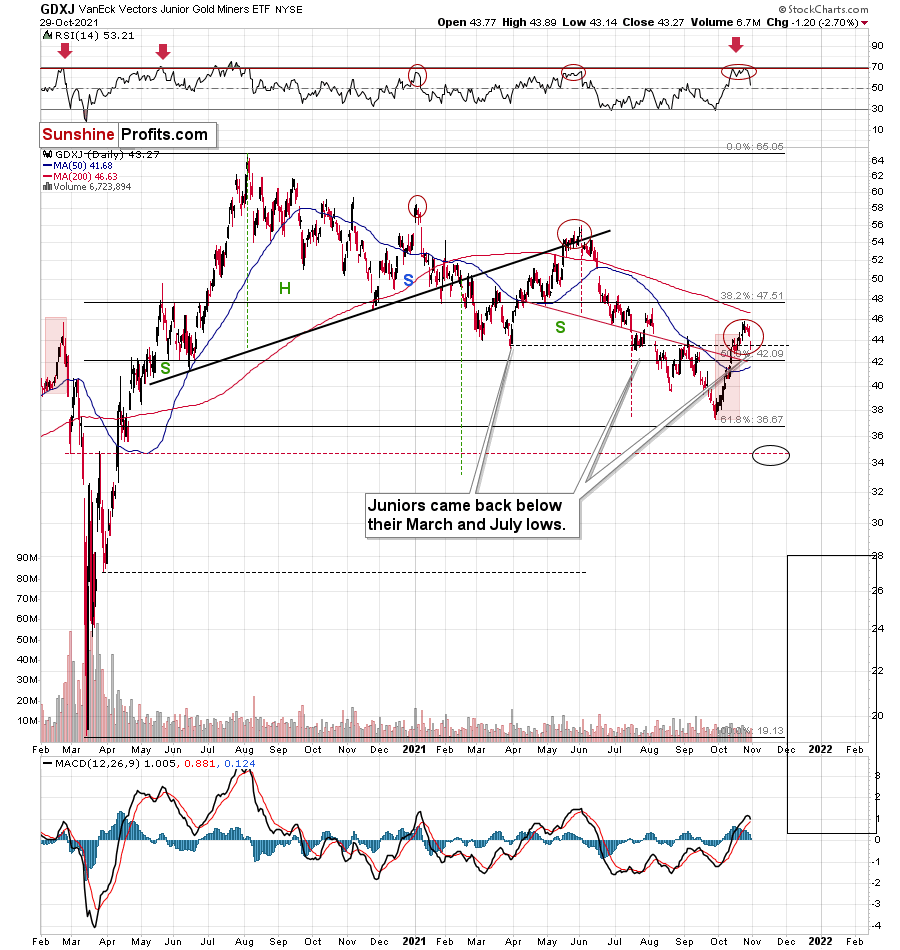
As for the GDXJ ETF, the gold junior miners suffered a similar swoon last week. For context, I warned of the prospective reversal on Oct. 25. I wrote:
The junior miners’ RSI also signals overbought conditions and history has been unkind when similar developments have occurred. Moreover, the GDXJ ETF’s recent rally follows the bearish patterns that we witnessed in late May and in early 2021. Likewise, the intraday reversal on Oct. 22 mirrors the bearish reversal from early August and a confluence of indicators support a continuation of the downtrend over the coming weeks.
And as we begin a new month, the GDXJ ETF’s downtrend should resume and a retracement to the ~35 level will likely materialize in the coming months.
Please see below:
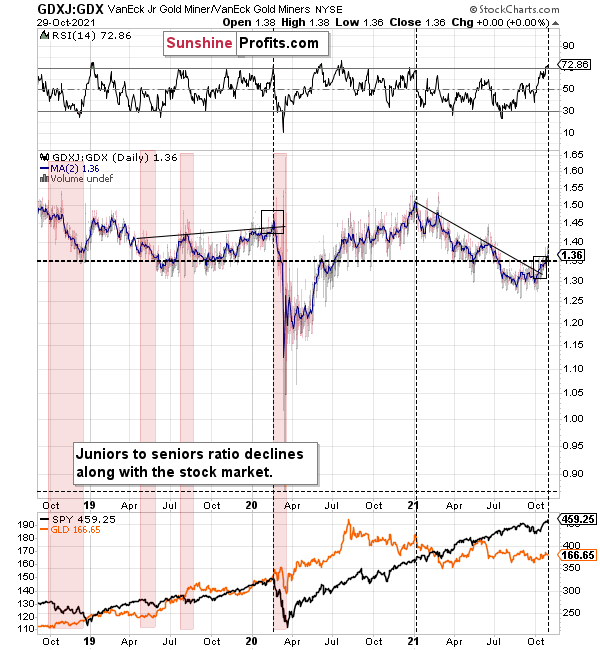
Finally, while I’ve been warning for months that the GDXJ/GDX ratio was destined for devaluation, the ratio has fallen precipitously in 2021. And after the recent short-term rally, the ratio’s RSI has reached extremely elevated levels (nearly 73) and similar periods of euphoria have preceded major drawdowns (marked with the black vertical dashed lines below).
To that point, the ratio showcased a similar overbought reading in early 2020 – right before the S&P 500 plunged. On top of that, the ratio is still below its mid-to-late 2020 lows and its mid-2021 lows. As a result, the GDXJ ETF will likely underperform the GDX ETF over the next few months. It’s likely to underperform silver in the near term as well.
The bottom line?
If the ratio is likely to continue its decline, then on a short-term basis we can expect it to trade at 1.27 or so. If the general stock market plunges, the ratio could move much lower, but let’s assume that stocks decline moderately or that they do nothing or rally slightly. They’ve done all the above recently, so it’s natural to expect that this will be the case. Consequently, the trend in the GDXJ to GDX ratio would also be likely to continue, and thus expecting a move to about 1.26 - 1.27 seems rational.
If the GDX is about to decline to approximately $28 before correcting, then we might expect the GDXJ to decline to about $28 x 1.27 = $35.56 or $28 x 1.26 = $35.28. In other words, ~$28 in the GDX is likely to correspond to about $35 in the GDXJ.
Is there any technical support around $35 that would be likely to stop the decline? Yes. It’s provided by the late-Feb. 2020 low ($34.70) and the late-March high ($34.84). There’s also the late-April low at $35.63.
Consequently, it seems that expecting the GDXJ to decline to about $35 is justified from the technical point of view as well.
In conclusion, mining stocks reprised their role as ‘The Boy Who Cried Wolf.’ And after overzealous investors rushed to their defense last week, another false alarm led to another bout of disappointment. Moreover, with the technical and fundamental backdrops for gold, silver and mining stocks continuing to deteriorate, lower lows should materialize over the medium term. As a result, we may have to wait until 2022 before reliable buying opportunities emerge once again.
Thank you for reading our free analysis today. Please note that the above is just a small fraction of the full analyses that our subscribers enjoy on a regular basis. They include multiple premium details such as the interim target for gold that could be reached in the next few weeks. We invite you to subscribe now and read today’s issue right away.
Sincerely,
Przemyslaw Radomski, CFA
Founder, Editor-in-chief


Gold Alerts
More-
Status
New 2024 Lows in Miners, New Highs in The USD Index
January 17, 2024, 12:19 PM -
Status
Soaring USD is SO Unsurprising – And SO Full of Implications
January 16, 2024, 8:40 AM -
Status
Rare Opportunity in Rare Earth Minerals?
January 15, 2024, 2:06 PM
Dear Sunshine Profits,


