

Briefly: in our opinion, full (250% of the regular size of the position) speculative short position in gold, silver, and mining stocks are justified from the risk/reward point of view at the moment of publishing this Alert.
Yesterday's and today's pre-market price action in the precious metals sector has confirmed what we wrote in yesterday's Gold & Silver Trading Alert. The proximity of the triangle vertex reversal in the USD Index seems to be playing the key part in it. To say that the USD Index remains in an uptrend is like saying that Trump does not express love to Powell. It's true, but it doesn't convey the entire picture either. There are massive forces behind the USD's upswing and it's likely to continue for many months. But, on a short-term basis, the USD Index might fall simply because it's likely to form a bottom in the following days. And price has to decline for the bottom to form. In yesterday's Alert, we explained that there might be a very short-term upswing in gold and silver (and we took advantage of it in yesterday's Day Trading Signal), but that it's not likely to be particularly significant and that it's unlikely to last long. This remains 100% up to date also today.
Gold and Silver in Focus
In yesterday's analysis, we described the situation in gold and silver in the following way:
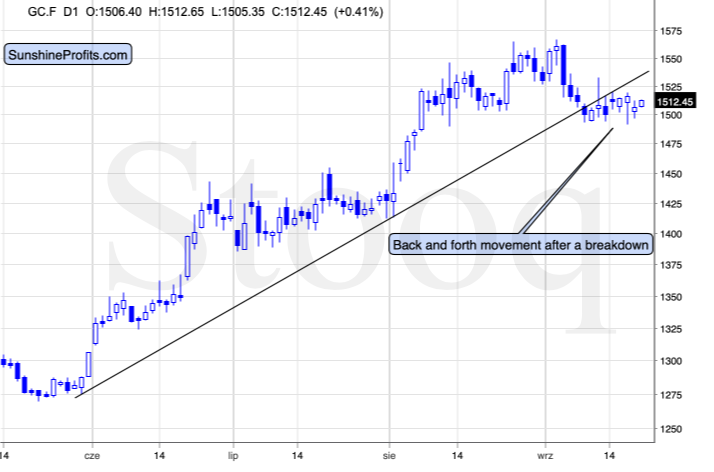
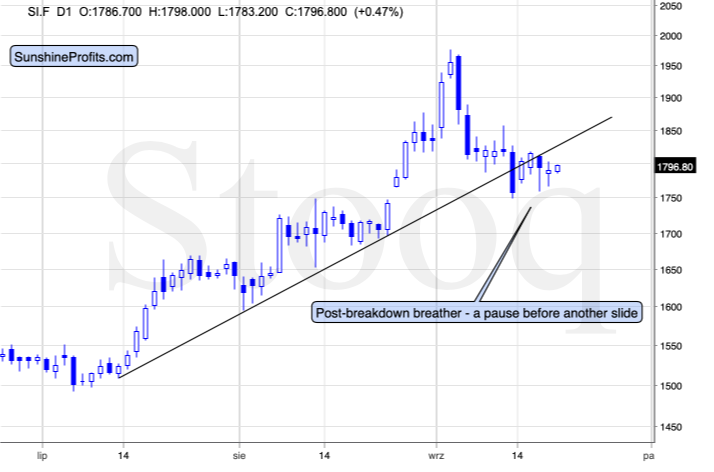
Gold and silver have both declined after their breakdowns below the rising support lines, which is the final proof that the breakdown has already been confirmed. Not even [48] hours since the rate cut have passed, so we can't say that the dust has settled yet. Once it does - perhaps later today, tomorrow, or early next week - the decline in the precious metals sector is very likely to continue. There are many more reasons for it than just the above breakdowns. The latter just serve as a short-term confirmation of the really important factors that we discussed in the previous Alerts. Before the summary of today's analysis, we will quote the links to the analyses with these major factors, so that you can review them if you couldn't do so previously.
At the moment of writing these words, both metals are trading close to their yesterday's highs and at the same time relatively far from the previously broken rising support lines. The entire action is still a post-breakdown pause, which means that the metals are preparing for yet another slide lower, but are not yet in it.
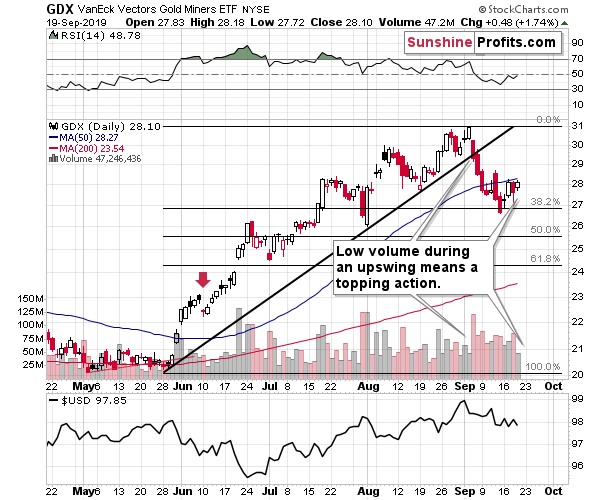
In yesterday's Alert we also commented on the situation in the mining stocks, and these comments also remain up to date. Yesterday, we used the HUI Index as a proxy for the mining stocks sector, and today we'll use the GDX ETF. The latter is useful as it allows us to also analyze the volume. The points made about HUI apply to GDX as well, though:
Ok, but what about miners' upswing? Doesn't their strength indicate a rally is just around the corner?
Not really. Let's keep in mind the following:
- The gold miners were first to break below their rising support line and they continued to underperform for days.
- Miners moved to the 38.2% Fibonacci retracement level based on the most recent upswing, which means that some kind of very short-term rebound was relatively likely
- It's just one day of strong performance relative to gold and one swallow doesn't make a summer. [it's been more than one day, but the size of the upswing is still negligible, so it doesn't imply anything important]
Yesterday's upswing falls into the "normal" category of the things that we might expect a market to do after decline that's already quite sizable. (...)
If miners continue to show strength while gold and silver invalidate their breakdowns, it might mean that we'll see another short-term upswing before the decline resumes. At this time though, the odds continue to favor decline's continuation without a meaningful move higher beforehand.
The volume analysis confirms our interpretation of this week's move higher. The low-volume upswings mean that there were few buyers and few sellers, but overall the former were stronger. Rallies on high volume might indicate that the buyers won a fierce battle, just like it happened in early August. But nothing like that was the case yesterday. There was no fierce battle, just people reluctant to take decisive action. That's exactly what one would expect to see during a pause or consolidation within a trend. The previous move was down, so when the trend resumes, gold, silver, and mining stocks are likely to slide once again.
USDX and the Bullish Rate Cut
Meanwhile, the situation in the USD Index is also developing in tune with what we wrote about the current situation in general. The intraday volatility is definitely visible, but it doesn't appear to change anything. What we wrote yesterday and on Tuesday remains up-to-date (the long-term details are most important, though and if you haven't read Tuesday's analysis yet, we strongly encourage you to do so today):
It was yet another higher low. The ultimate low this year formed in early January. Then, we saw a higher low in late January. Then a higher low in March, then a higher low in June, then a higher low in mid-July, then two higher lows in August and finally the higher low that we saw this week. Higher lows mean uptrend. Trendlines are useful to detect the turnarounds and Fibonacci retracements tell us if the move in the opposite direction is significant enough to be viewed as a trend change. However, the underlying rule is simple. If the price is on average moving up, then the market is an uptrend. Looking at the relative placement of lows and highs tells us the same thing. By the way, the highs in the USD Index have also been increasing this year.
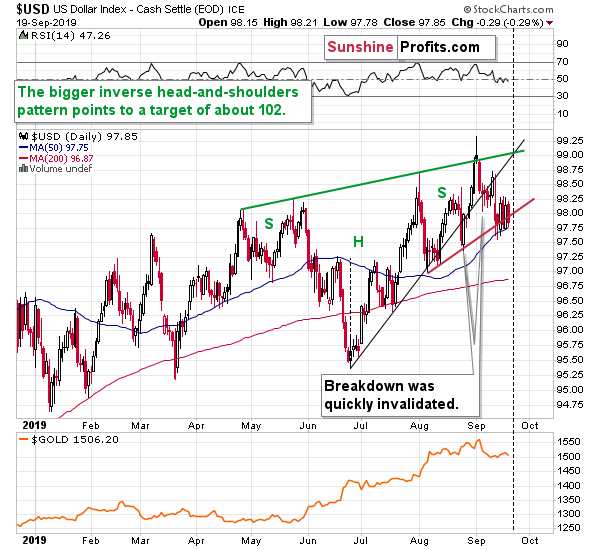
While the rising black support line was already broken, it didn't cause the USDX to decline below the previous local low. It didn't decline below the red line that's based on the August lows either. And that's despite Trump calling for zero percent rate policy or even negative interest rate policy.
In the previous Alerts we wrote that the market will be viewing the U.S. President's tweets and comments as less and less important, given how often Trump changes his mind (remember how quickly North Korean "fire and fury" threats turned into a handshake?). The higher USDX lows confirm that. It didn't matter that Trump demanded radically lower interest rates. The currency traders didn't care much.
What did all the above result in? We have the USD Index above 98, close to the yearly highs. It mostly doesn't react to bearish news and it comes back stronger after each of such news is presented.
The outlook for the USD Index remains bullish.
There's one more detail about the USD Index chart that we would like to discuss. It's the vertex of the triangle that's based on the rising green resistance line and the rising black resistance line. The vertex is on Monday. That's notable, because each line is based on three price extremes, which means that they both already proved to be important support / resistance lines. The vertexes of triangles tend to mark reversal dates, which means that the USD Index is likely to reverse its course on Monday or around it (perhaps even today).
Now, if the general trend is up, then the above is likely to mean a bottom in the USDX and then a rally. However, in order for the bottom to form, the price would have to come down. This means that the U.S. dollar could temporarily decline here, even despite all the bullish indications that we have right now.
This in turn means that gold, silver, and mining stocks could still move a bit higher before plunging. The emphasis goes on "could" and "a bit". In the last few weeks, gold and silver managed to decline on their own - so even if the USD declines, it's not a sure thing that the PMs will rally. And even if they do, they are unlikely to rally far. Still, it seems useful to know that such a possibility exists - so that a temporary upswing doesn't make one question all the bearish factors that remain in place. Speaking of the bearish factors, here they are. The links below include the analyses with discussions of these main points.
The USD Index is moving lower today, but not significantly so. This is in perfect tune with the above.
Key Factors to Keep in Mind
Critical factors:
- The USD Index broke above the very long-term resistance line and verified the breakout above it. Its huge upswing is already underway.
- The USD's long-term upswing is an extremely important and bearish factor for gold. There were only two similar cases in the past few decades, when USD Index was starting profound, long-term bull markets, and they were both accompanied by huge declines in gold and the rest of the precious metals market
- Out of these two similar cases, only one is very similar - the case when gold topped in February 1996. The similarity extends beyond gold's about a yearly delay in reaction to the USD's rally. Also the shape of gold price moves prior to the 1996 high and what we saw in the last couple of years is very similar, which confirm the analysis of the gold-USD link and the above-mentioned implications of USD Index's long-term breakout.
- The similarity between now and 1996 extends to silver and mining stocks - in other words, it goes beyond USD, gold-USD link, and gold itself. The white metal and its miners appear to be in a similar position as well, and the implications are particularly bearish for the miners. After their 1996 top, they erased more than 2/3rds of their prices.
- Many investors got excited by the gold-is-soaring theme in the last few months, but looking beyond the short-term moves, reveals that most of the precious metals sector didn't show substantial strength that would be really visible from the long-term perspective. Gold doesn't appear to be starting a new bull market here, but rather to be an exception from the rule.
- Gold's True Seasonality around the US Labor Day points to a big decline shortly.
Very important, but not as critical factors:
- Long-term technical signs for silver, i.a. the analogy in terms of price to what we saw in 2008, shows that silver could slide even below $10.
- Silver's very long-term cycles point to a major reversal taking place right now and since the most recent move was up, the implications are bearish (this is also silver's technical sign, but it's so important that it deserves its own point)
- Long-term technical signs for gold stocks point to this not being a new gold bull market beginning. Among others, it's their long-term underperformance relative to gold that hint this is rather a corrective upswing within a bear market that is not over yet.
- Record-breaking weekly volume in gold is a strong sign pointing to lower gold prices
Important factors:
- Extreme volume reading in the SIL ETF (proxy for silver stocks) is an effective indication that lower values of silver miners are to be expected
- Silver's short-term outperformance of gold, and gold stocks' short-term underperformance of gold both confirm that the precious metals sector is topping here
- Gold topped almost right at its cyclical turning point, which makes the trend reversal more likely
- Copper broke below its head-and-shoulders pattern and confirmed the breakdown. The last time we saw something similar was in April 2013, when the entire precious metals sector was on the verge of plunging lower.
Moreover, please note that while there may be a recession threat, it doesn't mean that gold has to rally immediately. Both: recession and gold's multi-year rally could be many months away - comparing what happened to bond yields in the 90s confirms that.
Copper moved above the neck level of its head-and-shoulders pattern that's based on the intraday lows, but it didn't invalidate the analogous level based on the weekly closing prices, so we don't think it's justified to say that this bearish formation was invalidated at this time.
Summary
Summing up, the big decline in the precious metals sector appears to be finally underway, however, a temporary move lower in the USD Index could trigger a very quick upswing in the PMs and miners. The turnaround is likely to take place either today or in the first half of the following week, so the odds are that we won't have to wait long for yet another slide in gold, silver, and mining stocks. Moreover, once the USDX takes off, it will likely serve as fuel to the fire-like decline that's already underway. The similarity to mid-90s continues to support much lower gold prices in the following months. All in all, it seems that what we see right now is the beginning of the final stage of the prolonged decline in the precious metals sector that started in 2011. On a short-term basis, it seems that we might get some temporary strength once gold moves to about $1,330 - perhaps within the next several weeks.
As always, we'll keep you - our subscribers - informed.
To summarize:
Trading capital (supplementary part of the portfolio; our opinion): Full speculative short position (250% of the full position) in gold, silver, and mining stocks is justified from the risk/reward perspective with the following stop-loss orders and exit profit-take price levels:
- Gold: profit-take exit price: $1,332; stop-loss: $1,583; initial target price for the DGLD ETN: $39.87; stop-loss for the DGLD ETN: $25.17
- Silver: profit-take exit price: $14,62; stop-loss: $20,16; initial target price for the DSLV ETN: $32.96; stop-loss for the DSLV ETN: $11.67
- Mining stocks (price levels for the GDX ETF): profit-take exit price: $22.62; stop-loss: $32.37; initial target price for the DUST ETF: $17.28; stop-loss for the DUST ETF $5.48
In case one wants to bet on junior mining stocks' prices (we do not suggest doing so - we think senior mining stocks are more predictable in the case of short-term trades - if one wants to do it anyway, we provide the details), here are the stop-loss details and target prices:
- GDXJ ETF: profit-take exit price: $30.32; stop-loss: $45.42
- JDST ETF: profit-take exit price: $38.36 stop-loss: $11.26
Long-term capital (core part of the portfolio; our opinion): No positions (in other words: cash)
Insurance capital (core part of the portfolio; our opinion): Full position
Whether you already subscribed or not, we encourage you to find out how to make the most of our alerts and read our replies to the most common alert-and-gold-trading-related-questions.
Please note that the in the trading section we describe the situation for the day that the alert is posted. In other words, it we are writing about a speculative position, it means that it is up-to-date on the day it was posted. We are also featuring the initial target prices, so that you can decide whether keeping a position on a given day is something that is in tune with your approach (some moves are too small for medium-term traders and some might appear too big for day-traders).
Plus, you might want to read why our stop-loss orders are usually relatively far from the current price.
Please note that a full position doesn't mean using all of the capital for a given trade. You will find details on our thoughts on gold portfolio structuring in the Key Insights section on our website.
As a reminder - "initial target price" means exactly that - an "initial" one, it's not a price level at which we suggest closing positions. If this becomes the case (like it did in the previous trade) we will refer to these levels as levels of exit orders (exactly as we've done previously). Stop-loss levels, however, are naturally not "initial", but something that, in our opinion, might be entered as an order.
Since it is impossible to synchronize target prices and stop-loss levels for all the ETFs and ETNs with the main markets that we provide these levels for (gold, silver and mining stocks - the GDX ETF), the stop-loss levels and target prices for other ETNs and ETF (among other: UGLD, DGLD, USLV, DSLV, NUGT, DUST, JNUG, JDST) are provided as supplementary, and not as "final". This means that if a stop-loss or a target level is reached for any of the "additional instruments" (DGLD for instance), but not for the "main instrument" (gold in this case), we will view positions in both gold and DGLD as still open and the stop-loss for DGLD would have to be moved lower. On the other hand, if gold moves to a stop-loss level but DGLD doesn't, then we will view both positions (in gold and DGLD) as closed. In other words, since it's not possible to be 100% certain that each related instrument moves to a given level when the underlying instrument does, we can't provide levels that would be binding. The levels that we do provide are our best estimate of the levels that will correspond to the levels in the underlying assets, but it will be the underlying assets that one will need to focus on regarding the signs pointing to closing a given position or keeping it open. We might adjust the levels in the "additional instruments" without adjusting the levels in the "main instruments", which will simply mean that we have improved our estimation of these levels, not that we changed our outlook on the markets. We are already working on a tool that would update these levels on a daily basis for the most popular ETFs, ETNs and individual mining stocks.
Our preferred ways to invest in and to trade gold along with the reasoning can be found in the how to buy gold section. Additionally, our preferred ETFs and ETNs can be found in our Gold & Silver ETF Ranking.
As a reminder, Gold & Silver Trading Alerts are posted before or on each trading day (we usually post them before the opening bell, but we don't promise doing that each day). If there's anything urgent, we will send you an additional small alert before posting the main one.
=====
Latest Free Trading Alerts:
The amount of global debt with negative yields soared to $16 trillion, or more than 25 percent of the market. Isn't this economic madness? We invite you to read our today's article about the negative interest rates and find out what they imply for the gold market.
Gold among Negative-Yielding Bonds
=====
Thank you.
Sincerely,
Przemyslaw Radomski, CFA
Editor-in-chief, Gold & Silver Fund Manager

