

Briefly: in our opinion, full (250% of the regular size of the position) speculative short position in gold, silver, and mining stocks are justified from the risk/reward point of view at the moment of publishing this Alert. We are moving the profit-take levels and the stop-loss levels closer to the current gold, silver, and mining stock values.
This September is something both gold bulls and bears will remember - the yellow metal went down over $50 in the last 30 days. Gold topped almost exactly 8 years after the 2011 top, and it took as much time to get from the January 1980 top to the December 1987 one. Based on the soaring USD Index and the similarity to mid-90s, gold is also likely after a major multi-month top. But what prices are likely to trigger rebounds? That's what we're going to discuss in today's analysis.
Yes, gold declined over $50 in September and the 2019 rally appears to be over. And the slide is picking up speed. However, just because gold is likely to decline profoundly, it doesn't mean that it will decline in a straight line. There will be periodic corrections with opportunities to limit or close one's short positions and perhaps to open long ones. There will also be times to add to the short position if one doesn't have it in place already. Where are we likely to see rebounds and what can we do about it?
Short-Term Developments in PMs
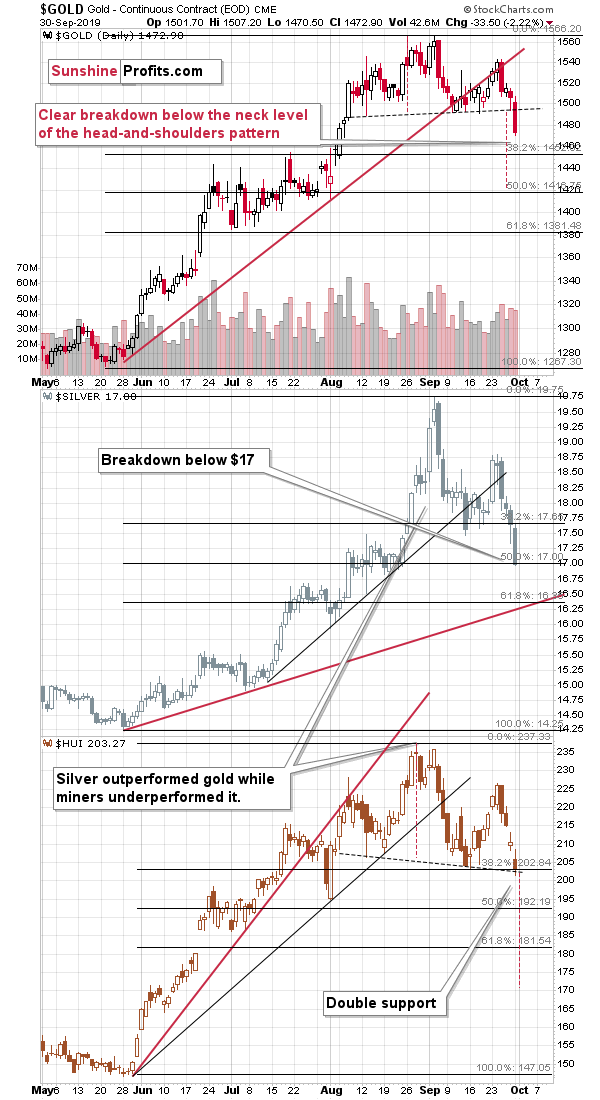
The most important thing that happened on the gold market is the breakdown below the $1,500 level and below the neck level of the head-and-shoulders pattern. Earlier, both levels prevented gold from declining further and now this is no longer the case. Gold can slide.
The head and shoulders pattern suggests a move to at least $1,425 as that's the size of the head of the pattern. There are other factors that need to be considered as well. The Fibonacci retracements provide useful targets as well. The first one is relatively close, at about $1,450, the second is at about $1,416, which is relatively close to the above-mentioned $1425 level, and the third is at about $1,381.
The previous highs and lows also play a part. There are quite a few such extremes that formed in June and July, but they are more or less in tune with the Fibonacci retracements, so they don't add much to the above.
Taking both: the head-and-shoulders and the Fibonacci retracements into account, it seems that gold is more likely to bounce from about $1,420 than from other price levels. The $1,381 level might be the something that generates a rebound as well but it's not as likely as the $1,420 level. At least not based on the above chart.
As far as silver is concerned, the short-term outlook is simpler. We just saw a move right to the 50% Fibonacci retracement and now silver is likely to decline to at least the 61.8% retracement. This retracement approximately coincides with the rising red support line based on the previous lows and it's at $16.36. This level, or its proximity, could generate a temporary (!) rebound.
The mining stocks reached the neck level of their head-and-shoulders formation as well as the 38.2% Fibonacci retracement level. Are miners showing strength by not breaking below the neck level, even though gold did? No - please note that they are already at their 38.2% retracement, while gold didn't move to it yet.
As far as their next target is concerned, it's important to note that the downside target based on the (so far incomplete) head and shoulders pattern is even below the lowest of the classic retracements. The H&S indicates a decline to 170 or so. The early August low provides support as well and it's at about 195. It could be the case that the breakdown below the neck level of the H&S pattern takes the HUI Index to the 195 level, then back to the neck level at about 203 and then the decline would resume. The next "big" target is at about 180 because the support provided by the 61.8% Fibonacci retracement is strengthened by the June price gap.
All in all, the next short-term (!) downside target for mining stocks is quite unclear and if one wants to trade the rebound, it might be best to focus on other factors instead of price alone. It might actually be best not to trade the bounce at all, due to how many long-term factors point to lower precious metals prices in the following months.
Let's get back to gold and zoom out.
Focus on Gold
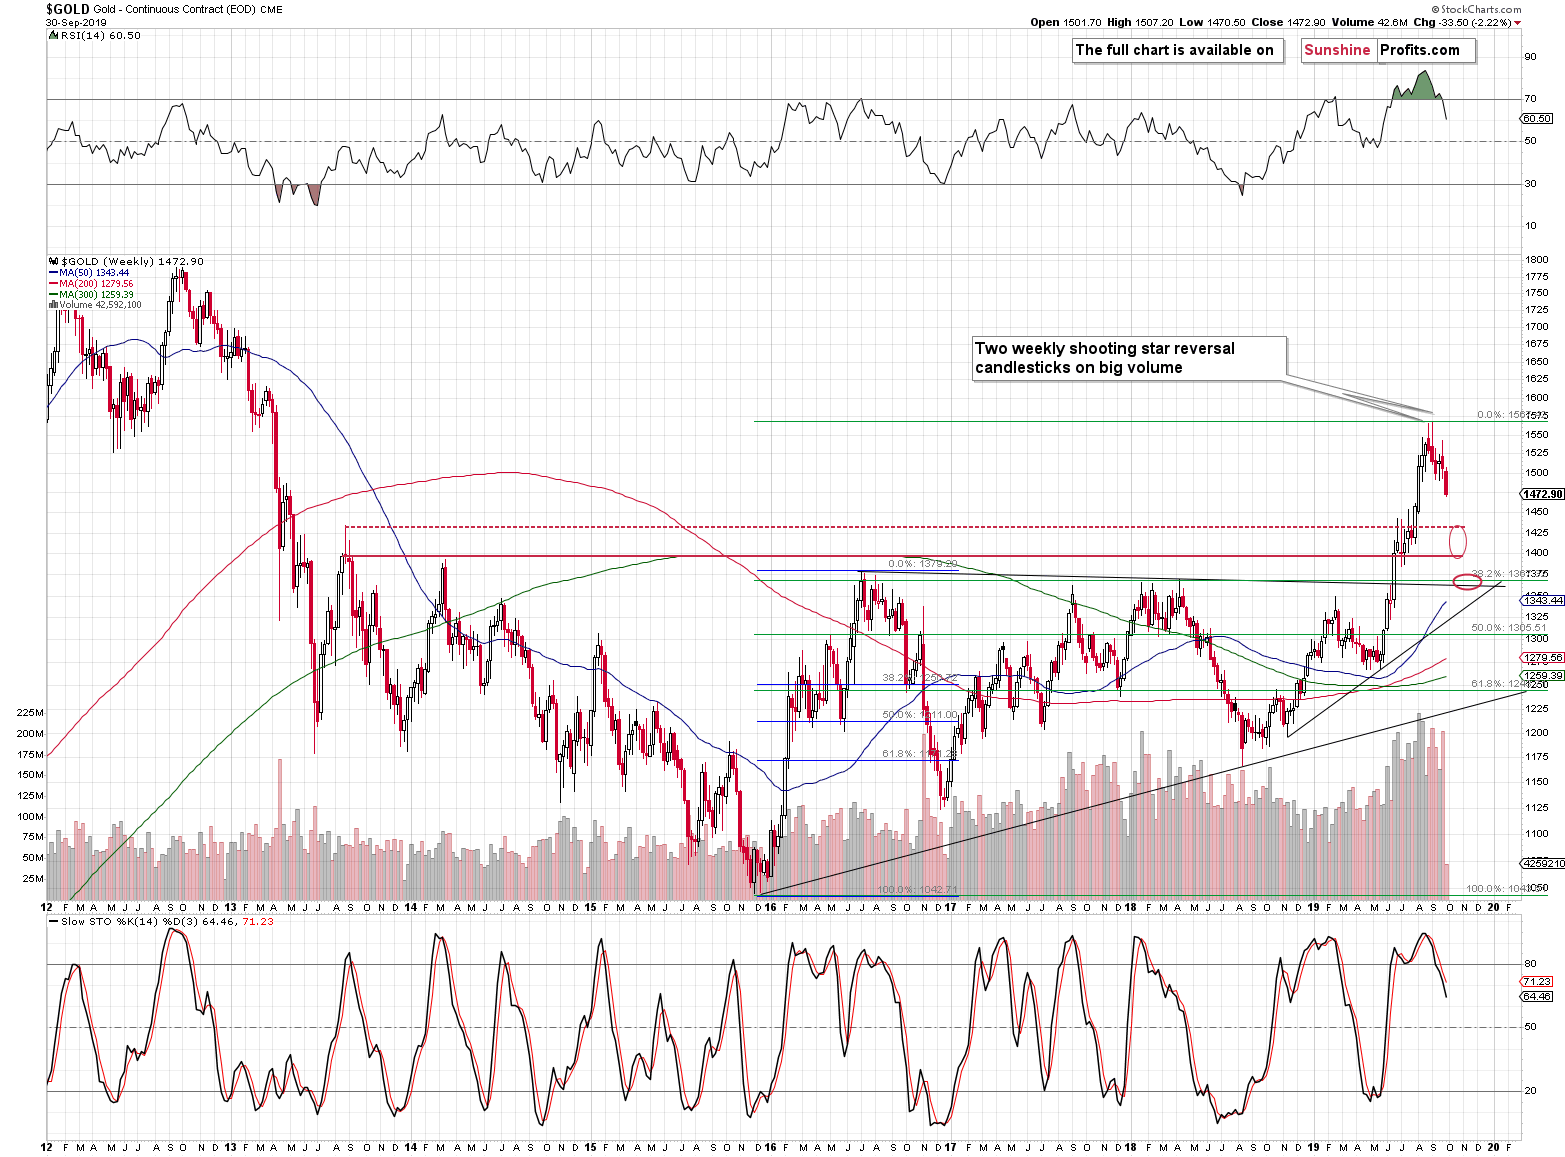
There are two relatively nearby downside targets that could generate rebounds. The rebound should not be huge, but it can still be noticeable - please take a look at the early part of the 2012-2013 decline. There were some upswings, but if one chose to ignore them and just kept their short positions intact, we doubt that they would regret it after a few months.
The upper target area is based on the mid-2013 high. It's not as important as the lower one, but it's worth being mentioned as it confirms the target based on the short-term gold analysis - the one at around the $1,420 level.
The second target area is more important as it's based on three strong support levels. The first one is the 38.2% Fibonacci retracement level based on the entire 2015 - 2019 upswing. The 2016 upswing alone provides us with guidance - back then, gold declined sharply until reaching the 38.2% Fibonacci retracement (marked with blue). Then it corrected and only after the correction, did the decline resume. Now, in this case gold is not likely to correct as much as we don't have the U.S. Presidential Elections looming (which was the case in 2016), and gold has already proved to be able to decline while the trade tensions remain high and while the market is bombarded by Trump's calls for significantly lower interest rates and lower USD values.
The second factor that comes into play here, is the declining support line that's based on the 2016 and 2018 tops.
The third factor are the above-mentioned tops themselves.
Combining all three provides us with a relatively good chance of seeing a bounce from about $1,360 - $1,380. Let's come back to the previous short-term chart for a while. The final short-term 61.8% Fibonacci retracement level is at about $1,381. This further strengthens the above-mentioned target area.
Silver and Miners in the Limelight
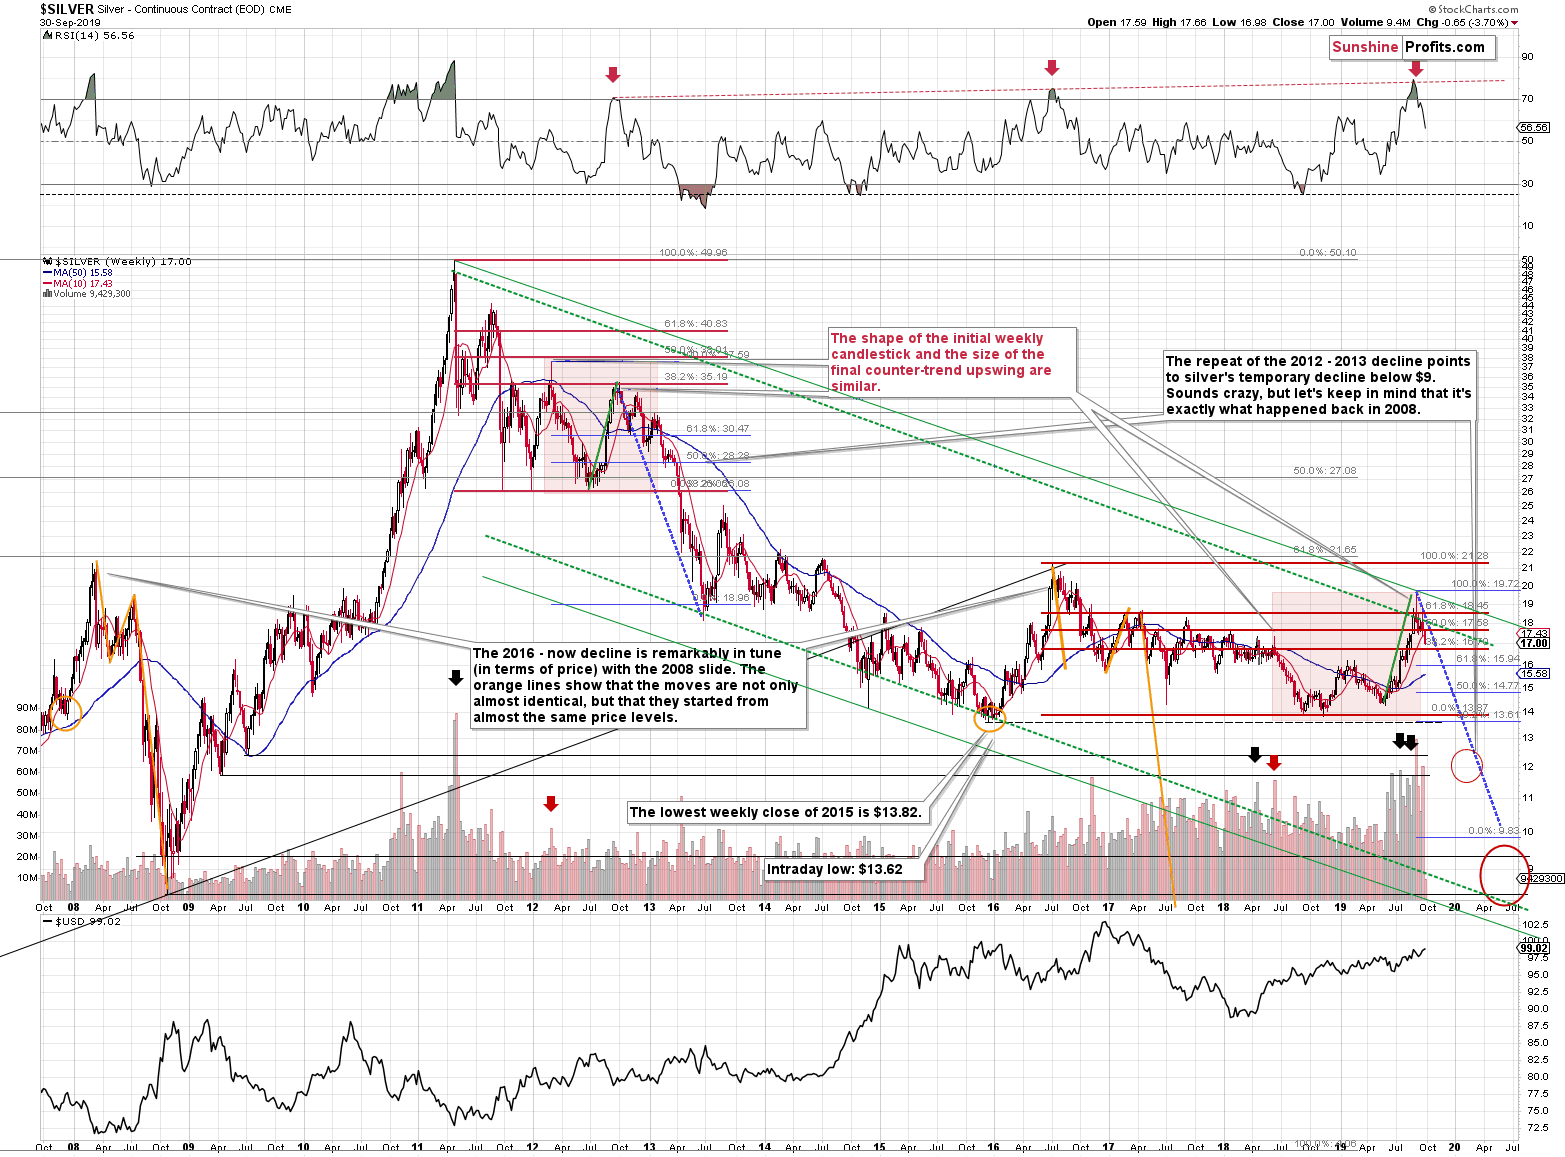
Silver's very long-term picture shows additional support from the early 2019 high. It's at $16.20, which is very close to the $16.30 that we mentioned previously. Consequently, this area is likely to provide relatively strong support and we might indeed see a corrective bounce from it.
Unfortunately, the long-term HUI Index chart doesn't provide us with additional insights regarding the nearby support levels.
So, what should one do with all this information?
That depends on one's approach. In our view, the biggest opportunity lies in taking advantage of the multi-month decline in the PMs, so it seems more important to make sure that we don't miss this move than it is to catch each and every rebound along the way.
But, for the more short-term oriented traders, both above-mentioned target areas in gold as well as the nearby target for silver, can prove to be valuable indications to help them take advantage of the short-term moves.
Our plan is to look for confirmations and alignment of the various targets across the board. For instance, if mining stocks show strength vs. gold while silver plunges, and they all move to important support levels while doing that, we might temporarily close the short positions.
If just one part of the precious metals market appears to be moving to its support level, but other parts continue to show weakness, or we see new bearish signs, we will probably keep the short position intact.
The most important take-away is that right now gold, silver, and mining stocks are still very high compared to where they are likely to be in the next several months, and if one is not positioned to benefit from this decline, we wouldn't wait for any rebound before opening the position - we would open it right now. Of course, the decision is up to you, but that's exactly what your Editor is doing with his and his investors' capital through his investment fund.
The same goes for adding to the position. If you were waiting for a rebound to add to the position that is currently very small (and you want to make it bigger at some point), then it might be best not to wait and proceed now. When the rebound comes, it could be the case that the prices will only manage to move back to the current levels or insignificantly higher than the current values. It could also be the case that there will be no visible rally until gold declines below $1,400. Gold is already down in today's pre-market trading...
Before summarizing, let's quote from our Thursday's Alert to remind ourselves the determinants of the move playing out in front of our eyes:
Key Factors to Keep in Mind
Critical factors:
- The USD Index broke above the very long-term resistance line and verified the breakout above it. Its huge upswing is already underway.
- The USD's long-term upswing is an extremely important and bearish factor for gold. There were only two similar cases in the past few decades, when USD Index was starting profound, long-term bull markets, and they were both accompanied by huge declines in gold and the rest of the precious metals market
- Out of these two similar cases, only one is very similar - the case when gold topped in February 1996. The similarity extends beyond gold's about a yearly delay in reaction to the USD's rally. Also the shape of gold price moves prior to the 1996 high and what we saw in the last couple of years is very similar, which confirm the analysis of the gold-USD link and the above-mentioned implications of USD Index's long-term breakout.
- The similarity between now and 1996 extends to silver and mining stocks - in other words, it goes beyond USD, gold-USD link, and gold itself. The white metal and its miners appear to be in a similar position as well, and the implications are particularly bearish for the miners. After their 1996 top, they erased more than 2/3rds of their prices.
- Many investors got excited by the gold-is-soaring theme in the last few months, but looking beyond the short-term moves, reveals that most of the precious metals sector didn't show substantial strength that would be really visible from the long-term perspective. Gold doesn't appear to be starting a new bull market here, but rather to be an exception from the rule.
- Gold's True Seasonality around the US Labor Day points to a big decline shortly.
Very important, but not as critical factors:
- Long-term technical signs for silver, i.a. the analogy in terms of price to what we saw in 2008, shows that silver could slide even below $10.
- Silver's very long-term cycles point to a major reversal taking place right now and since the most recent move was up, the implications are bearish (this is also silver's technical sign, but it's so important that it deserves its own point)
- Long-term technical signs for gold stocks point to this not being a new gold bull market beginning. Among others, it's their long-term underperformance relative to gold that hint this is rather a corrective upswing within a bear market that is not over yet.
- Record-breaking weekly volume in gold is a strong sign pointing to lower gold prices
Important factors:
- Extreme volume reading in the SIL ETF (proxy for silver stocks) is an effective indication that lower values of silver miners are to be expected
- Silver's short-term outperformance of gold, and gold stocks' short-term underperformance of gold both confirm that the precious metals sector is topping here
- Gold topped almost right at its cyclical turning point, which makes the trend reversal more likely
- Copper broke below its head-and-shoulders pattern and confirmed the breakdown. The last time we saw something similar was in April 2013, when the entire precious metals sector was on the verge of plunging lower.
Moreover, please note that while there may be a recession threat, it doesn't mean that gold has to rally immediately. Both: recession and gold's multi-year rally could be many months away - comparing what happened to bond yields in the 90s confirms that.
Copper moved above the neck level of its head-and-shoulders pattern that's based on the intraday lows, but it didn't invalidate the analogous level based on the weekly closing prices, so we don't think it's justified to say that this bearish formation was invalidated at this time.
Summary
Summing up, the big decline in the precious metals sector appears to be finally underway. While there will be periodic corrections, it seems that we will see them only after gold, silver and mining stocks decline some more. In today's analysis, we updated our short-term downside targets based on the latest information as the recent decline is not as sharp as the 2011 one, so the technique that predicted the 2011 correction might not apply here. Consequently, we are moving our profit-take exit prices and stop-loss levels lower in order to take advantage of the likely rebounds.
Note: the odds are the position in silver will be closed first. In this case, we may also choose to close the remaining positions in gold and mining stocks, but we are not doing so automatically.
As always, we'll keep you - our subscribers - informed.
To summarize:
Trading capital (supplementary part of the portfolio; our opinion): Full speculative short position (250% of the full position) in gold, silver, and mining stocks is justified from the risk/reward perspective with the following stop-loss orders and exit profit-take price levels:
- Gold: profit-take exit price: $1,391; stop-loss: $1,553; initial target price for the DGLD ETN: $36.37; stop-loss for the DGLD ETN: $26.74
- Silver: profit-take exit price: $16,41; stop-loss: $19,06; initial target price for the DSLV ETN: $20.96; stop-loss for the DSLV ETN: $14.07
- Mining stocks (price levels for the GDX ETF): profit-take exit price: $24.62; stop-loss: $30.11; initial target price for the DUST ETF: $10.32; stop-loss for the DUST ETF $6.08
In case one wants to bet on junior mining stocks' prices (we do not suggest doing so - we think senior mining stocks are more predictable in the case of short-term trades - if one wants to do it anyway, we provide the details), here are the stop-loss details and target prices:
- GDXJ ETF: profit-take exit price: $33.82; stop-loss: $41.22
- JDST ETF: profit-take exit price: $21.58 stop-loss: $12.46
Long-term capital (core part of the portfolio; our opinion): No positions (in other words: cash)
Insurance capital (core part of the portfolio; our opinion): Full position
Whether you already subscribed or not, we encourage you to find out how to make the most of our alerts and read our replies to the most common alert-and-gold-trading-related-questions.
Please note that the in the trading section we describe the situation for the day that the alert is posted. In other words, it we are writing about a speculative position, it means that it is up-to-date on the day it was posted. We are also featuring the initial target prices, so that you can decide whether keeping a position on a given day is something that is in tune with your approach (some moves are too small for medium-term traders and some might appear too big for day-traders).
Plus, you might want to read why our stop-loss orders are usually relatively far from the current price.
Please note that a full position doesn't mean using all of the capital for a given trade. You will find details on our thoughts on gold portfolio structuring in the Key Insights section on our website.
As a reminder - "initial target price" means exactly that - an "initial" one, it's not a price level at which we suggest closing positions. If this becomes the case (like it did in the previous trade) we will refer to these levels as levels of exit orders (exactly as we've done previously). Stop-loss levels, however, are naturally not "initial", but something that, in our opinion, might be entered as an order.
Since it is impossible to synchronize target prices and stop-loss levels for all the ETFs and ETNs with the main markets that we provide these levels for (gold, silver and mining stocks - the GDX ETF), the stop-loss levels and target prices for other ETNs and ETF (among other: UGLD, DGLD, USLV, DSLV, NUGT, DUST, JNUG, JDST) are provided as supplementary, and not as "final". This means that if a stop-loss or a target level is reached for any of the "additional instruments" (DGLD for instance), but not for the "main instrument" (gold in this case), we will view positions in both gold and DGLD as still open and the stop-loss for DGLD would have to be moved lower. On the other hand, if gold moves to a stop-loss level but DGLD doesn't, then we will view both positions (in gold and DGLD) as closed. In other words, since it's not possible to be 100% certain that each related instrument moves to a given level when the underlying instrument does, we can't provide levels that would be binding. The levels that we do provide are our best estimate of the levels that will correspond to the levels in the underlying assets, but it will be the underlying assets that one will need to focus on regarding the signs pointing to closing a given position or keeping it open. We might adjust the levels in the "additional instruments" without adjusting the levels in the "main instruments", which will simply mean that we have improved our estimation of these levels, not that we changed our outlook on the markets. We are already working on a tool that would update these levels on a daily basis for the most popular ETFs, ETNs and individual mining stocks.
Our preferred ways to invest in and to trade gold along with the reasoning can be found in the how to buy gold section. Additionally, our preferred ETFs and ETNs can be found in our Gold & Silver ETF Ranking.
As a reminder, Gold & Silver Trading Alerts are posted before or on each trading day (we usually post them before the opening bell, but we don't promise doing that each day). If there's anything urgent, we will send you an additional small alert before posting the main one.
=====
Latest Free Trading Alerts:
Reserve Bank of Australia joined the chorus of easing central banks, cutting interest rates to record lows. Predictably, that sent the Aussie dollar plunging. Should gold bulls cheer this move?
Is Reserve Bank of Australia a New Friend of Gold?
=====
Thank you.
Sincerely,
Przemyslaw Radomski, CFA
Editor-in-chief, Gold & Silver Fund Manager

