

Briefly: in our opinion, full (250% of the regular size of the position) speculative short position in gold, silver, and mining stocks is justified from the risk/reward point of view at the moment of publishing this Alert.
Yesterday's analysis featured the price target for the junior miners, and we used GDXJ as a proxy for the sector. That's not the only proxy out there though, and looking at a different one - Toronto Stock Exchange Venture Index - provides us with an enormously important confirmation. Before moving to the chart, a few words why this index is a proxy for juniors, and why it's not as perfect. It can be used as a proxy for juniors because literally hundreds of junior mining companies are listed on this exchange. It's not a perfect proxy, because there are also other companies listed there that are not even close to the mining business such as tech stocks.
So... What's going on in this proxy for junior miners?
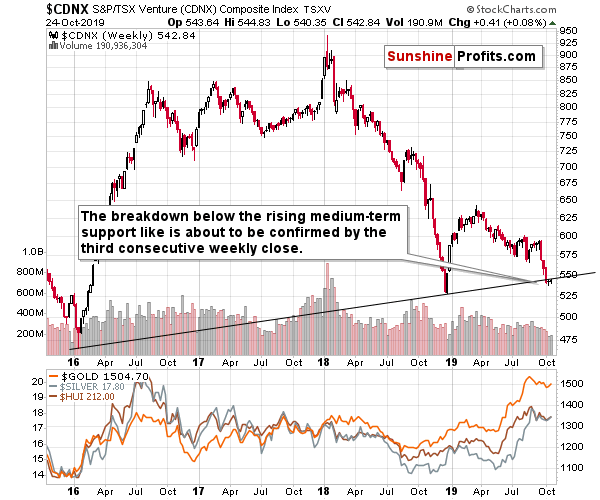
It's declining - that's what's happening. In particular, it declined below the rising medium-term support line that's based on two profound and clear bottoms: the 2016 and 2018 lows. And it's not something that happened just yesterday. It happened about 3 weeks ago and unless the TSX Venture Index rallies today, this week's close will mark the third consecutive weekly close below this line. That's important, because this means that the breakdown - even though it's tiny - was just confirmed. And confirmed breakdowns are likely to be followed by further declines.
Now, the more significant the support that was broken, the bigger decline one can expect, and the line that was just broken is definitely significant.
But maybe the tech stocks just underperformed?
Fat chance - the Nasdaq is very close to its all time highs, so the odds are that it was not the technology sector that dragged the index lower.
Please note how closely did the TSX Venture Index follow precious metals sector (lower part of the chart includes gold, silver, and HUI - proxy for gold stocks) higher in 2016 and how the subsequent decline happened at the same time. The 2018 decline was also more or less in tune. The sizes of the moves were different, but overall, prices moved in the same direction on average in the medium term.
This means that the confirmed breakdown in the TSX Venture sends a huge warning to the gold, silver, and mining stock bulls. It's not an immediate-term or even a short-term sign (we have plenty of them coming from other places), but it is a powerful sign pointing to sector-wide decline in the following months. We have been warned by yet another market. Those who refuse to listen will have to face the costly consequences.
Having said that, let's move to more short-term details.
Precious Metals in the Short-Term
In short, the entire precious metals sector moved higher yesterday, probably because of the ongoing Brexit-related turmoil and likely because of Mario Draghi's gloomy economic warning during his final press conference as president of the ECB.
Precious metals have likely gained on the temporary safe-haven demand. Temporary, because warning by itself is not yet a material change in the fundamental situation. Besides, the Eurozone's structural problems were not really unknown. So, nothing new really happened, but the markets reacted in an emotional manner anyway. They did react in quite a specific way that makes it likely that the upswing was only a brief counter-trend move.
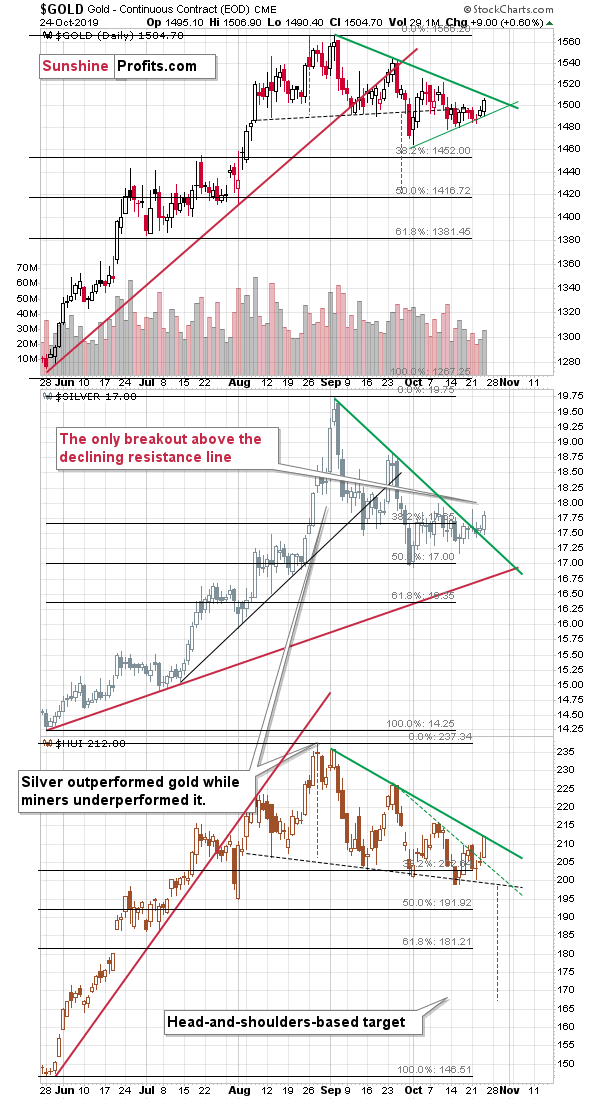
Namely, neither gold, nor mining stocks broke above their declining resistance lines - it was only silver that rallied visibly above its resistance line. In today's pre-market trading, both gold and silver are up, but it's only silver that is visibly up. Gold is less than $2 higher (about 0.11%), but silver is up by $0.24 (1.32%). This is a classic way of the precious metals market saying that the top is likely at hand.
Silver's outperformance preceded multiple declines and it seems that this is yet another case of the same thing.
But miners moved above the recent high and the declining dashed resistance line!
They did, but the dashed resistance line was just an accelerated line - the main resistance line is the thick one that lies a bit higher. This line was reached yesterday, but it was not breached. Consequently, there was no major breakout in the miners. There was no breakout in gold either.
In fact, there is something about gold's upswing that makes it rather bearish.
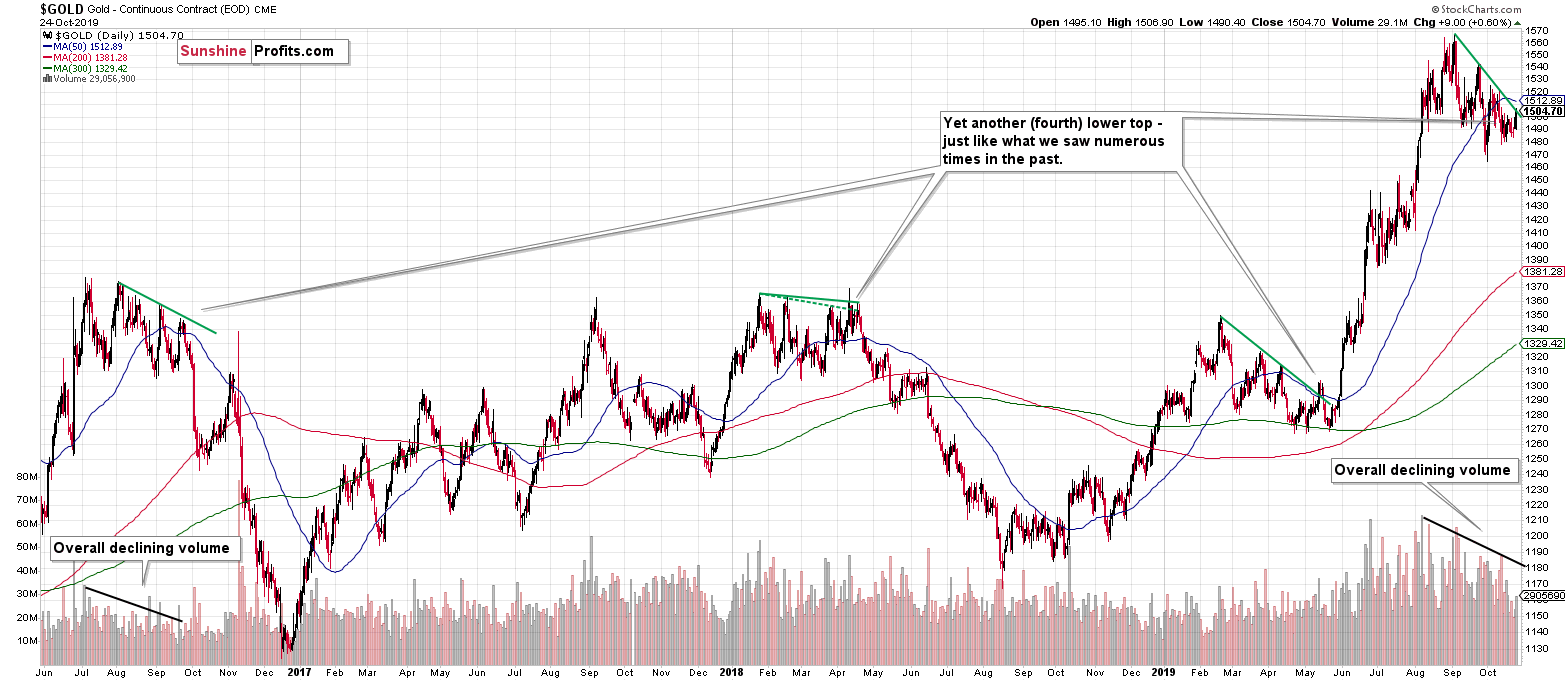
That's the fourth local top in a row and each of them formed lower than the previous one. This makes the current situation similar to what we saw in late 2016 and early 2019. In a way, it's also similar to what we saw in the first half of 2018. In 2016, gold plunged after the fourth top that formed at the declining resistance line. In May 2019, gold declined to the previous lows and then rallied, but still, the short-term decline came first. The first half of 2018 also marked the beginning of a major decline in gold that started at the fourth local top.
The implications of all these cases are bearish in the short term, but they are also mostly bearish for the following weeks and months. The current case seems most similar to what happened in late 2016 because of the time of the year, and because of the contracting volume. Gold's trading is likely to be choppy in October and that's exactly what we saw recently. The above similarity suggests that this choppiness is likely ending right now. Lower gold values are to be expected next.
Before summarizing, let's take a look at the platinum market once again.
Meanwhile, the Little Silver...
Let's start with a quick quote from the previous Alerts:
The first detail is that any market that is generally weak, but then acts strong at a certain time, might simply be rallying just because everything is rallying as the investment public (that enters the market last and buys close to the top) is buying everything without looking at its potential. And in particular if something looks cheaper than something else (e.g. because it was declining previously or precisely because it has unfavorable fundamentals). This means that just by looking at the performance of the weak parts of a given market one can detect the moment, when the investment public is entering the fray, and thus that the top is being formed.
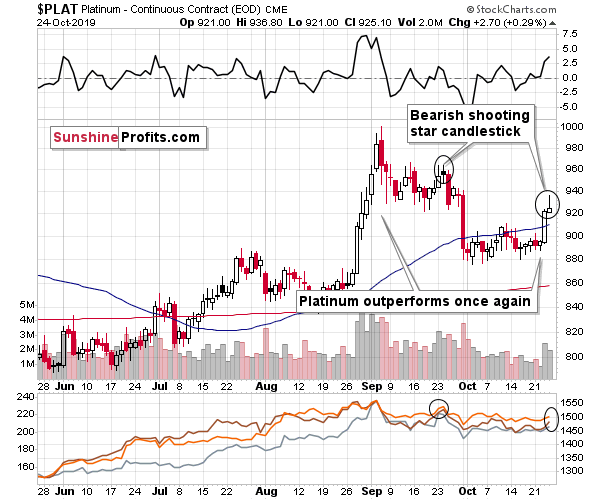
The second detail is that platinum is currently the weakest part of the precious metals sector and this perfectly fits the above-mentioned type of reaction. The size of the platinum market is also relatively small. The fundamental situation for platinum is rather grim as it's being used as a catalyst for diesel car engines that are no longer as often produced as in the past. Gasoline engines are growing in popularity relative to the former and in their case, palladium is used. Both could be hit when electric cars start to take over the market, but that's something that will take many years. The fundamental outlook is one source of information and the technical situation is another one [and the decline in the platinum to gold ratio confirms the above].
The rally that we saw in platinum in August confirmed the end of a multi-week rally in the precious metals sector. Yesterday's upswing in "la platina" may not seem significant enough to matter, but let's keep in mind that gold, silver, and mining stocks are currently after a small rally that took several days, not after a several-month-long one. Consequently, just a daily - but significant - show of strength from platinum may be enough to confirm that the top is in, or very close to being in.
Based on what happened yesterday, it's not just a daily show of strength that makes the outlook bearish. It's also a daily reversal that's similar to the reversal that we saw previously. Shooting star reversal candlesticks are bearish on their own and we saw one yesterday. But, they are even more bearish if they have recently proved to be useful for a given market and that's exactly what happened in case of platinum on September 23rd. It was very close to the top in platinum as well as tops in gold, silver, and mining stocks. While the implications are bearish, it's not necessarily immediately so. There was one additional day of strength (September 24th) before platinum declined, so it might be the case that the decline gets postponed to the next week instead of starting right away.
Naturally, the other key bearish factors for the medium term remain intact.
Key Factors to Keep in Mind
Critical factors:
- The USD Index broke above the very long-term resistance line and verified the breakout above it. Its huge upswing is already underway.
- The USD's long-term upswing is an extremely important and bearish factor for gold. There were only two similar cases in the past few decades, when USD Index was starting profound, long-term bull markets, and they were both accompanied by huge declines in gold and the rest of the precious metals market
- Out of these two similar cases, only one is very similar - the case when gold topped in February 1996. The similarity extends beyond gold's about a yearly delay in reaction to the USD's rally. Also the shape of gold price moves prior to the 1996 high and what we saw in the last couple of years is very similar, which confirm the analysis of the gold-USD link and the above-mentioned implications of USD Index's long-term breakout.
- The similarity between now and 1996 extends to silver and mining stocks - in other words, it goes beyond USD, gold-USD link, and gold itself. The white metal and its miners appear to be in a similar position as well, and the implications are particularly bearish for the miners. After their 1996 top, they erased more than 2/3rds of their prices.
- Many investors got excited by the gold-is-soaring theme in the last few months, but looking beyond the short-term moves, reveals that most of the precious metals sector didn't show substantial strength that would be really visible from the long-term perspective. Gold doesn't appear to be starting a new bull market here, but rather to be an exception from the rule.
- Gold stocks appear to be repeating their performance from 20 years ago, which means that a bottom in the entire precious metals sector is quite likely to form at much lower prices, in about a year
Very important, but not as critical factors:
- Long-term technical signs for silver, i.a. the analogy in terms of price to what we saw in 2008, shows that silver could slide even below $10.
- Silver's very long-term cycles point to a major reversal taking place right now and since the most recent move was up, the implications are bearish (this is also silver's technical sign, but it's so important that it deserves its own point)
- Long-term technical signs for gold stocks point to this not being a new gold bull market beginning. Among others, it's their long-term underperformance relative to gold that hint this is rather a corrective upswing within a bear market that is not over yet.
- Record-breaking weekly volume in gold is a strong sign pointing to lower gold prices
Important factors:
- Extreme volume reading in the SIL ETF (proxy for silver stocks) is an effective indication that lower values of silver miners are to be expected
- Silver's short-term outperformance of gold, and gold stocks' short-term underperformance of gold both confirm that the precious metals sector is topping here
- Gold topped almost right at its cyclical turning point, which makes the trend reversal more likely
- Copper broke below its head-and-shoulders pattern and confirmed the breakdown. The last time we saw something similar was in April 2013, when the entire precious metals sector was on the verge of plunging lower.
Moreover, please note that while there may be a recession threat, it doesn't mean that gold has to rally immediately. Both: recession and gold's multi-year rally could be many months away - comparing what happened to bond yields in the 90s confirms that.
Summary
Summing up, the outlook for the precious metals sector remains very bearish for the following weeks and months and while the short-term outlook remains bearish as well, there is a small possibility that we'll see higher prices before the decline continues. The markets might continue to react emotionally to the Brexit-related turmoil and continue to re-live Draghi's gloomy speech. Based on the triple triangle-vertex-based reversals (visible on today's second chart), we might get another small rally (until early November) before the decline really picks up. Given relatively little potential of the possible (far from certain) rally and the huge potential of the very likely decline, it seems best to keep the current short positions intact.
The similarity to how gold stocks rallied and then declined about 20 years ago provides us with a specific time target for the decline in the entire precious metals sector - it's likely to take place for about 1 year from now. That's not particularly close, but the road lower that gold, silver, and miners are likely to take is not short either. The profits from the short position in gold, silver and mining stocks are likely to be legendary, but the difficult part is not to miss the decline. Fortunately, the slide's pace that we saw 20 years ago provides suggestions regarding when it might be worth to bet on the corrective upswing with one's trading capital and when it's better to wait it out. Based on the analogy to the above-mentioned decline, the next medium-term bottom might take place in mid-December. There are additional indications pointing to a short-term reversal in early November, but at this time it's unclear whether it will be a local top or a bottom.
As always, we'll keep you - our subscribers - informed.
To summarize:
Trading capital (supplementary part of the portfolio; our opinion): F speculative short position (250% of the full position) in gold, silver, and mining stocks are justified from the risk/reward perspective with the following stop-loss orders and binding exit profit-take price levels:
- Gold: profit-take exit price: $1,391; stop-loss: $1,573; initial target price for the DGLD ETN: $36.37; stop-loss for the DGLD ETN: $25.44
- Silver: profit-take exit price: $15.11; stop-loss: $19.06; initial target price for the DSLV ETN: $24.88; stop-loss for the DSLV ETN: $14.07
- Mining stocks (price levels for the GDX ETF): profit-take exit price: $23.21; stop-loss: $30.11; initial target price for the DUST ETF: $14.69; stop-loss for the DUST ETF $6.08
In case one wants to bet on junior mining stocks' prices, here are the stop-loss details and target prices:
- GDXJ ETF: profit-take exit price: $30.32; stop-loss: $41.22
- JDST ETF: profit-take exit price: $35.88 stop-loss: $12.46
Long-term capital (core part of the portfolio; our opinion): No positions (in other words: cash)
Insurance capital (core part of the portfolio; our opinion): Full position
Whether you already subscribed or not, we encourage you to find out how to make the most of our alerts and read our replies to the most common alert-and-gold-trading-related-questions.
Please note that the in the trading section we describe the situation for the day that the alert is posted. In other words, it we are writing about a speculative position, it means that it is up-to-date on the day it was posted. We are also featuring the initial target prices, so that you can decide whether keeping a position on a given day is something that is in tune with your approach (some moves are too small for medium-term traders and some might appear too big for day-traders).
Plus, you might want to read why our stop-loss orders are usually relatively far from the current price.
Please note that a full position doesn't mean using all of the capital for a given trade. You will find details on our thoughts on gold portfolio structuring in the Key Insights section on our website.
As a reminder - "initial target price" means exactly that - an "initial" one, it's not a price level at which we suggest closing positions. If this becomes the case (like it did in the previous trade) we will refer to these levels as levels of exit orders (exactly as we've done previously). Stop-loss levels, however, are naturally not "initial", but something that, in our opinion, might be entered as an order.
Since it is impossible to synchronize target prices and stop-loss levels for all the ETFs and ETNs with the main markets that we provide these levels for (gold, silver and mining stocks - the GDX ETF), the stop-loss levels and target prices for other ETNs and ETF (among other: UGLD, DGLD, USLV, DSLV, NUGT, DUST, JNUG, JDST) are provided as supplementary, and not as "final". This means that if a stop-loss or a target level is reached for any of the "additional instruments" (DGLD for instance), but not for the "main instrument" (gold in this case), we will view positions in both gold and DGLD as still open and the stop-loss for DGLD would have to be moved lower. On the other hand, if gold moves to a stop-loss level but DGLD doesn't, then we will view both positions (in gold and DGLD) as closed. In other words, since it's not possible to be 100% certain that each related instrument moves to a given level when the underlying instrument does, we can't provide levels that would be binding. The levels that we do provide are our best estimate of the levels that will correspond to the levels in the underlying assets, but it will be the underlying assets that one will need to focus on regarding the signs pointing to closing a given position or keeping it open. We might adjust the levels in the "additional instruments" without adjusting the levels in the "main instruments", which will simply mean that we have improved our estimation of these levels, not that we changed our outlook on the markets. We are already working on a tool that would update these levels on a daily basis for the most popular ETFs, ETNs and individual mining stocks.
Our preferred ways to invest in and to trade gold along with the reasoning can be found in the how to buy gold section. Additionally, our preferred ETFs and ETNs can be found in our Gold & Silver ETF Ranking.
As a reminder, Gold & Silver Trading Alerts are posted before or on each trading day (we usually post them before the opening bell, but we don't promise doing that each day). If there's anything urgent, we will send you an additional small alert before posting the main one.
=====
Latest Free Trading Alerts:
Trade wars, geopolitical tensions and slowing economic indicators. Both the ECB and the Fed have recently cut interest rates to stimulate slowing growth, hoping to escape possible recession. Will they succeed? After all, they don't have the most reliable record when it comes to preventing busts. Let's get into the central flaw of central banking and what it implies for gold.
Will Central Banks Prevent Recession and Push Gold Down?
=====
Thank you.
Sincerely,
Przemyslaw Radomski, CFA
Editor-in-chief, Gold & Silver Fund Manager

