

Briefly: in our opinion, full (250% of the regular size of the position) speculative short position in gold, silver, and mining stocks is justified from the risk/reward point of view at the moment of publishing this Alert.
In yesterday's analysis we dealt with silver and we explained why Wednesday's reversal was most likely just a pause within a bigger decline instead of an important reversal, which it might seem like at first sight. Indeed, it wasn't. Silver plunged and so did the rest of the precious metals sector, greatly benefiting our trading position.
In today's premium analysis, we will focus on gold and its price target. Or... should we say - targets. Based on how volatile yesterday's slide was, and how little a rally in the USD Index it took for gold to slide, it seems that there might be a short-term bounce in gold even before it reaches the target that we previously described. But, before moving to details, let's check how yesterday's gold price action caused the outlook to deteriorate even more.
The Gold Outlook Now
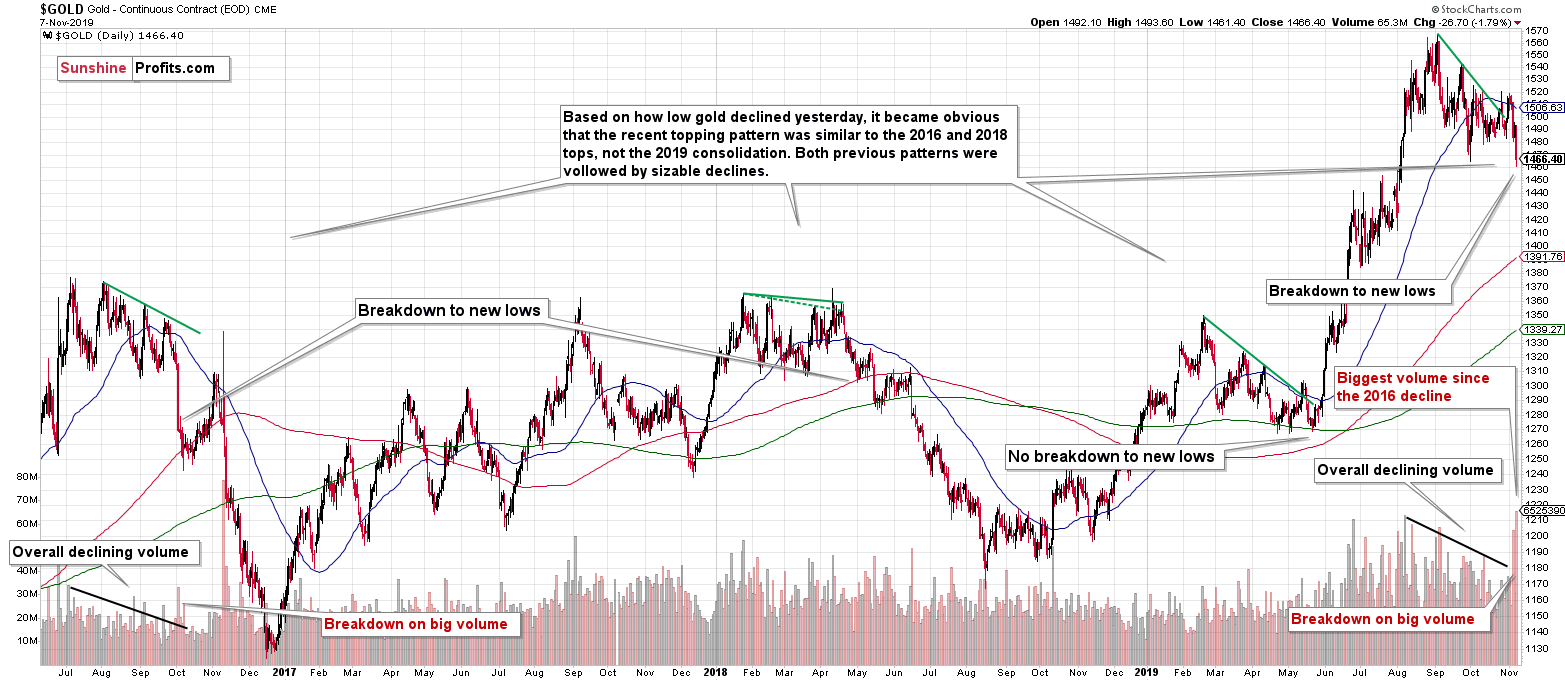
We previously commented on a specific analogy in gold. Namely, the price movement that we've seen since August is very similar to what we saw in mid-2016, early 2018 and early 2019. There were four tops after which gold declined. The very short-term implications were bearish regardless of which of those cases gold was repeating (history tends to rhyme).
The first two similar situations were bearish in the medium term, but the third (early 2019) one was followed by only a quick decline that ended above the previous lows and then a big upswing.
Yesterday's decline was particularly important, because gold moved and closed below the previous (mid-September) low. The same thing - breakdown below previous lows - happened in the first two similar price patterns, and it didn't occur in the third case. This means that we now have a confirmation that what we're seeing now is not like the early-2019 consolidation, but in line with the mid-2016 and early-2018 topping patterns. And what followed these breakdowns to new lows in these two most similar cases?
Big declines.
There was a counter-trend rally in late-2016 before gold moved to its yearly lows, but it was triggered by the U.S. Presidential elections at that time, and it seems that news-based volatility (trade wars, Brexit talks) is not likely to increase substantially here. In fact, it seems to be tapering off. So, while we could see a quick pause here, a big, sharp run-up seems unlikely.
In other words, based on the above-mentioned similarities, gold is poised to decline in the following weeks.
But that's not everything. Please take a look at the volume levels. Gold's volume was declining on average since August until the very recent slide, when the volume soared to levels that were not seen in years.
That's exactly what happened in 2016. The volume was declining on average, while gold was topping (through four local tops, similarly to what we saw recently), but it soared during the breakdown below the previous lows. This makes the late-2016 decline more similar to the current situation than what we saw in 2018. Gold also declined in a more profound and sharp manner in 2016 than it did in 2018. Consequently, gold's short-term outlook is not only bearish, it's very bearish. Of course, this doesn't mean that gold has to slide right away - a couple of days of sideways trading or even a small bounce wouldn't change anything regarding the above.
Let's take a "breather" from the gold analysis for a quick look at the USD Index.
USD Index Rising
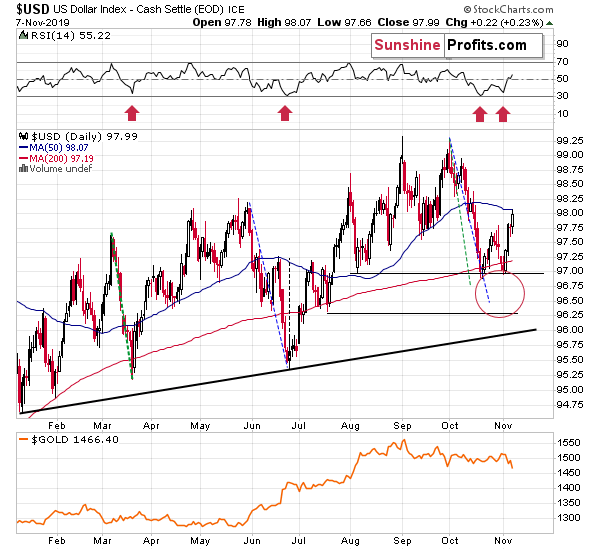
The USD Index moved higher, but the rally was not that big. The USDX is more or less halfway back after the October decline. If gold's performance relative to the USD Index was neutral, gold should be more or less in the midpoint of the recent decline. Instead, gold just closed at a new low. This is a critical confirmation of gold's weakness.
Gold is not showing strength by declining to just its previous lows (slightly below them). Gold is multiplying the bearish signs that it gets. It had little direct reason to break below the previous low yesterday. But it did anyway. Why? Because the bearish storm has been brewing for a long time. As the number of shocking news announcements is lower, the situation is probably going to develop just as it's been likely to, and just as we've been warning for many weeks.
Going forward, gold will not need big reasons to decline. Of course, bearish news will accelerate the decline, while bullish news will trigger pauses, but gold is overall likely to be in the decline mode for longer than most investors expect.
We hope you enjoyed reading the above free analysis, and we encourage you to examine today's Gold & Silver Trading Alert - this analysis' full version. We supplement the above with two specific target areas for gold that could be reached this month or in December. Additionally, we explain why silver or mining stocks didn't break below their recent lows yesterday and what it implies for the path ahead. Of course, we provide target prices not only for gold, but also for silver, mining stocks, and related (leveraged) ETFs. Please keep in mind that thanks to the current promotion, the first 3 weeks of your new subscription will be for just $9 (renews normally, but you can cancel anytime). Get the critical details as well as full 3 weeks of follow-ups - subscribe today!
Perhaps for the next year or so. If this seems surprising, please examine the details, by visiting analyses to which we linked in the "Key Factors" section before the summary of this Alert.
Having said that, let's take a look at the target price for gold along with the possible interim target.
Gold in the Medium-Term
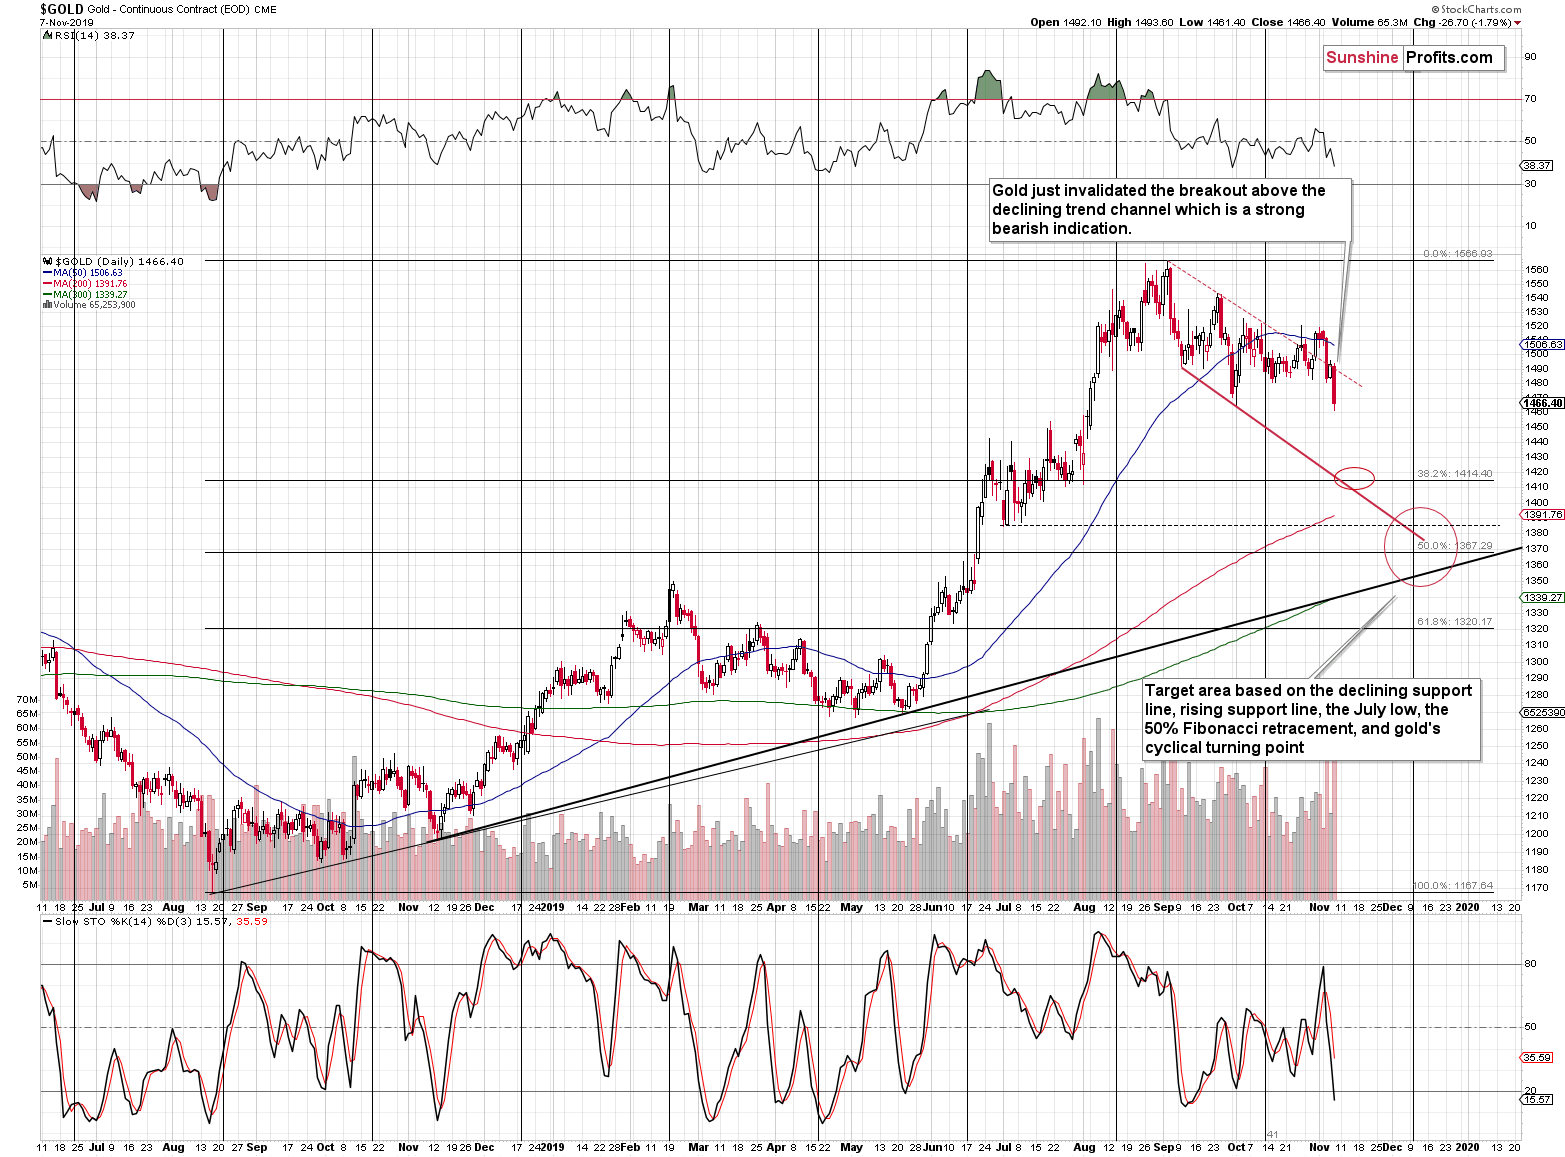
If gold slides very sharply, then it may be the case that the move is unsustainable even on a short-term basis.
That's right - despite myriads of bearish factors that remain in place, gold could still bounce if the price gets too low too fast. Yesterday, gold showed that it can move substantially lower with little help from the USDX. So, what's likely to happen if gold actually gets a sizable push from the USD? It would likely plunge.
The sharper the decline, the less sustainable it usually becomes, especially in the early part of the bigger downswing, and that's where gold is right now. So, while the $1,360 - $1,390 area is still likely to trigger a more visible reversal, if gold declines very sharply right away (next week or even today), then we might get a quick rebound sooner.
At what level could gold reverse in this case? At about $1,410 - $1,420. This is where three important support levels coincide:
- the declining support line
- the 38.2% Fibonacci retracement level
- the early August low that started the sharp decline to the final top.
If gold moves there and at the same time silver and mining stocks move to important support levels of their own, and mining stocks show strength, we might decide to temporarily exit the short positions and perhaps enter long positions.
We are not adjusting the binding profit-take levels for this trade, because whether or not we choose to change anything with gold at $1,420 or so depends also on how silver, miners, and USDX perform at that time (also relative to each other). We are keeping our eyes open for the quick-profit opportunity and we'll keep you informed. The above is simply an early heads-up that something like that might happen in the near future.
The Very Short-Term in PMs
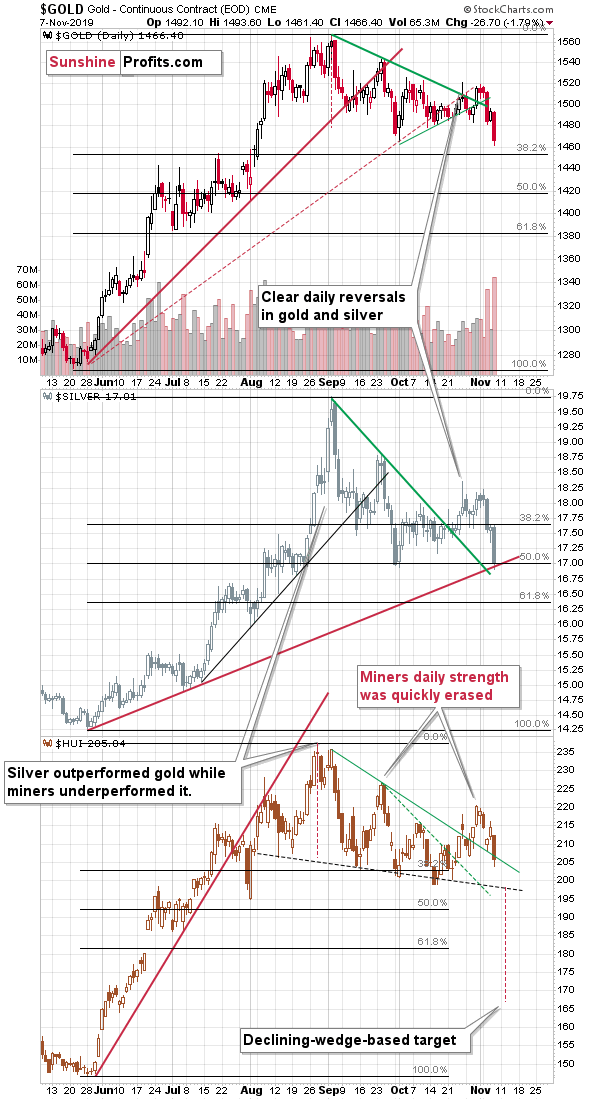
Speaking of silver and mining stocks, you might be wondering why silver didn't decline below the late-September low yesterday, or why the HUI Index didn't move to the previous lows. And if it changes anything regarding the bearish outlook.
Silver has a very good reason in the form of not only the previous low, but also the rising support line (based on the intraday lows) and the 50% Fibonacci retracement based on the previous rally.
This triple support is quite strong, which means that it was quite normal for silver to end yesterday's rally without a breakdown. As gold declines in the following days, silver is likely to break below yesterday's low anyway. The important thing is that silver is likely to decline much more before its short-term decline is comparable to the previous declines - just as we explained it yesterday.
With mining stocks, the situation is a bit different, because the HUI Index actually managed to decline below its declining support line, thus invalidating the earlier breakout. Traders seem to have viewed this support as level that's analogous to the previous lows in gold, so both breakdowns could be treated similarly - they are both bearish. So, it's not the key thing that miners didn't break to new lows - it's more important that they broke back below the declining support line.
Moreover, another proxy for the mining stocks - the GDX ETF - is showing a more decisively bearish picture.
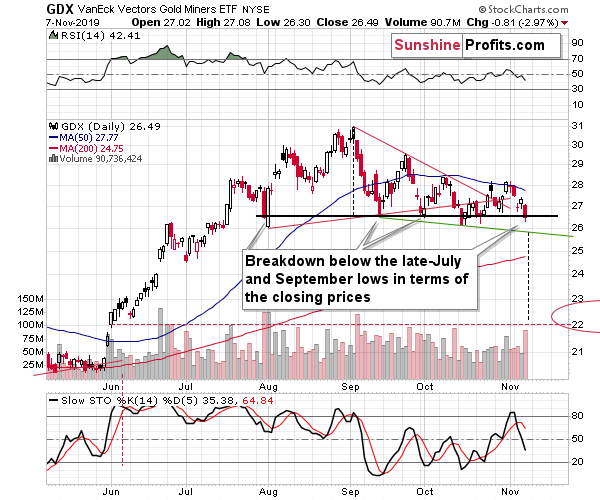
The GDX ETF closed below the lowest closing prices that we saw in late July and twice in September. So, there actually was a breakdown to new lows - just not below the October lows. Consequently, miners' strength is not as significant as it may appear at first sight and it doesn't invalidate any of the bearish points that we made earlier.
Naturally, the other key bearish factors for the medium term remain intact as well.
Key Factors to Keep in Mind
Critical factors:
- The USD Index broke above the very long-term resistance line and verified the breakout above it. Its huge upswing is already underway.
- The USD's long-term upswing is an extremely important and bearish factor for gold. There were only two similar cases in the past few decades, when USD Index was starting profound, long-term bull markets, and they were both accompanied by huge declines in gold and the rest of the precious metals market
- Out of these two similar cases, only one is very similar - the case when gold topped in February 1996. The similarity extends beyond gold's about a yearly delay in reaction to the USD's rally. Also the shape of gold price moves prior to the 1996 high and what we saw in the last couple of years is very similar, which confirm the analysis of the gold-USD link and the above-mentioned implications of USD Index's long-term breakout.
- The similarity between now and 1996 extends to silver and mining stocks - in other words, it goes beyond USD, gold-USD link, and gold itself. The white metal and its miners appear to be in a similar position as well, and the implications are particularly bearish for the miners. After their 1996 top, they erased more than 2/3rds of their prices.
- Many investors got excited by the gold-is-soaring theme in the last few months, but looking beyond the short-term moves, reveals that most of the precious metals sector didn't show substantial strength that would be really visible from the long-term perspective. Gold doesn't appear to be starting a new bull market here, but rather to be an exception from the rule.
- Gold stocks appear to be repeating their performance from 20 years ago, which means that a bottom in the entire precious metals sector is quite likely to form at much lower prices, in about a year
Very important, but not as critical factors:
- Long-term technical signs for silver, i.a. the analogy in terms of price to what we saw in 2008, shows that silver could slide even below $10.
- Silver's very long-term cycles point to a major reversal taking place right now and since the most recent move was up, the implications are bearish (this is also silver's technical sign, but it's so important that it deserves its own point)
- Long-term technical signs for gold stocks point to this not being a new gold bull market beginning. Among others, it's their long-term underperformance relative to gold that hint this is rather a corrective upswing within a bear market that is not over yet.
- Record-breaking weekly volume in gold is a strong sign pointing to lower gold prices
Important factors:
- Extreme volume reading in the SIL ETF (proxy for silver stocks) is an effective indication that lower values of silver miners are to be expected
- Silver's short-term outperformance of gold, and gold stocks' short-term underperformance of gold both confirm that the precious metals sector is topping here
- Gold topped almost right at its cyclical turning point, which makes the trend reversal more likely
- Copper broke below its head-and-shoulders pattern and confirmed the breakdown. The last time we saw something similar was in April 2013, when the entire precious metals sector was on the verge of plunging lower.
Moreover, please note that while there may be a recession threat, it doesn't mean that gold has to rally immediately. Both: recession and gold's multi-year rally could be many months away - comparing what happened to bond yields in the 90s confirms that.
Summary
Summing up, the outlook for the precious metals sector remains very bearish for the following weeks and months.
The profits from the short position in gold, silver and mining stocks are likely to be legendary, but the difficult part is not to miss the decline, which is why we're rather reluctant to exit the short position very often. Still, since no market moves up and down in a straight line, it makes sense to time the moves that appear to have favorable risk to reward ratios. Based on the information that we have available right now, it seems that the next opportunity to take profits from the short positions and perhaps enter long positions will take place next month, quite likely close to $1,400 in gold. However, if we see a good chance for a quick and sizable rebound even before that, we might adjust our trading positions accordingly.
As always, we'll keep you - our subscribers - informed.
To summarize:
Trading capital (supplementary part of the portfolio; our opinion): Full speculative short position (250% of the full position) in gold, silver, and mining stocks are justified from the risk/reward perspective with the following stop-loss orders and binding exit profit-take price levels:
- Gold: profit-take exit price: $1,391; stop-loss: $1,573; initial target price for the DGLD ETN: $36.37; stop-loss for the DGLD ETN: $25.44
- Silver: profit-take exit price: $15.11; stop-loss: $19.06; initial target price for the DSLV ETN: $24.88; stop-loss for the DSLV ETN: $14.07
- Mining stocks (price levels for the GDX ETF): profit-take exit price: $23.21; stop-loss: $30.11; initial target price for the DUST ETF: $14.69; stop-loss for the DUST ETF $6.08
In case one wants to bet on junior mining stocks' prices, here are the stop-loss details and target prices:
- GDXJ ETF: profit-take exit price: $30.32; stop-loss: $41.22
- JDST ETF: profit-take exit price: $35.88 stop-loss: $12.46
Long-term capital (core part of the portfolio; our opinion): No positions (in other words: cash)
Insurance capital (core part of the portfolio; our opinion): Full position
Whether you already subscribed or not, we encourage you to find out how to make the most of our alerts and read our replies to the most common alert-and-gold-trading-related-questions.
Please note that the in the trading section we describe the situation for the day that the alert is posted. In other words, it we are writing about a speculative position, it means that it is up-to-date on the day it was posted. We are also featuring the initial target prices, so that you can decide whether keeping a position on a given day is something that is in tune with your approach (some moves are too small for medium-term traders and some might appear too big for day-traders).
Plus, you might want to read why our stop-loss orders are usually relatively far from the current price.
Please note that a full position doesn't mean using all of the capital for a given trade. You will find details on our thoughts on gold portfolio structuring in the Key Insights section on our website.
As a reminder - "initial target price" means exactly that - an "initial" one, it's not a price level at which we suggest closing positions. If this becomes the case (like it did in the previous trade) we will refer to these levels as levels of exit orders (exactly as we've done previously). Stop-loss levels, however, are naturally not "initial", but something that, in our opinion, might be entered as an order.
Since it is impossible to synchronize target prices and stop-loss levels for all the ETFs and ETNs with the main markets that we provide these levels for (gold, silver and mining stocks - the GDX ETF), the stop-loss levels and target prices for other ETNs and ETF (among other: UGLD, DGLD, USLV, DSLV, NUGT, DUST, JNUG, JDST) are provided as supplementary, and not as "final". This means that if a stop-loss or a target level is reached for any of the "additional instruments" (DGLD for instance), but not for the "main instrument" (gold in this case), we will view positions in both gold and DGLD as still open and the stop-loss for DGLD would have to be moved lower. On the other hand, if gold moves to a stop-loss level but DGLD doesn't, then we will view both positions (in gold and DGLD) as closed. In other words, since it's not possible to be 100% certain that each related instrument moves to a given level when the underlying instrument does, we can't provide levels that would be binding. The levels that we do provide are our best estimate of the levels that will correspond to the levels in the underlying assets, but it will be the underlying assets that one will need to focus on regarding the signs pointing to closing a given position or keeping it open. We might adjust the levels in the "additional instruments" without adjusting the levels in the "main instruments", which will simply mean that we have improved our estimation of these levels, not that we changed our outlook on the markets. We are already working on a tool that would update these levels on a daily basis for the most popular ETFs, ETNs and individual mining stocks.
Our preferred ways to invest in and to trade gold along with the reasoning can be found in the how to buy gold section. Additionally, our preferred ETFs and ETNs can be found in our Gold & Silver ETF Ranking.
As a reminder, Gold & Silver Trading Alerts are posted before or on each trading day (we usually post them before the opening bell, but we don't promise doing that each day). If there's anything urgent, we will send you an additional small alert before posting the main one.
Thank you.
Sincerely,
Przemyslaw Radomski, CFA
Editor-in-chief, Gold & Silver Fund Manager

