

Briefly: in our opinion, full (250% of the regular size of the position) speculative short position in gold, silver, and mining stocks is justified from the risk/reward point of view at the moment of publishing this Alert.
In yesterday's analysis, we explained that gold's decline is likely to continue, and we uncovered the reason behind the recent strength in silver and mining stocks (the general stock market). We also told you that the influence that the main stock indices have on silver and miners wanes off over time. We didn't have to wait long for the market to agree with us. Gold took a deep dive, and both: silver and mining stocks moved considerably lower yesterday, even though the move lower in the S&P 500 was tiny.
The Diving PMs
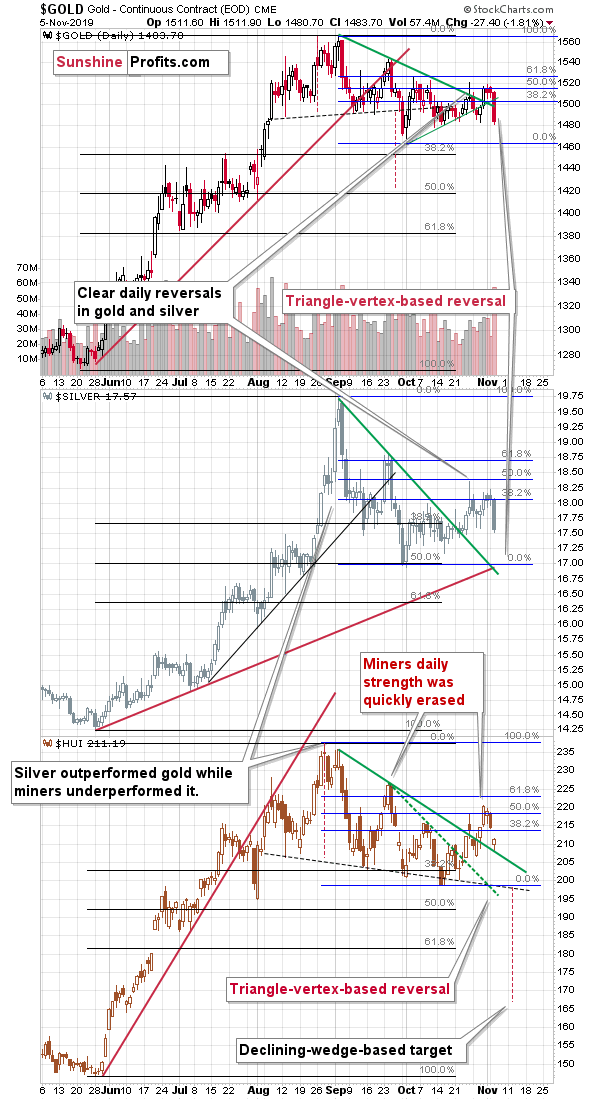
It happened right after the triple triangle-vertex-based reversals that we described days in advance. Just when people were thinking that gold might be moving higher, it declined and erased all its recent gains. It closed almost right at the lowest closing price of October (just $0.20 above it).
Silver didn't close as low as it did in October, but silver's decline continues also today, and it just moved below the mid-October low in terms of the closing prices.
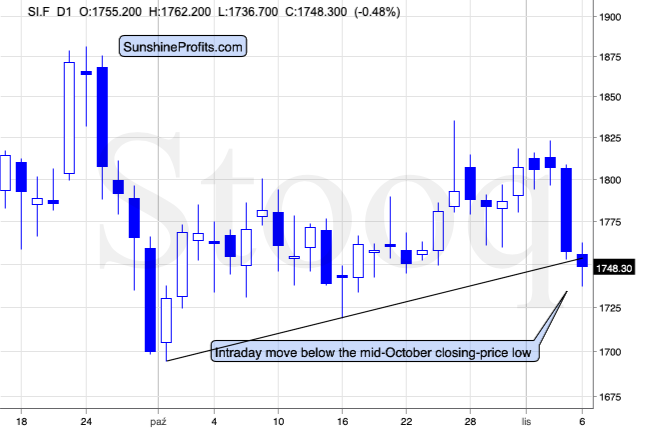
It also moved below the rising support line that's based on two October lows. The breakdown was not confirmed yet, but it already (until it's confirmed, it's just a slight indication, but still) suggests that this decline is not over yet.
How low can the precious metals sector go? Well, you know very well that we expect gold, silver, and mining stocks to move much lower in the following months. However, we don't intend to keep the speculative trading positions intact during all this time. Of course, some investors and traders may want to do so, but that's not how most people prefer to approach this move. We want our trading Alerts to be very useful regardless of whether one agrees with us on precious metals' long- and medium-term moves.
So, yes, we continue to think (based on multiple factors) that the following months will see much lower precious metals values, but at the same time, we aim to profit on the more short-term price swings. And how are we going to do that? By aiming to detect the short-term turnarounds. And the next short-term turnaround is likely coming - and it's likely to take place before the end of this year.
Yes, the above prediction is also based on the vertex-based reversal technique that just worked so flawlessly in detecting the recent top. But getting the right exit price for exiting the position that gains along with lower PM prices is not as straightforward as detecting the likely timing of the reversal.
Most of us heard the saying that when the time is up, the price will reverse. It's all well and nice, until one realizes that the reversal might mean both: the bottom that one expects to see, the corrective top that takes place after the bottom that one wants to detect, or even the corrective top that takes place before the bottom that one wants to detect. Getting out much too early or much too soon means missing out on a lot of profits, which is why getting the price prediction right is a big deal. If both the price and time aspect of the forecast confirm each other, we'll likely have the meaningful reversal and a great exit price. If not, things can get costly. On a side note, this is why it's so useful to have professional daily and intraday updates reflecting the ever developing situation.
So, what's the right price here?
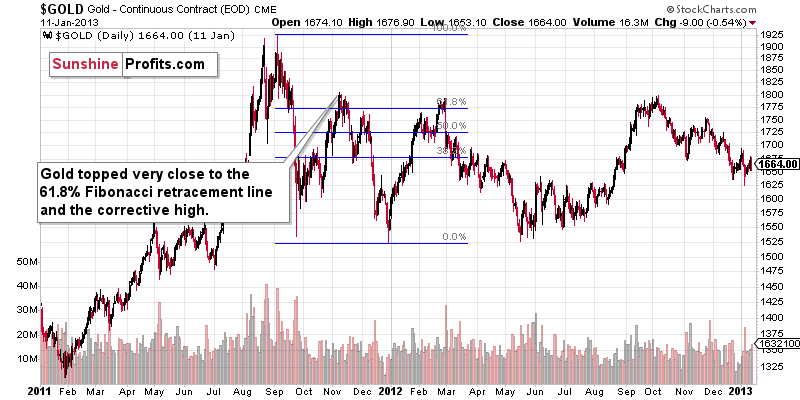
The right exit price is tricky. As we wrote on Monday, gold price has been moving relatively similar to how it's been performing in 2011.
Another Look at the Metals
Quoting our previous analysis:
The similarity may not be obvious at first sight thanks to the different time span, but please focus on the following facts:
- Both rallies in gold (2011 and late-2019) had a short-term consolidation in the middle of the rally.
- Both rallies had an initial (early August 2011 and early August 2019) tops, which were followed by a double-top pattern in which the second high was a bit higher.
- The initial declines (late September 2011 and early September 2019) were quickly followed by counter-trend rallies (November 2011 and late September 2019 tops) and then additional declines to new short-term lows (December 2011 and early October bottom).
What followed about 8 years ago was yet another upswing that ended a bit above the 61.8% Fibonacci retracement and very close to the initial high (November 2011). The history has been repeating itself to a considerable degree, which means that gold might rally to $1,530 - $1,540 once again).
It is not carved in stone, though. The history might rhyme instead of being repeated to the letter, which means that this time, the upswing might be smaller (or higher, if gold really wants to trick a lot of people in a late-Halloween fashion).
If the history is indeed repeating here, it's necessary to ask: "What happened next?"
Gold declined to the previous lows once again, and then launched yet another counter-trend upswing from there. The most recent decline ended at about $1,460, so it might be the case that this level will provide gold with strong support once again, and that we'll see yet another counter-trend rally.
And what if gold declines right away from current price levels? Then it changes absolutely nothing with regard to the above. The 2011 topping pattern and what we've seen in the past several months would be similar nonetheless, with the implication that we're likely to see a counter-trend rally once gold moves to about $1,460 anyway.
However, in Monday's Alert summary, we also wrote:
Also, given the possibility that gold forms a temporary bottom close to $1,460, we are going to strongly consider closing the current short position or even entering long position once it gets there. However, we are not adjusting the binding exit prices for the current trade, because the $1,460 support is not as strong as the combination of the factors that made us place the target at their current levels.
More details are going to become visible once gold moves close to $1,460, and this is already taking place. Yesterday's low was about $1,481, which means that it would take less than repeat of yesterday's daily decline for the $1,460 to be reached. Let's consider what happened in gold's immediate surroundings.
Silver declined profoundly and it seems to be just starting its decline. Silver has recently outperformed on a very short-term basis after having formed a shooting star reversal. It doesn't seem that just a one-day decline or something only a little bigger than that is enough to really be a reasonable response to multiple strong sell signs. Similar signals in the past used to be followed by multi-dollar declines.
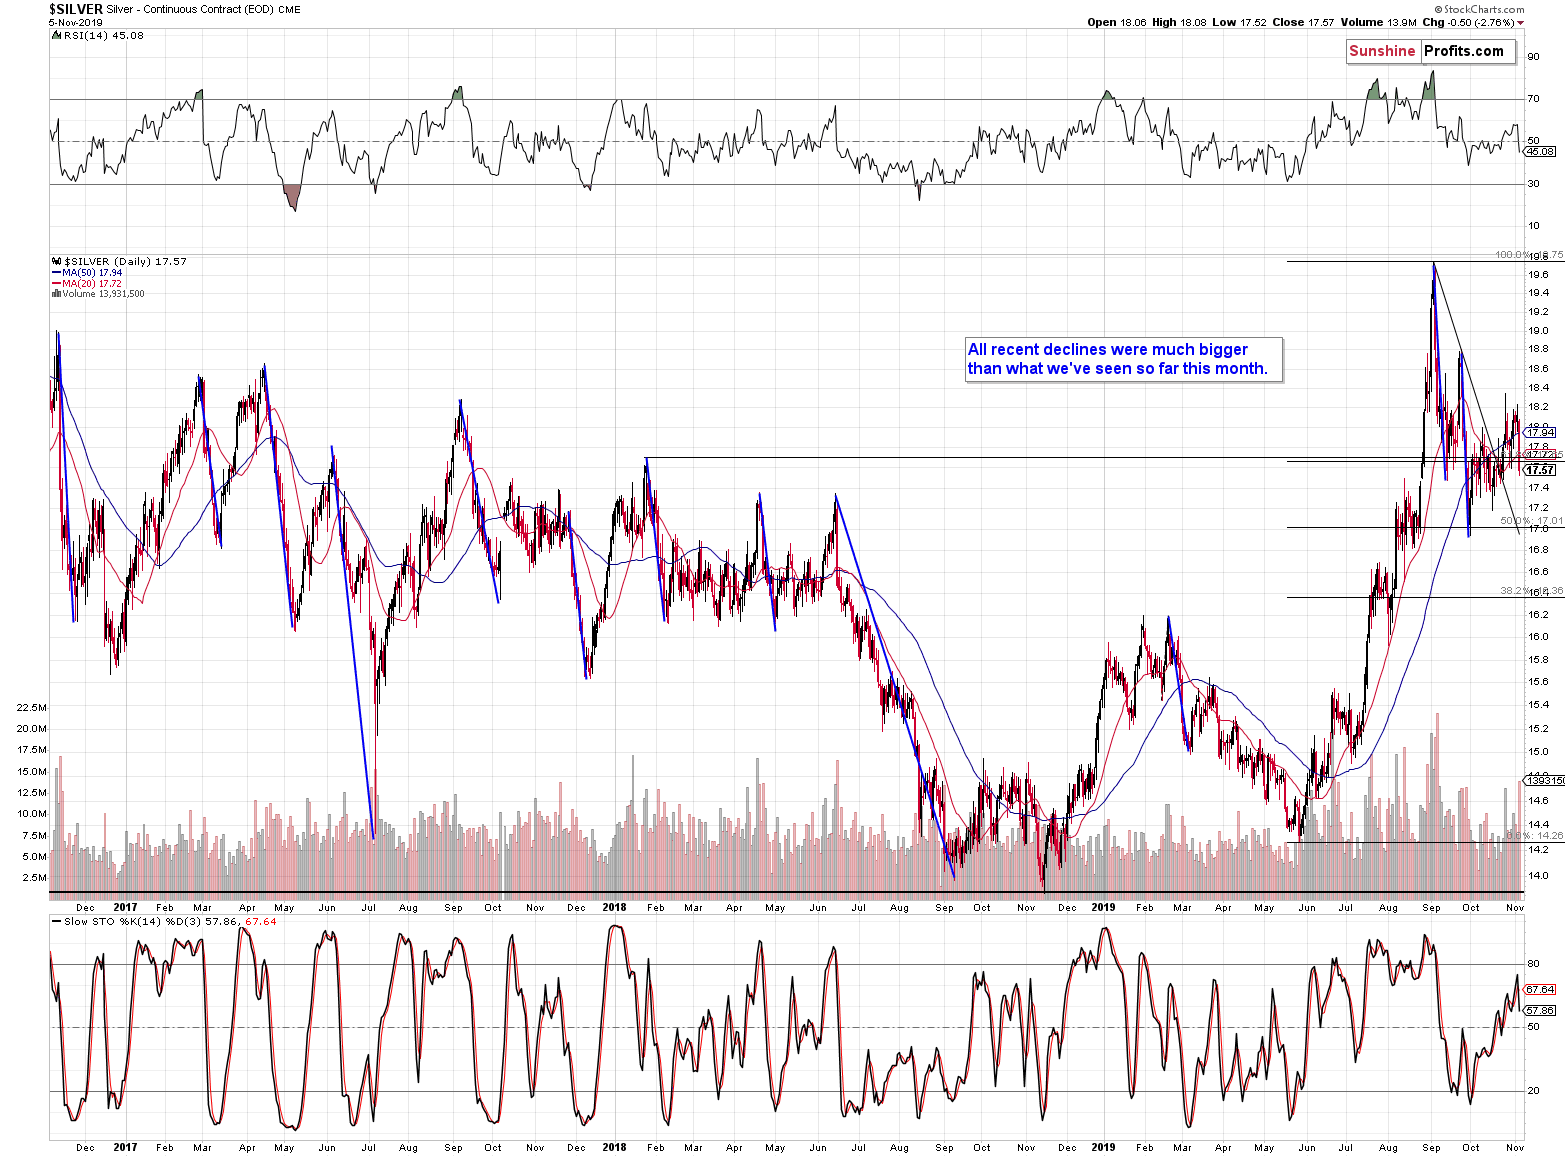
The move that we've seen so far is too small even if compared to the lesser silver declines. And if we compare it to silver's bigger declines, it's almost nonexistent.
The relationship between gold and USD is also very specific. Gold just moved to the October lows, while the USD Index...
The USD Index Rebound: Implications for Gold
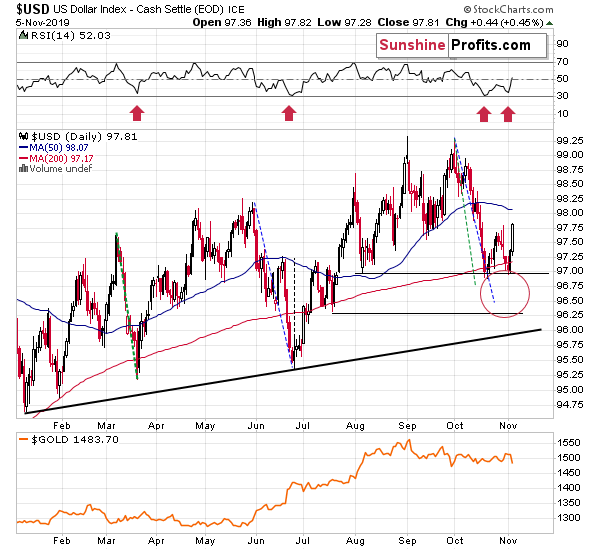
The USD Index is very far from its October high. In fact, the USD Index is still relatively close to its October lows.
Gold is refusing to react to USD's bullish indications to any meaningful extent, while at the same time, it's magnifying / overreacting to USD's bearish indications. This is another factor that suggests that gold may have much more to fall instead of just - almost - repeating yesterday's daily decline.
- Ok, but what about the analogy to 2011?
Gold is still likely to move more or less in tune with its 2011 performance, but it seems that the bottoms may not be as aligned as they were in 2011. In fact, looking closer at the way the bottoms formed in 2011 and how the first two bottoms formed recently, suggests some discrepancies.
The first two bottoms in 2011 (September and December) were more or less aligned. However, the early September 2019 and early October 2019 lows were not as aligned. This means that perhaps the third bottom might not be aligned either. And if it is, then it may not be as regularly aligned as the mid-2012 low was.
Before yesterday's decline, gold's interim bottom close to $1,460 was somewhat likely, but based on how gold declined yesterday and how little it took to trigger this move, it's no longer the case.
- So, if not $1,460, then what level is likely to trigger a more meaningful and tradable counter-trend rally?
Our original target for this trade was slightly below $1,400. We originally based this target on the long-term indications, but it's confirmed by the medium- and short-term details as well, which makes it even more likely to be reached.
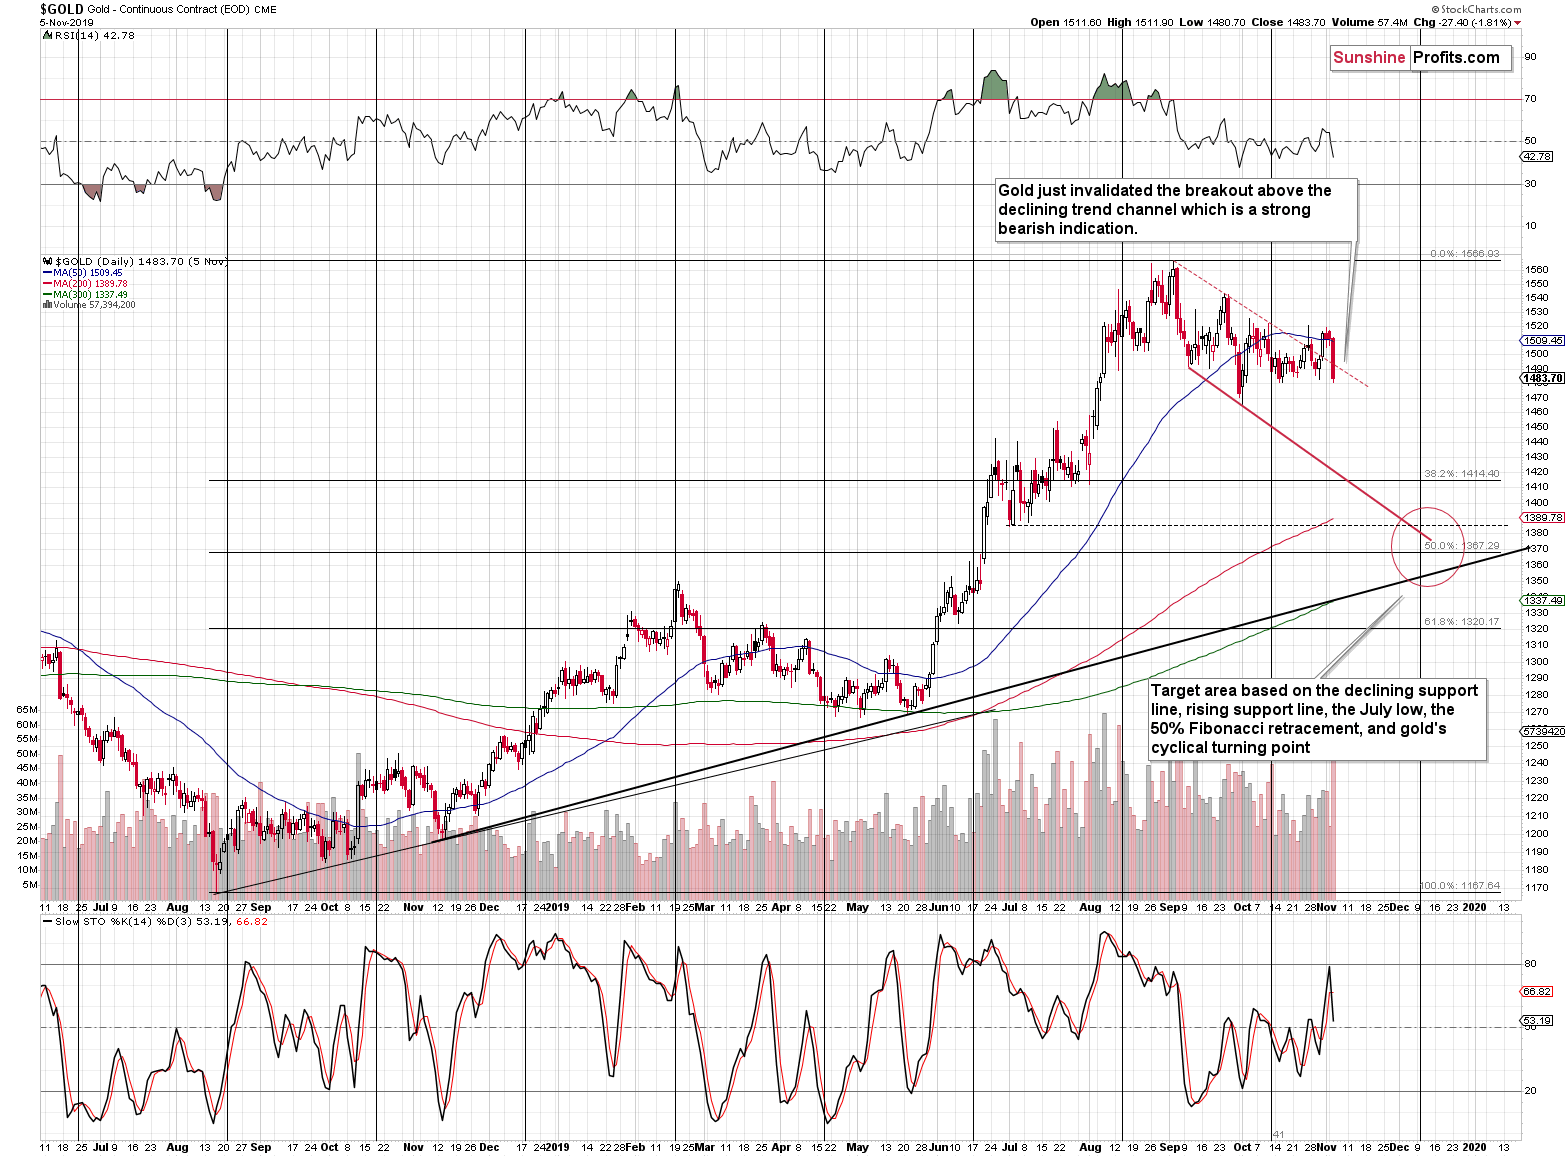
The mid-December reversal was based on the triangle-vertex-based reversal, but it's additionally confirmed by gold's cyclical turning point (vertical lines on the above chart).
As far as price is concerned, please note that the rising medium-term support line, the declining red support line based on the two recent lows, and the early July bottom, these all happen at a similar price level. They don't cross, but that doesn't invalidate them. It could be the case, for instance, that gold reaches the lowest target on an intraday basis, but one of the higher ones in terms of the daily closing prices. We are using the target of $1,391 as it's slightly above the highest of the above-mentioned support levels - this significantly increases the odds of realizing the trade while at the same time ensuring that the profit potential of the short position remains significant.
The red support line is important in terms of similarity to 2011 and 2012. If the 2011 and 2012 lows were aligned, but the second of the recent lows was lower than the previous one, then it might be reasonable to expect the third bottom to also be aligned... But based on the rule that's in place right now, now based on the rule from 2011 - if back then the bottoms formed at similar price, and now then are being formed on lower levels, then the third bottom is also likely to be formed at a lower level. How low? Drawing a support line based on the previous lows is exactly the way to check how low gold should go for the next bottom to be proportionate to the previous ones. After all, the declining lines on the chart are used to measure the pace at which the price moves lower, and what we want to assume here is that the pace at which gold bottoms is constant - just as it was almost constant in 2011 and 2012. Back then the pace was constant and there was no decline, and now the pace might be constant within a decline.
Please note that the above chart features three additional reasons for gold to decline:
- The clear sell signal from the Stochastic indicator
- High volume on which gold declined yesterday, confirming its direction
- Invalidation of gold's breakout above the declining trend channel
Naturally, the other key bearish factors for the medium term remain intact as well.
Key Factors to Keep in Mind
Critical factors:
- The USD Index broke above the very long-term resistance line and verified the breakout above it. Its huge upswing is already underway.
- The USD's long-term upswing is an extremely important and bearish factor for gold. There were only two similar cases in the past few decades, when USD Index was starting profound, long-term bull markets, and they were both accompanied by huge declines in gold and the rest of the precious metals market
- Out of these two similar cases, only one is very similar - the case when gold topped in February 1996. The similarity extends beyond gold's about a yearly delay in reaction to the USD's rally. Also the shape of gold price moves prior to the 1996 high and what we saw in the last couple of years is very similar, which confirm the analysis of the gold-USD link and the above-mentioned implications of USD Index's long-term breakout.
- The similarity between now and 1996 extends to silver and mining stocks - in other words, it goes beyond USD, gold-USD link, and gold itself. The white metal and its miners appear to be in a similar position as well, and the implications are particularly bearish for the miners. After their 1996 top, they erased more than 2/3rds of their prices.
- Many investors got excited by the gold-is-soaring theme in the last few months, but looking beyond the short-term moves, reveals that most of the precious metals sector didn't show substantial strength that would be really visible from the long-term perspective. Gold doesn't appear to be starting a new bull market here, but rather to be an exception from the rule.
- Gold stocks appear to be repeating their performance from 20 years ago, which means that a bottom in the entire precious metals sector is quite likely to form at much lower prices, in about a year
Very important, but not as critical factors:
- Long-term technical signs for silver, i.a. the analogy in terms of price to what we saw in 2008, shows that silver could slide even below $10.
- Silver's very long-term cycles point to a major reversal taking place right now and since the most recent move was up, the implications are bearish (this is also silver's technical sign, but it's so important that it deserves its own point)
- Long-term technical signs for gold stocks point to this not being a new gold bull market beginning. Among others, it's their long-term underperformance relative to gold that hint this is rather a corrective upswing within a bear market that is not over yet.
- Record-breaking weekly volume in gold is a strong sign pointing to lower gold prices
Important factors:
- Extreme volume reading in the SIL ETF (proxy for silver stocks) is an effective indication that lower values of silver miners are to be expected
- Silver's short-term outperformance of gold, and gold stocks' short-term underperformance of gold both confirm that the precious metals sector is topping here
- Gold topped almost right at its cyclical turning point, which makes the trend reversal more likely
- Copper broke below its head-and-shoulders pattern and confirmed the breakdown. The last time we saw something similar was in April 2013, when the entire precious metals sector was on the verge of plunging lower.
Moreover, please note that while there may be a recession threat, it doesn't mean that gold has to rally immediately. Both: recession and gold's multi-year rally could be many months away - comparing what happened to bond yields in the 90s confirms that.
Summary
Summing up, the outlook for the precious metals sector remains very bearish for the following weeks and months and given the current triple reversal, it might be the case that the counter-trend rally is already over.
The profits from the short position in gold, silver and mining stocks are likely to be legendary, but the difficult part is not to miss the decline, which is why we're rather reluctant to exit the short position very often. Still, since no market moves up and down in a straight line, it makes sense to time the moves that appear to have favorable risk to reward ratios. Based on the information that we have available right now, it seems that the next opportunity to take profits from the short positions and perhaps enter long positions will take place next month, quite likely close to $1,400 in gold.
As always, we'll keep you - our subscribers - informed.
To summarize:
Trading capital (supplementary part of the portfolio; our opinion): Full speculative short position (250% of the full position) in gold, silver, and mining stocks are justified from the risk/reward perspective with the following stop-loss orders and binding exit profit-take price levels:
- Gold: profit-take exit price: $1,391; stop-loss: $1,573; initial target price for the DGLD ETN: $36.37; stop-loss for the DGLD ETN: $25.44
- Silver: profit-take exit price: $15.11; stop-loss: $19.06; initial target price for the DSLV ETN: $24.88; stop-loss for the DSLV ETN: $14.07
- Mining stocks (price levels for the GDX ETF): profit-take exit price: $23.21; stop-loss: $30.11; initial target price for the DUST ETF: $14.69; stop-loss for the DUST ETF $6.08
In case one wants to bet on junior mining stocks' prices, here are the stop-loss details and target prices:
- GDXJ ETF: profit-take exit price: $30.32; stop-loss: $41.22
- JDST ETF: profit-take exit price: $35.88 stop-loss: $12.46
Long-term capital (core part of the portfolio; our opinion): No positions (in other words: cash)
Insurance capital (core part of the portfolio; our opinion): Full position
Whether you already subscribed or not, we encourage you to find out how to make the most of our alerts and read our replies to the most common alert-and-gold-trading-related-questions.
Please note that the in the trading section we describe the situation for the day that the alert is posted. In other words, it we are writing about a speculative position, it means that it is up-to-date on the day it was posted. We are also featuring the initial target prices, so that you can decide whether keeping a position on a given day is something that is in tune with your approach (some moves are too small for medium-term traders and some might appear too big for day-traders).
Plus, you might want to read why our stop-loss orders are usually relatively far from the current price.
Please note that a full position doesn't mean using all of the capital for a given trade. You will find details on our thoughts on gold portfolio structuring in the Key Insights section on our website.
As a reminder - "initial target price" means exactly that - an "initial" one, it's not a price level at which we suggest closing positions. If this becomes the case (like it did in the previous trade) we will refer to these levels as levels of exit orders (exactly as we've done previously). Stop-loss levels, however, are naturally not "initial", but something that, in our opinion, might be entered as an order.
Since it is impossible to synchronize target prices and stop-loss levels for all the ETFs and ETNs with the main markets that we provide these levels for (gold, silver and mining stocks - the GDX ETF), the stop-loss levels and target prices for other ETNs and ETF (among other: UGLD, DGLD, USLV, DSLV, NUGT, DUST, JNUG, JDST) are provided as supplementary, and not as "final". This means that if a stop-loss or a target level is reached for any of the "additional instruments" (DGLD for instance), but not for the "main instrument" (gold in this case), we will view positions in both gold and DGLD as still open and the stop-loss for DGLD would have to be moved lower. On the other hand, if gold moves to a stop-loss level but DGLD doesn't, then we will view both positions (in gold and DGLD) as closed. In other words, since it's not possible to be 100% certain that each related instrument moves to a given level when the underlying instrument does, we can't provide levels that would be binding. The levels that we do provide are our best estimate of the levels that will correspond to the levels in the underlying assets, but it will be the underlying assets that one will need to focus on regarding the signs pointing to closing a given position or keeping it open. We might adjust the levels in the "additional instruments" without adjusting the levels in the "main instruments", which will simply mean that we have improved our estimation of these levels, not that we changed our outlook on the markets. We are already working on a tool that would update these levels on a daily basis for the most popular ETFs, ETNs and individual mining stocks.
Our preferred ways to invest in and to trade gold along with the reasoning can be found in the how to buy gold section. Additionally, our preferred ETFs and ETNs can be found in our Gold & Silver ETF Ranking.
As a reminder, Gold & Silver Trading Alerts are posted before or on each trading day (we usually post them before the opening bell, but we don't promise doing that each day). If there's anything urgent, we will send you an additional small alert before posting the main one.
Thank you.
Sincerely,
Przemyslaw Radomski, CFA
Editor-in-chief, Gold & Silver Fund Manager

