

Briefly: in our opinion, full (250% of the regular size of the position) speculative short position in gold, silver, and mining stocks is justified from the risk/reward point of view at the moment of publishing this Alert. Silver reached its profit-take level, which was also a trigger for entering short positions.
Not much happened yesterday. And yet everything crucial did.
Yesterday's price action was almost meaningless if one looks at it without any context, and without prior investigation of the technical picture of gold, silver, mining stocks, and the USD Index. At the same time, however, it was a profound cherry on the analytical cake. It was like the first tiny lightning after the storm had been brewing for hours.
The final high had likely been put in on Tuesday, when the GDX topped almost exactly at our profit-take level of $27.88. Yesterday's small move higher was likely the final goodbye kiss to the $28 level in GDX, $1,490 in gold, and silver above $17. The white metal closed the day slightly above $17, but it's already below $17 in today's pre-market trading.
Why was yesterday's session so significant? For several reasons. We already laid the short-term analytical foundation yesterday, therefore we won't go over the situation in mining stocks again today, but the fact that they moved exactly to their target is already a bearish factor.
The big deal that is likely going below traders' radars is what happened in the USD Index, and - most importantly - how gold and silver reacted to it.
USD Index Bottoming
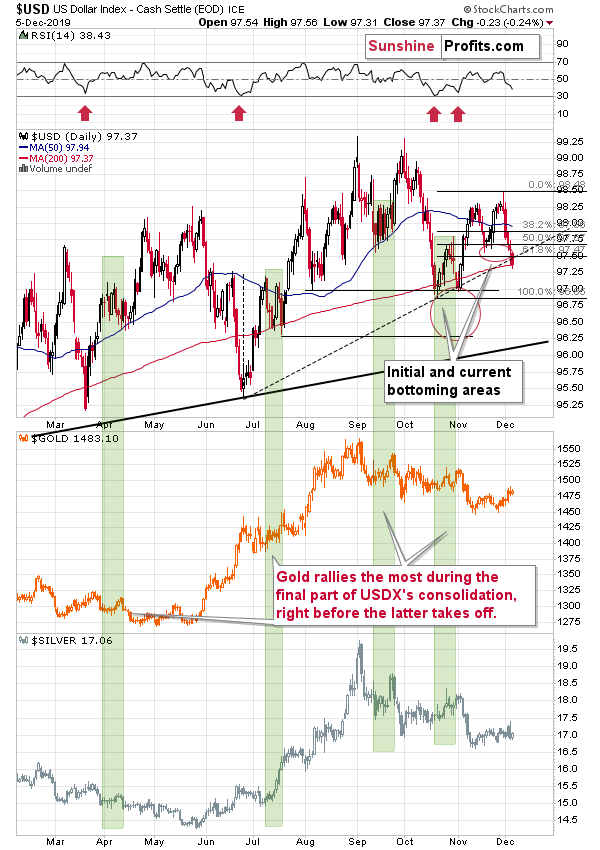
The USDX declined once again and it's very close to its short-term support level - at about 97.20 (in yesterday's analysis we explained why 97.20 is significant). Yesterday's low was 97.31 - just 0.11 above it.
This might mean that the USD Index low is already in, especially since yesterday's decline was a small breakdown below the rising dashed support line. The previous attempt to break lower was immediately followed by a strong rally. That rally corresponded with a sizable short-term decline in gold.
At the moment of writing these words, the USD Index already moved a bit higher today, which means that we might see an invalidation of the above-mentioned breakdown very soon.
USD's outlook is one thing, but the way gold and silver reacted to USD's decline and a move to the new monthly low is something different. And even more important.
The prices of gold and silver didn't move to new highs. In fact, silver was barely affected by yesterday's decline in the USDX. This is a subtle, yet very important confirmation of multiple factors that we've been describing in previous days. After all, it happened right after the double triangle-vertex-based reversal, which was already a reason good enough for the metals to form a top.
The Miners in the Meantime
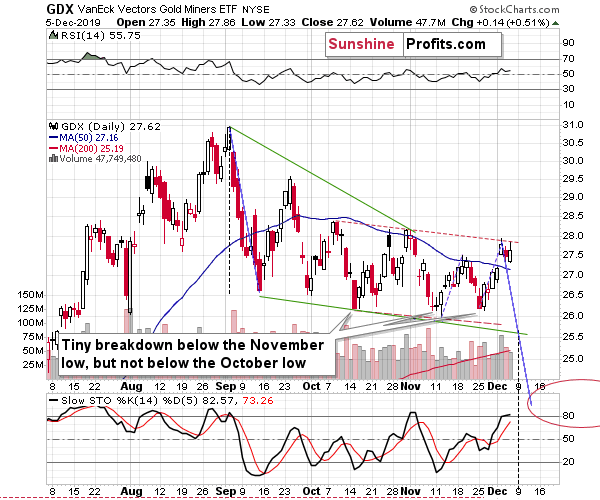
Mining stocks didn't move much higher either. After the initial test of the previous highs, they erased some of the gains and ended the day only 14 cents higher.
If Tuesday's top was not the final top for this rally, PMs would have likely rallied much more significantly yesterday. They didn't, so the odds are that the top for this rally is already in.
Before moving to gold, let's take look at its proxy, the GLD ETF. It's showing something specific that the regular gold chart doesn't.
Turning to Gold
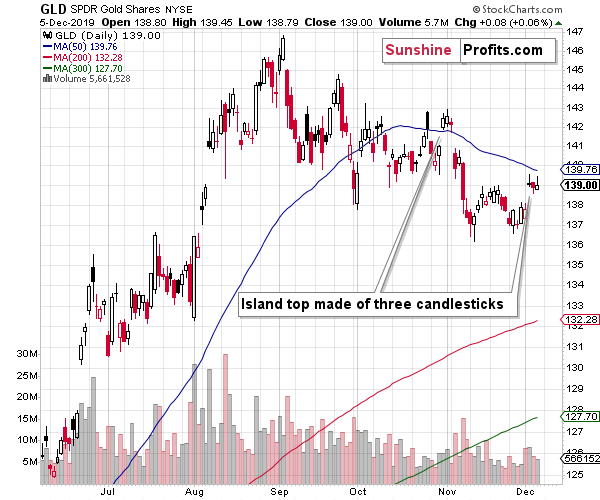
The GLD chart is based on the stock market session, so it covers only a certain part of the time that gold futures chart cover. But at times, this can actually be a good thing. It can make the comparisons between similar situations easier. For instance, right now.
Looking at the above chart makes it clear that the last three trading days are actually an island top - something that happens after a price gap and is formed when the price doesn't then do much for a few days. The decline that follows is quite often similar to the one that precedes the top - at least initially.
That's exactly what happened last month. The November decline started with a price gap that was almost exactly the same as the price gap that preceded the top. The implication is that gold could slide shortly, perhaps later today.
And how low could gold slide in the near term?
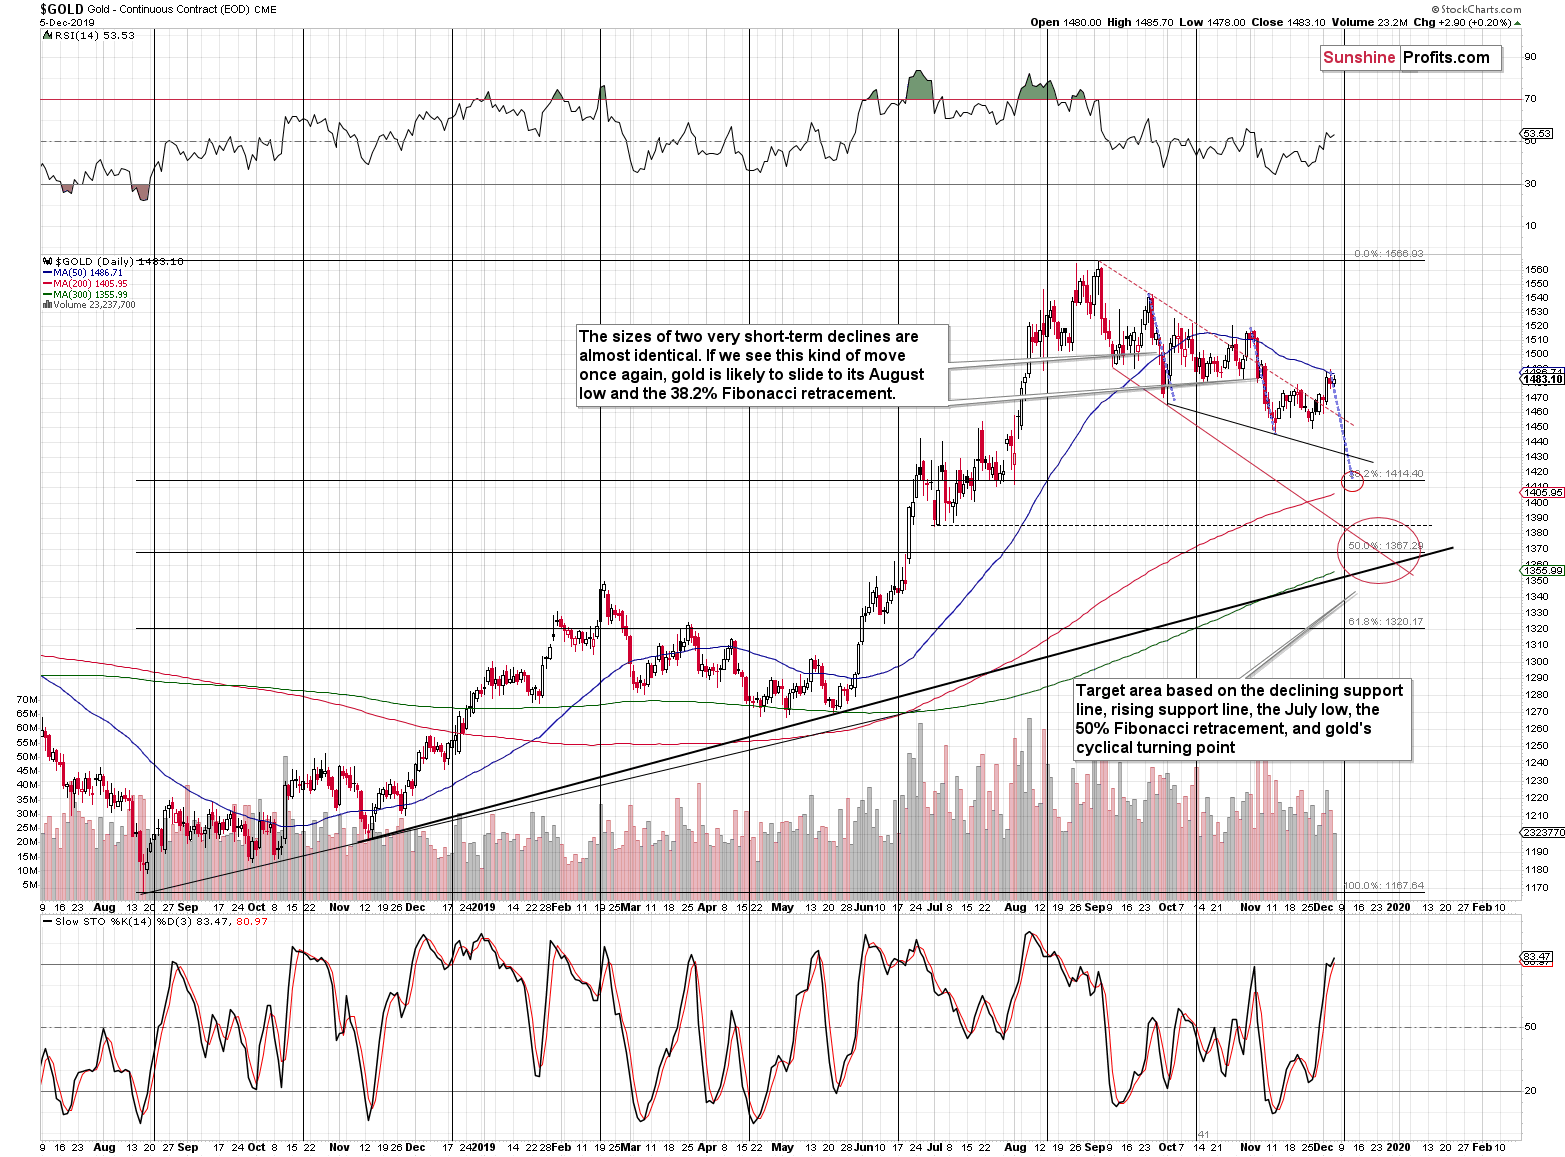
Gold is likely to decline at least as much (approximately) as it had declined during the recent short-term declines. We copied the November decline to September and to the current situation. It's clear that the September decline was almost identical. Applying the same size and pace of decline to the current situation, we get a prediction that gold will decline to about $1,415 before correcting.
This level is additionally supported by the 38.2% Fibonacci retracement based on the 2018 - 2019 rally, and the August low. Moreover, given the pace at which gold declined previously and the proximity of the next cyclical turning point for gold (the middle of next week), gold may not have time to decline more before correcting.
The lower target area is bigger and stronger. It is based on the rising medium-term support line, the declining support line (red), the 50% Fibonacci retracement, and the July low. Most importantly, it's supported by the long-term gold chart.
The rising medium-term support line that we already mentioned above crosses with the support line that's based on the 2016 and 2018 highs, which makes the $1,360 (approximately) support particularly strong. Moreover, let's keep in mind that since these two major lines are crossing, we're likely to see a reversal at that time.
Interestingly, this triangle-vertex-based reversal corresponds to the reversal from the previous short-term gold chart. This means that both reversals confirm each other and that they are even stronger as a result. In other words, gold is very likely to form a reversal close to the end of the year.
That's also when the nearest very long-term triangle-based reversal is scheduled.
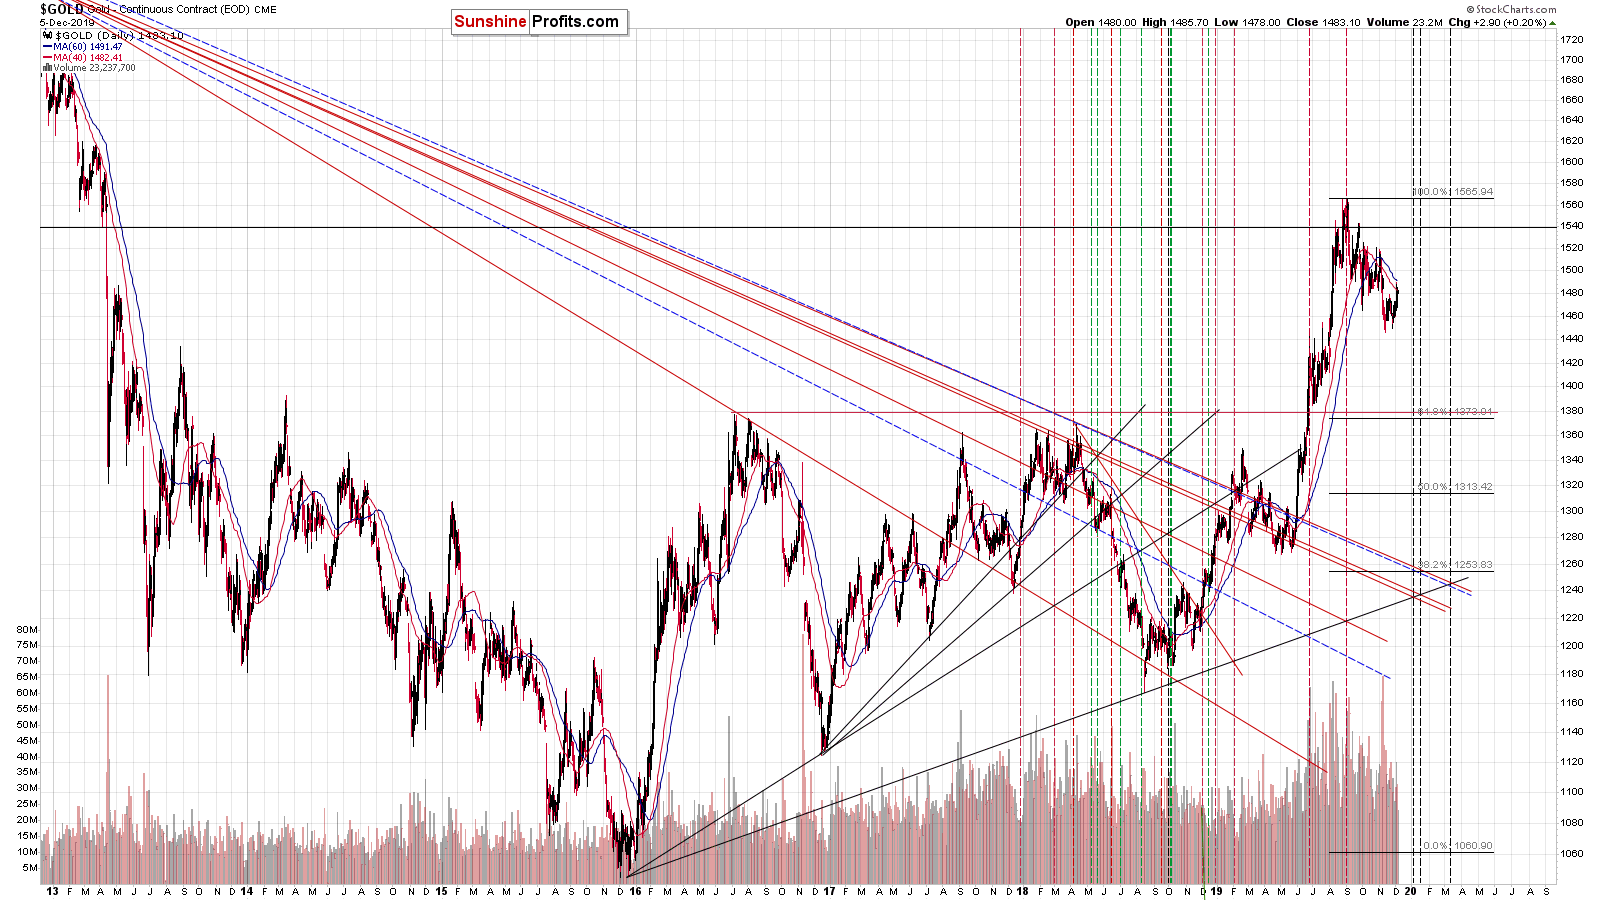
This means that the odds for a major reversal at the end of the year increase even further.
Summed up, what does it all mean? That gold could decline shortly, correct a bit after reaching the proximity of $1,415, then decline once again until - approximately - the end of the year. Then correct once again - perhaps more visibly - and then gold's decline would likely continue.
However, we are not adjusting our binding profit-take prices for the current decline as it's unclear if the rebound from $1,415 would be anything significant enough to justify a change in the trading position. The move to our lower target area most likely will be enough to warrant a rebound by itself, but it's not clear with regard to the $1,415 target. Please note that just because it's not clear now, it doesn't mean that it will not clarify shortly. Let's keep in mind that the long position that we just profitably closed was also not planned in advance and it was a result of seeing several bullish signs that emerged very close to the November bottom. Naturally, we will keep you - our subscribers - informed.
Also, the key bearish factors for the medium term remain intact.
Key Factors to Keep in Mind
Critical factors:
- The USD Index broke above the very long-term resistance line and verified the breakout above it. Its huge upswing is already underway.
- The USD's long-term upswing is an extremely important and bearish factor for gold. There were only two similar cases in the past few decades, when USD Index was starting profound, long-term bull markets, and they were both accompanied by huge declines in gold and the rest of the precious metals market
- Out of these two similar cases, only one is very similar - the case when gold topped in February 1996. The similarity extends beyond gold's about a yearly delay in reaction to the USD's rally. Also the shape of gold price moves prior to the 1996 high and what we saw in the last couple of years is very similar, which confirm the analysis of the gold-USD link and the above-mentioned implications of USD Index's long-term breakout.
- The similarity between now and 1996 extends to silver and mining stocks - in other words, it goes beyond USD, gold-USD link, and gold itself. The white metal and its miners appear to be in a similar position as well, and the implications are particularly bearish for the miners. After their 1996 top, they erased more than 2/3rds of their prices.
- Many investors got excited by the gold-is-soaring theme in the last few months, but looking beyond the short-term moves, reveals that most of the precious metals sector didn't show substantial strength that would be really visible from the long-term perspective. Gold doesn't appear to be starting a new bull market here, but rather to be an exception from the rule.
- Gold stocks appear to be repeating their performance from 20 years ago, which means that a bottom in the entire precious metals sector is quite likely to form at much lower prices, in about a year
Very important, but not as critical factors:
- Long-term technical signs for silver, i.a. the analogy in terms of price to what we saw in 2008, shows that silver could slide even below $10.
- Silver's very long-term cycles point to a major reversal taking place right now and since the most recent move was up, the implications are bearish (this is also silver's technical sign, but it's so important that it deserves its own point)
- Long-term technical signs for gold stocks point to this not being a new gold bull market beginning. Among others, it's their long-term underperformance relative to gold that hint this is rather a corrective upswing within a bear market that is not over yet.
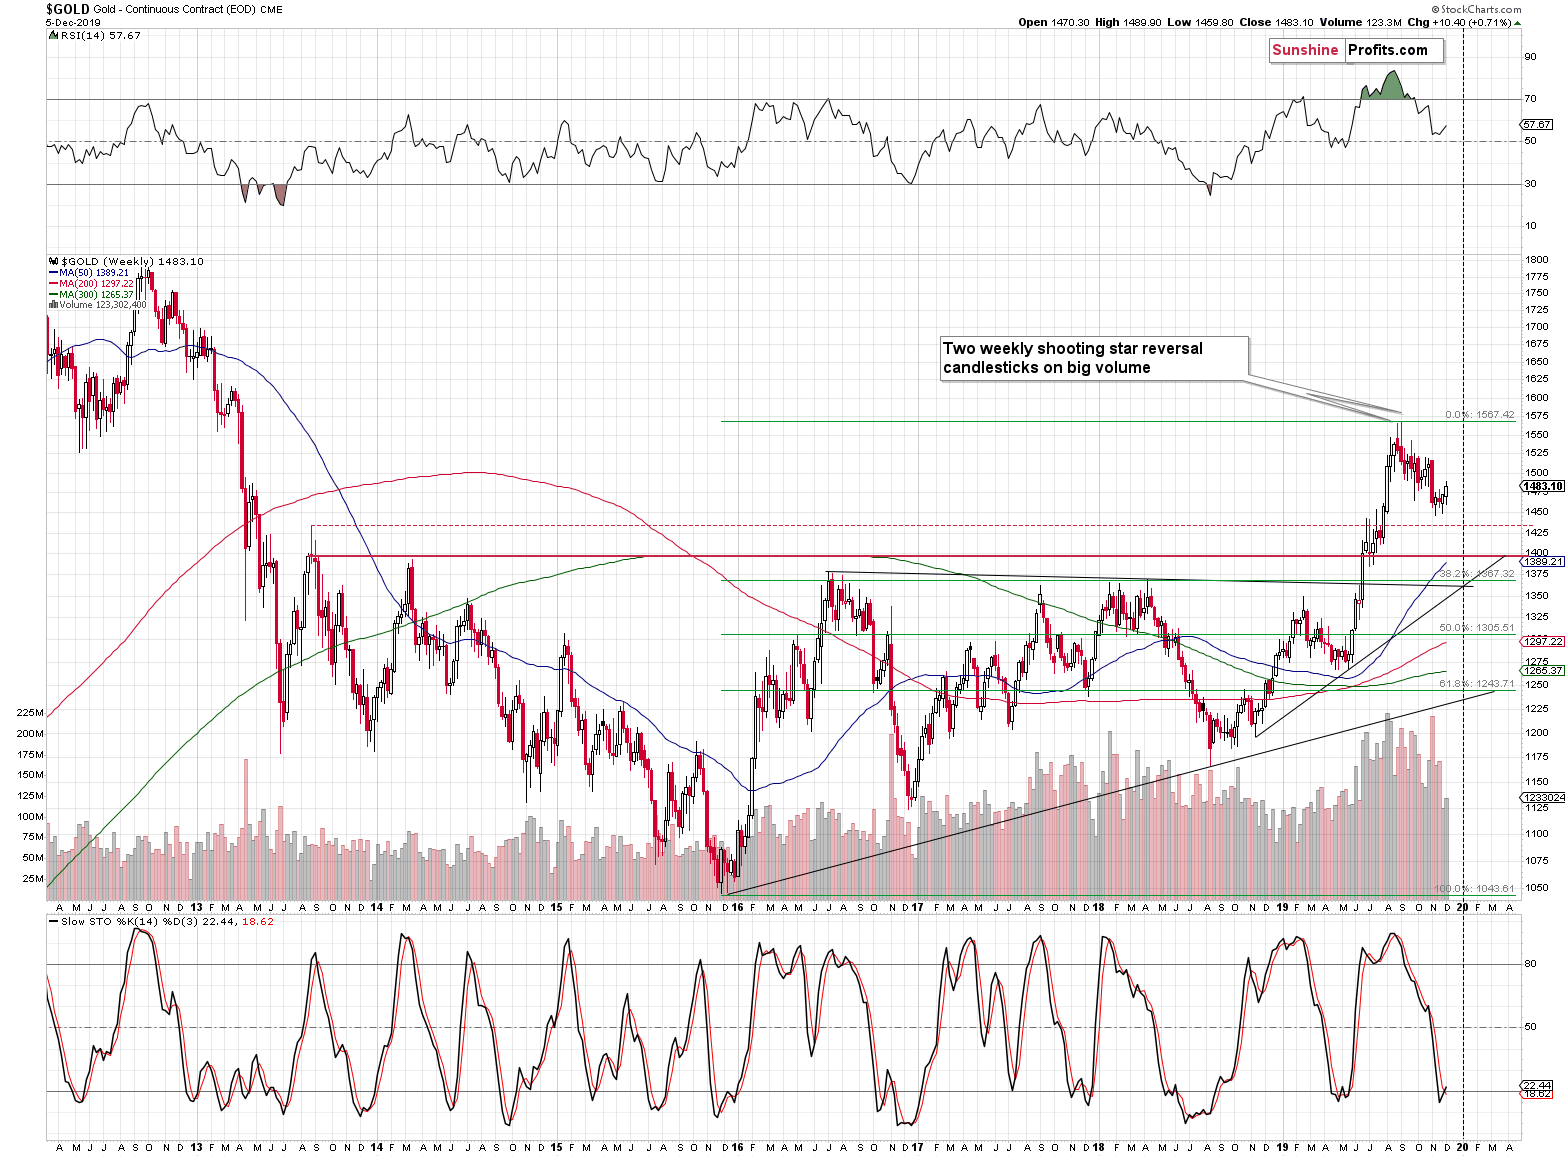
- Record-breaking weekly volume in gold is a strong sign pointing to lower gold prices
Important factors:
- Extreme volume reading in the SIL ETF (proxy for silver stocks) is an effective indication that lower values of silver miners are to be expected
- Silver's short-term outperformance of gold, and gold stocks' short-term underperformance of gold both confirm that the precious metals sector is topping here
- Gold topped almost right at its cyclical turning point, which makes the trend reversal more likely
- Copper broke below its head-and-shoulders pattern and confirmed the breakdown. The last time we saw something similar was in April 2013, when the entire precious metals sector was on the verge of plunging lower.
Moreover, please note that while there may be a recession threat, it doesn't mean that gold has to rally immediately. Both: recession and gold's multi-year rally could be many months away - comparing what happened to bond yields in the 90s confirms that.
Summary
Summing up, the outlook for the precious metals sector is very bearish for the next months, weeks and - quite likely - days. Gold is likely to decline in the following days and weeks, with possible corrections likely starting close to the middle of the month and its end. We just took profits from the long positions and our new short position is already profitable. It could be the case that we're going to take (partial or complete) profits from this position next week, but it's too early to say that with certainty right now.
As always, we'll keep you - our subscribers - informed.
To summarize:
Trading capital (supplementary part of the portfolio; our opinion): Full speculative short position (250% of the full position) in gold, silver, and mining stocks is justified from the risk/reward perspective with the following stop-loss orders and binding exit profit-take price levels:
- Gold futures: profit-take exit price: $1,391; stop-loss: $1,573; initial target price for the DGLD ETN: $36.37; stop-loss for the DGLD ETN: $25.44
- Silver futures: profit-take exit price: $15.11; stop-loss: $19.06; initial target price for the DSLV ETN: $24.88; stop-loss for the DSLV ETN: $14.07
- Mining stocks (price levels for the GDX ETF): profit-take exit price: $23.21; stop-loss: $30.11; initial target price for the DUST ETF: $14.69; stop-loss for the DUST ETF $6.08
In case one wants to bet on junior mining stocks' prices, here are the stop-loss details and target prices:
- GDXJ ETF: profit-take exit price: $30.32; stop-loss: $44.22
- JDST ETF: profit-take exit price: $35.88 stop-loss: $11.68
Long-term capital (core part of the portfolio; our opinion): No positions (in other words: cash)
Insurance capital (core part of the portfolio; our opinion): Full position
Whether you already subscribed or not, we encourage you to find out how to make the most of our alerts and read our replies to the most common alert-and-gold-trading-related-questions.
Please note that the in the trading section we describe the situation for the day that the alert is posted. In other words, it we are writing about a speculative position, it means that it is up-to-date on the day it was posted. We are also featuring the initial target prices, so that you can decide whether keeping a position on a given day is something that is in tune with your approach (some moves are too small for medium-term traders and some might appear too big for day-traders).
Plus, you might want to read why our stop-loss orders are usually relatively far from the current price.
Please note that a full position doesn't mean using all of the capital for a given trade. You will find details on our thoughts on gold portfolio structuring in the Key Insights section on our website.
As a reminder - "initial target price" means exactly that - an "initial" one, it's not a price level at which we suggest closing positions. If this becomes the case (like it did in the previous trade) we will refer to these levels as levels of exit orders (exactly as we've done previously). Stop-loss levels, however, are naturally not "initial", but something that, in our opinion, might be entered as an order.
Since it is impossible to synchronize target prices and stop-loss levels for all the ETFs and ETNs with the main markets that we provide these levels for (gold, silver and mining stocks - the GDX ETF), the stop-loss levels and target prices for other ETNs and ETF (among other: UGLD, DGLD, USLV, DSLV, NUGT, DUST, JNUG, JDST) are provided as supplementary, and not as "final". This means that if a stop-loss or a target level is reached for any of the "additional instruments" (DGLD for instance), but not for the "main instrument" (gold in this case), we will view positions in both gold and DGLD as still open and the stop-loss for DGLD would have to be moved lower. On the other hand, if gold moves to a stop-loss level but DGLD doesn't, then we will view both positions (in gold and DGLD) as closed. In other words, since it's not possible to be 100% certain that each related instrument moves to a given level when the underlying instrument does, we can't provide levels that would be binding. The levels that we do provide are our best estimate of the levels that will correspond to the levels in the underlying assets, but it will be the underlying assets that one will need to focus on regarding the signs pointing to closing a given position or keeping it open. We might adjust the levels in the "additional instruments" without adjusting the levels in the "main instruments", which will simply mean that we have improved our estimation of these levels, not that we changed our outlook on the markets. We are already working on a tool that would update these levels on a daily basis for the most popular ETFs, ETNs and individual mining stocks.
Our preferred ways to invest in and to trade gold along with the reasoning can be found in the how to buy gold section. Additionally, our preferred ETFs and ETNs can be found in our Gold & Silver ETF Ranking.
As a reminder, Gold & Silver Trading Alerts are posted before or on each trading day (we usually post them before the opening bell, but we don't promise doing that each day). If there's anything urgent, we will send you an additional small alert before posting the main one.
Thank you.
Sincerely,
Przemyslaw Radomski, CFA
Editor-in-chief, Gold & Silver Fund Manager

