

Briefly: in our opinion, small (50% of the regular size of the position) speculative long positions in gold, silver, and mining stocks are justified from the risk/reward point of view at the moment of publishing this Alert.
Gold, silver and mining stocks moved higher during the last 24 hours, while the USD Index declined - just like they were all likely to. But in terms of the daily closing prices, silver moved lower, gold miners moved higher, and gold did barely anything. What does this tell us? What's in store for the gold price in December 2019?
These Days in PMs
It tells us that the short-term rally in the precious metals sector most likely still has some steam left in it. We've emphasized it many times before and we posted a big research paper on it - silver tends to outperform gold on a very short-term basis at the end of a given upswing, while mining stocks tend to be strong in the first half of the move.
Silver is definitely not outperforming on a short-term basis right now, but mining stocks have been magnifying gold price's gains in the last few weeks. This means that we haven't seen the final part of the short-term upswing just yet.
When it arrives - quite likely within the next several days - traders are once again likely to get excited by silver's "strength" and they will view as a good omen. Conversely, it will most likely be a perfect selling opportunity before the decline continues.
Why would the top form within the next several days? Our yesterday's comments on that matter remain up-to-date:
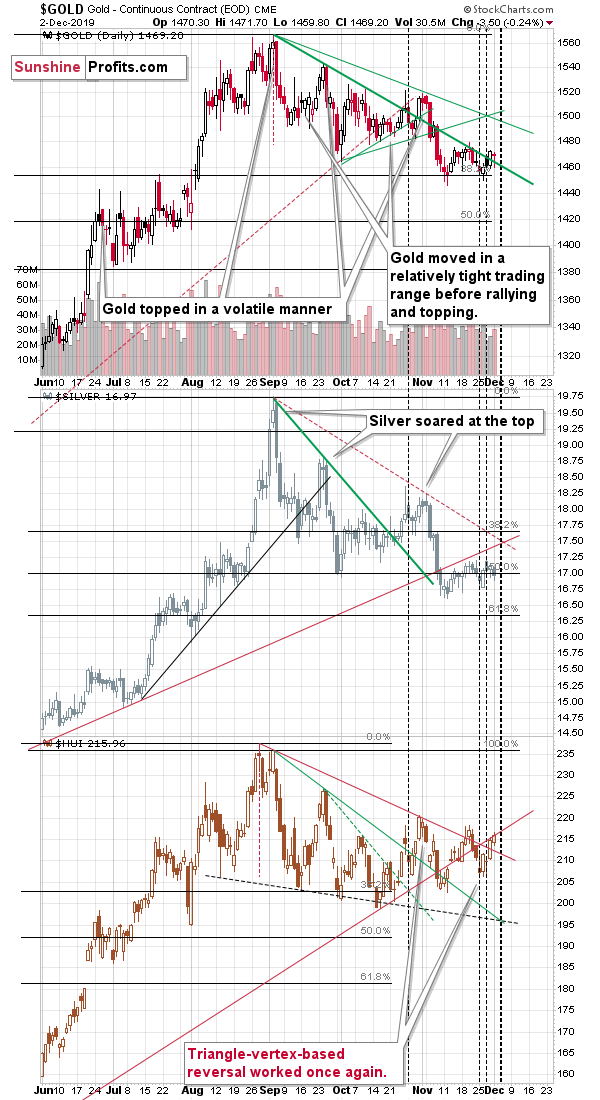
Because of the looming triangle-vertex based turning point. The recent turning points for gold, silver and mining stocks worked perfectly by pinpointing the early November top, and they also correctly estimated the most recent reversals - the local bottoms after which gold, silver and miners moved higher.
The early November top is clearest in case of silver (middle of the above chart), while the recent local bottoms are most clearly visible in case of gold miners (lower part of the chart).
The next triangle reversal is due this week, which makes it likely that we'll see some kind of turnaround shortly. The important detail about this turnaround is that it's confirmed by not one but two markets - silver and miners, which increases the odds that the reversal will indeed take place. The early-November top, for instance, was indicated by all three parts of the PM market at once.
Let's keep in mind that it's not the only factor pointing to this outcome. The True Seasonality for gold confirms the above.
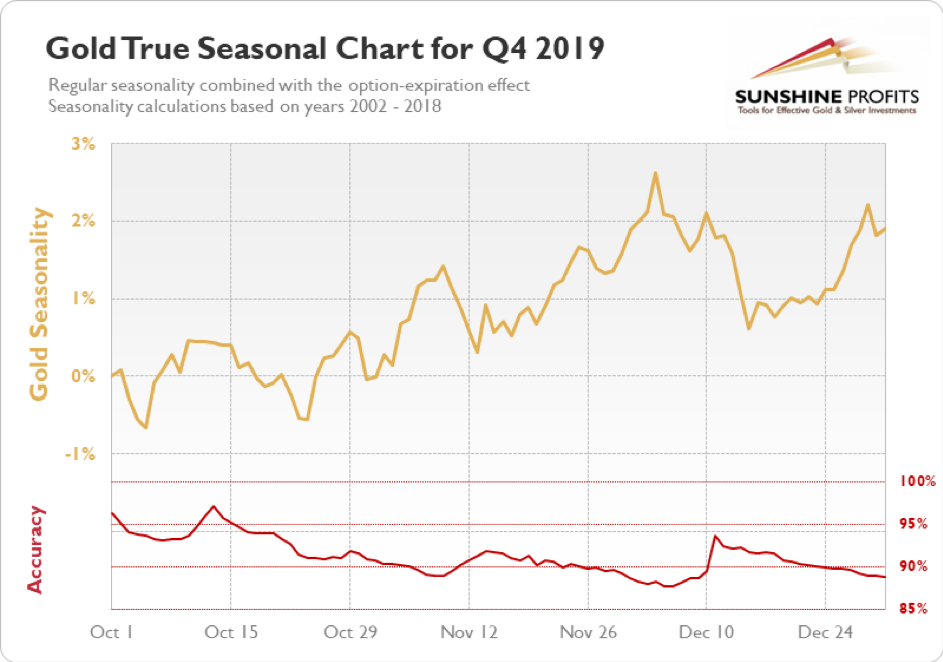
On average, gold price has been spiking around late November and early December. Please note that while on average gold performs best in late November, the accuracy reading actually rises strongly in the next several days. This means that while the biggest price moves usually happened sooner, some of them arrive a bit late. When gold soared sooner, it didn't decline immediately. The take-away here is that even if the above is not 100% correct, and price spike doesn't happen right away, it means that it's still likely to arrive shortly.
Gold price is also likely to get some more help from the declining USD Index.
The Greenback's Support for Gold
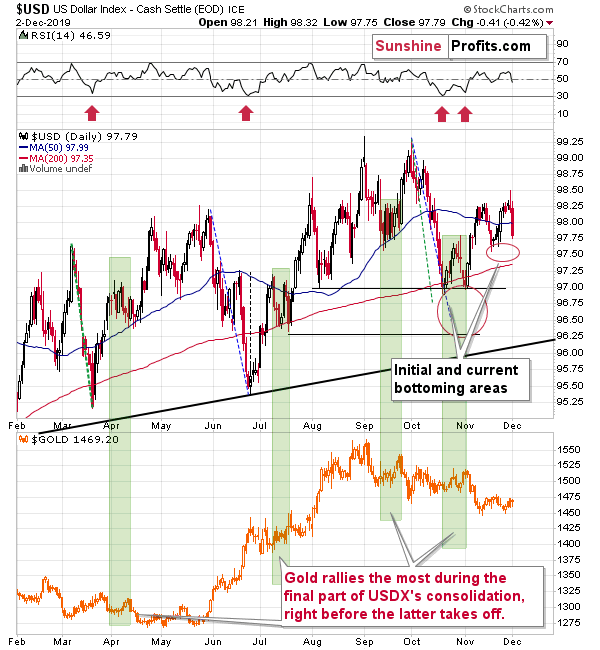
The first part of December 2019 is likely to be characterized by not only a "surprising" turnaround in the gold price, but also by a reversal in the USD Index.
We previously wrote that the USD Index was likely to move lower once again before turning up and that this final part of the decline would likely trigger a rally in the yellow metal. Quoting our November 25 analysis:
The general rule for any market is that if it doesn't move in the way it "should" move given what's going on in the world, it means that - for whatever reason - it's not the direction in which the market is going to move next. This trading technique doesn't specify what is the reason for a given market's strength. The point is to detect and acknowledge this strength, and then to combine this information with other trading signals.
One of the biggest benefits of this approach is its widespread application. Knowing what is likely to move a given market and what kind of reaction would be normal, means that it can be applied - regardless of what the market is. It also applies to various terms, if one takes into consideration the likely time in which the effect of a given development "should" be in place. For instance, in case of long-term investment, one should pay attention to how the market reacts to the factors that matter in this time horizon, for instance demographics and shifts in supply & demand picture. In case of day trading, it's a matter of checking if a given individual piece of news (or price action from a key influencing market) causes a price move that seems natural. The bigger the divergence from what would be viewed as normal, the stronger the bullish or bearish signal becomes.
Moving back to the USD-gold picture, we previously wrote that the USD Index is quite likely to consolidate before rallying strongly and it seems that this consolidation is still taking place. The USDX didn't break to new November highs and Friday's rally is in tune with how the U.S. currency performed in case of previous consolidations that we marked in green.
Back and forth movement was common, and sometimes it took form of a day-to-day swings, and sometimes (such as in July and October), it meant two bottoms. There are no indications that would make Friday's upswing look any different than what we saw in October and July and thus it seems that we could easily see yet another downswing (perhaps to the recent lows) before the rally really picks up.
And what would gold be likely to do in such an environment? It would likely rally more visibly than it rallied recently - similarly to how it performed in the final parts of previous USDX consolidations. Despite today's few-dollar pre-market downswing, it seems that the top is not yet in and that gold will move higher shortly.
That's exactly what we saw yesterday and what we are witnessing today. We see yet another downswing (the USD Index is moving toward the recent lows), which suggests that gold is going to move higher in the short term. This confirms our earlier points.
All in all, it seems that as far as December 2019 is concerned, gold price is going to rally initially and then decline, probably much more than it had rallied. Gold might bounce back up before the end of the year, but not before declining first.
The Full View of Gold
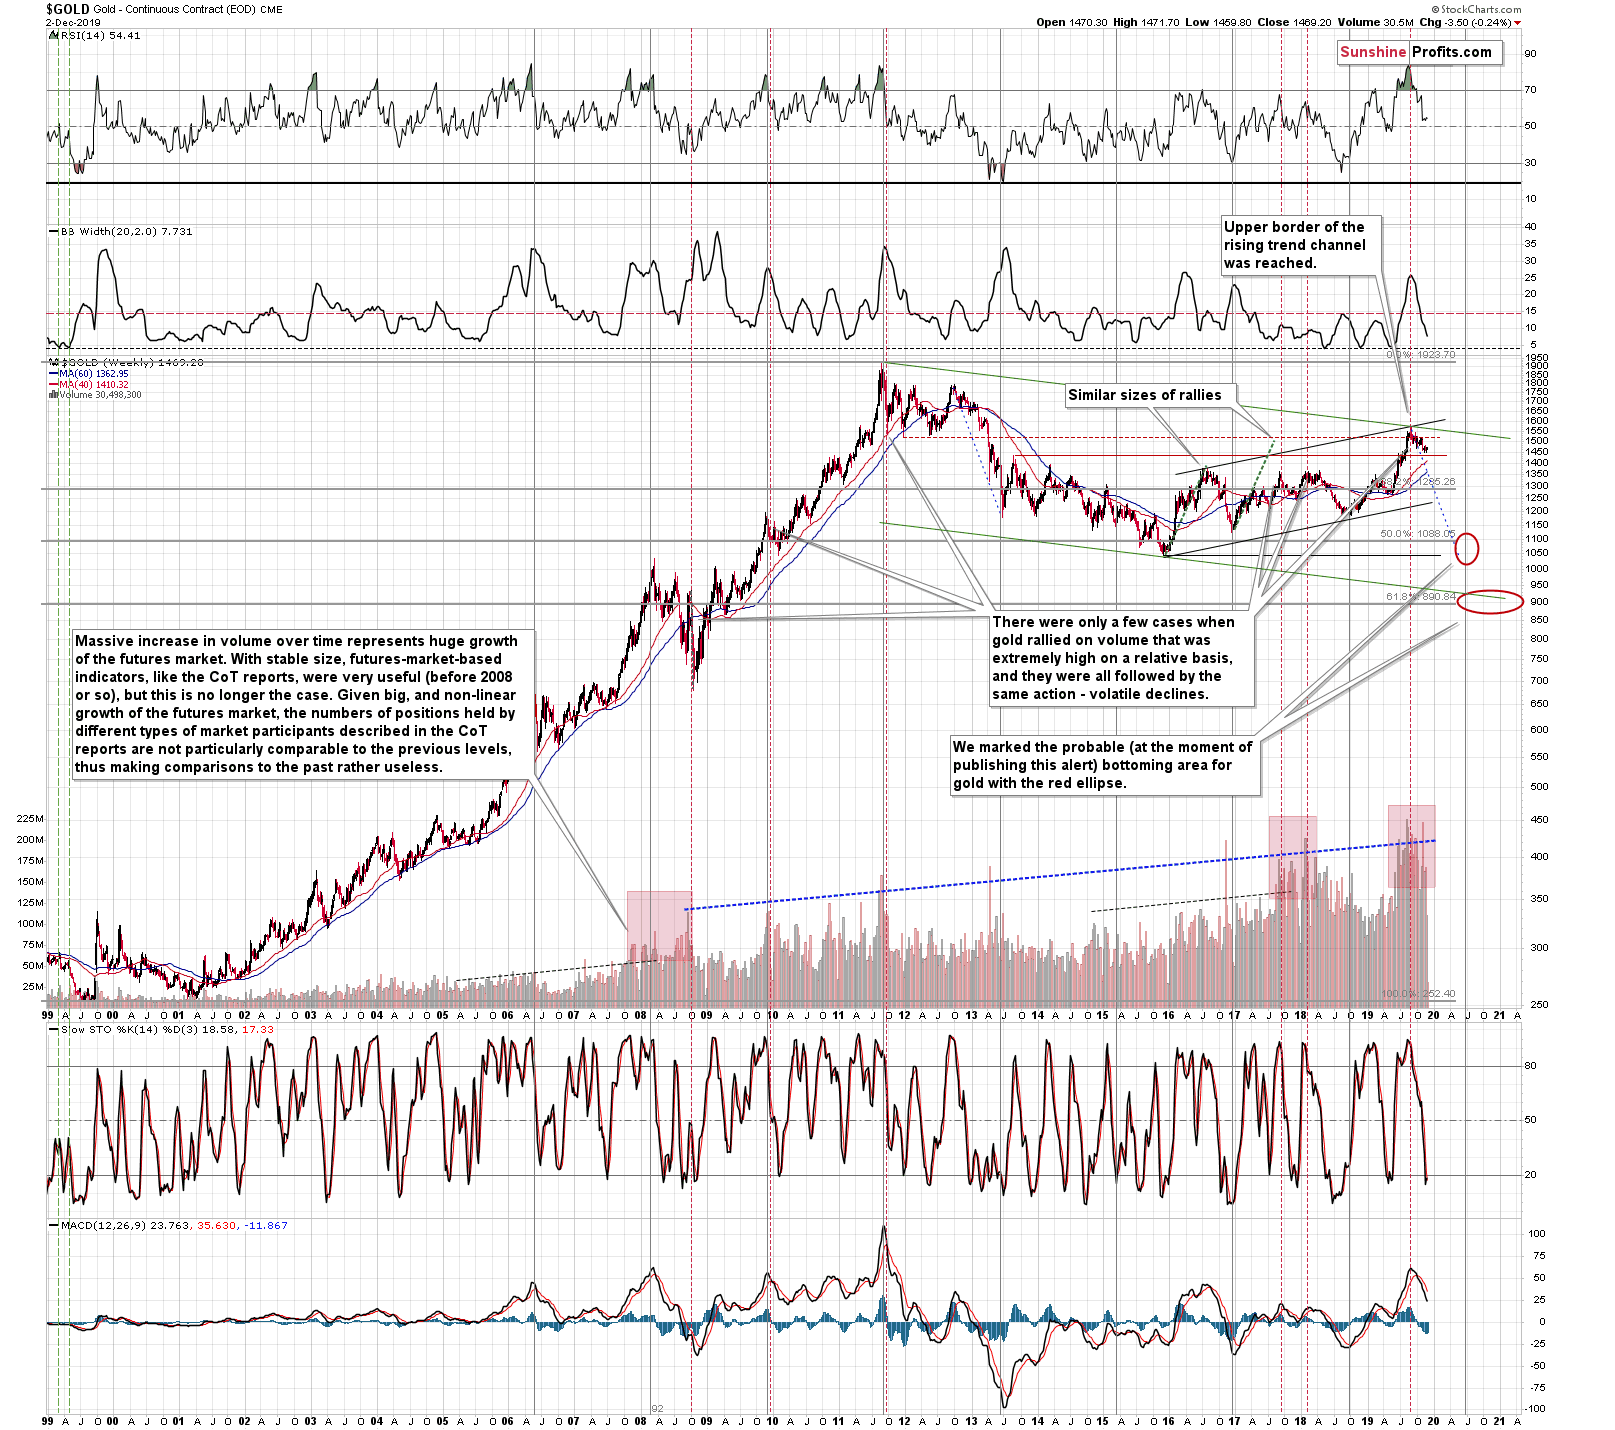
Taking a broader point of view, the gold price decline has only begun. Gold failed to break above the late 2011 and mid-2012 lows on a sustainable basis. The small move above these levels was quickly invalidated as gold reversed on huge volume.
In fact, volume-wise, the situation is currently similar to what we saw in 2008 and 2018 before gold's declines. The increase in volume looks encouraging, but it really isn't. And by increase in volume, we mean the relative increase in volume that is above the average growth that can be explained by the increased popularity of the derivatives market.
There are several indicators visible on the above gold price chart - let's check what they are telling us.
First from the top is the RSI indicator - it's currently not flashing any signal, but it shows that the previous rally took gold to the red-hot emotionality levels, as the indicator moved well above its 70 line. Normally, reaching it means that a market is already overbought - gold was more overbought than that. The last time when it was similarly overbought was at the 2011 top.
The second indicator from the top is the Rate of Change indicator. It shows that gold's volatility is declining. That's certainly true - after a volatile rally, gold is taking a breather as investors are still figuring out what really happened. The lower the volatility before the move, the further gold can then move as the volatility again increases. Gold is not yet at its record volatility lows, but getting close to them and fast. It looks like the next big move is getting closer.
The second indicator from the bottom is the Stochastic indicator. It just flashed a buy signal, but the reliability of these signals is debatable, especially given that gold is still relatively close to its medium-term (August) top. Yes, the buy signals from Stochastic confirmed many bottoms. However, it's also true that there were cases when there were false buy signals before major declines.
The problem here is that these false buy signals took place in 2018 and 2008 - the two times that are so similar to the current situation volume-wise. Even though there were many times when the Stochastic indicator worked very well at detecting tops and bottoms, it seems that these two cases and their implications are more important.
Finally, we have the MACD indicator which is after a major sell signal. There were only several cases when we saw such clear sell signals from this indicator: the 2016 top, the 2011 top, the 2008 top, and the 2006 top. They were all followed by declines that were much bigger than what we've seen since August. That's one of the multiple reasons to think that despite the bullish outlook for the very short term, gold is going to - on average - decline in the following months.
Naturally, the key bearish factors for the medium term remain intact.
Key Factors to Keep in Mind
Critical factors:
- The USD Index broke above the very long-term resistance line and verified the breakout above it. Its huge upswing is already underway.
- The USD's long-term upswing is an extremely important and bearish factor for gold. There were only two similar cases in the past few decades, when USD Index was starting profound, long-term bull markets, and they were both accompanied by huge declines in gold and the rest of the precious metals market
- Out of these two similar cases, only one is very similar - the case when gold topped in February 1996. The similarity extends beyond gold's about a yearly delay in reaction to the USD's rally. Also the shape of gold price moves prior to the 1996 high and what we saw in the last couple of years is very similar, which confirm the analysis of the gold-USD link and the above-mentioned implications of USD Index's long-term breakout.
- The similarity between now and 1996 extends to silver and mining stocks - in other words, it goes beyond USD, gold-USD link, and gold itself. The white metal and its miners appear to be in a similar position as well, and the implications are particularly bearish for the miners. After their 1996 top, they erased more than 2/3rds of their prices.
- Many investors got excited by the gold-is-soaring theme in the last few months, but looking beyond the short-term moves, reveals that most of the precious metals sector didn't show substantial strength that would be really visible from the long-term perspective. Gold doesn't appear to be starting a new bull market here, but rather to be an exception from the rule.
- Gold stocks appear to be repeating their performance from 20 years ago, which means that a bottom in the entire precious metals sector is quite likely to form at much lower prices, in about a year
Very important, but not as critical factors:
- Long-term technical signs for silver, i.a. the analogy in terms of price to what we saw in 2008, shows that silver could slide even below $10.
- Silver's very long-term cycles point to a major reversal taking place right now and since the most recent move was up, the implications are bearish (this is also silver's technical sign, but it's so important that it deserves its own point)
- Long-term technical signs for gold stocks point to this not being a new gold bull market beginning. Among others, it's their long-term underperformance relative to gold that hint this is rather a corrective upswing within a bear market that is not over yet.
- Record-breaking weekly volume in gold is a strong sign pointing to lower gold prices
Important factors:
- Extreme volume reading in the SIL ETF (proxy for silver stocks) is an effective indication that lower values of silver miners are to be expected
- Silver's short-term outperformance of gold, and gold stocks' short-term underperformance of gold both confirm that the precious metals sector is topping here
- Gold topped almost right at its cyclical turning point, which makes the trend reversal more likely
- Copper broke below its head-and-shoulders pattern and confirmed the breakdown. The last time we saw something similar was in April 2013, when the entire precious metals sector was on the verge of plunging lower.
Moreover, please note that while there may be a recession threat, it doesn't mean that gold has to rally immediately. Both: recession and gold's multi-year rally could be many months away - comparing what happened to bond yields in the 90s confirms that.
Summary
Summing up, the outlook for the precious metals sector remains very bearish for the following months (also because of the record volume and open interest in gold), but it seems that we will first see a short-term upswing before the decline continues. Based on what we saw in the last few days, the bullish outlook remains justified. It seems that the profits on our long positions will become bigger before we close it. We expect to close the long position later this week. Then, we plan to open a short position shortly thereafter.
As always, we'll keep you - our subscribers - informed.
To summarize:
Trading capital (supplementary part of the portfolio; our opinion): Small speculative long position (50% of the full position) in gold, silver, and mining stocks is justified from the risk/reward perspective with the following stop-loss orders and binding exit profit-take price levels:
- Gold: profit-take exit price: $1,489.80; stop-loss: $1,437; initial target price for the UGLD ETN: $135.88; stop-loss for the UGLD ETN: $122.10
- Silver: profit-take exit price: $17.47; stop-loss: $16.27; initial target price for the USLV ETN: $89.33; stop-loss for the USLV ETN: $72.44
- Mining stocks (price levels for the GDX ETF): profit-take exit price: $27.88; stop-loss: $25.47; initial target price for the NUGT ETF: $30.27; stop-loss for the NUGT ETF $23.08
In case one wants to bet on junior mining stocks' prices, here are the stop-loss details and target prices:
- GDXJ ETF: profit-take exit price: $39.27; stop-loss: $35.38
- JNUG ETF: profit-take exit price: $67.97; stop-loss: $49.83
Long-term capital (core part of the portfolio; our opinion): No positions (in other words: cash)
Insurance capital (core part of the portfolio; our opinion): Full position
Whether you already subscribed or not, we encourage you to find out how to make the most of our alerts and read our replies to the most common alert-and-gold-trading-related-questions.
Please note that the in the trading section we describe the situation for the day that the alert is posted. In other words, it we are writing about a speculative position, it means that it is up-to-date on the day it was posted. We are also featuring the initial target prices, so that you can decide whether keeping a position on a given day is something that is in tune with your approach (some moves are too small for medium-term traders and some might appear too big for day-traders).
Plus, you might want to read why our stop-loss orders are usually relatively far from the current price.
Please note that a full position doesn't mean using all of the capital for a given trade. You will find details on our thoughts on gold portfolio structuring in the Key Insights section on our website.
As a reminder - "initial target price" means exactly that - an "initial" one, it's not a price level at which we suggest closing positions. If this becomes the case (like it did in the previous trade) we will refer to these levels as levels of exit orders (exactly as we've done previously). Stop-loss levels, however, are naturally not "initial", but something that, in our opinion, might be entered as an order.
Since it is impossible to synchronize target prices and stop-loss levels for all the ETFs and ETNs with the main markets that we provide these levels for (gold, silver and mining stocks - the GDX ETF), the stop-loss levels and target prices for other ETNs and ETF (among other: UGLD, DGLD, USLV, DSLV, NUGT, DUST, JNUG, JDST) are provided as supplementary, and not as "final". This means that if a stop-loss or a target level is reached for any of the "additional instruments" (DGLD for instance), but not for the "main instrument" (gold in this case), we will view positions in both gold and DGLD as still open and the stop-loss for DGLD would have to be moved lower. On the other hand, if gold moves to a stop-loss level but DGLD doesn't, then we will view both positions (in gold and DGLD) as closed. In other words, since it's not possible to be 100% certain that each related instrument moves to a given level when the underlying instrument does, we can't provide levels that would be binding. The levels that we do provide are our best estimate of the levels that will correspond to the levels in the underlying assets, but it will be the underlying assets that one will need to focus on regarding the signs pointing to closing a given position or keeping it open. We might adjust the levels in the "additional instruments" without adjusting the levels in the "main instruments", which will simply mean that we have improved our estimation of these levels, not that we changed our outlook on the markets. We are already working on a tool that would update these levels on a daily basis for the most popular ETFs, ETNs and individual mining stocks.
Our preferred ways to invest in and to trade gold along with the reasoning can be found in the how to buy gold section. Additionally, our preferred ETFs and ETNs can be found in our Gold & Silver ETF Ranking.
As a reminder, Gold & Silver Trading Alerts are posted before or on each trading day (we usually post them before the opening bell, but we don't promise doing that each day). If there's anything urgent, we will send you an additional small alert before posting the main one.
=====
Latest Free Trading Alerts:
The ISM Manufacturing index fell 0.2 point to a reading of 48.1 in November. However, gold struggles to find momentum. What is going on exactly?
Manufacturing Goes Deeper Into Recession, Yet Gold Remains Muted. Why?
=====
Thank you.
Sincerely,
Przemyslaw Radomski, CFA
Editor-in-chief, Gold & Silver Fund Manager

