

Briefly: in our opinion, full (250% of the regular size of the position) speculative short position in gold, silver, and mining stocks is justified from the risk/reward point of view at the moment of publishing this Alert.
Yesterday's second most interesting news was Fed's interest rate decision. The crown goes to Fed's indication of a pause in the rate declines. It doesn't mean that much, of course, as Powell made it clear that if new risks or data start to require a rate cut, they will cut. Still, lower rates became a little less probable based on the above. What did it really change?
The long-term bond yield chart shows that yesterday's news was no news at all, because the market has already determined that the long-term rates have bottomed earlier this year - in late August. Yesterday's announcement was just a confirmation of the less dovish tone.
Bond Yields, Rates and Gold
The 30-year bond yields are rising back up after a huge slide. The true implications have been visible on the above chart for quite a few weeks and in light of yesterday's announcement, they remain up-to-date.
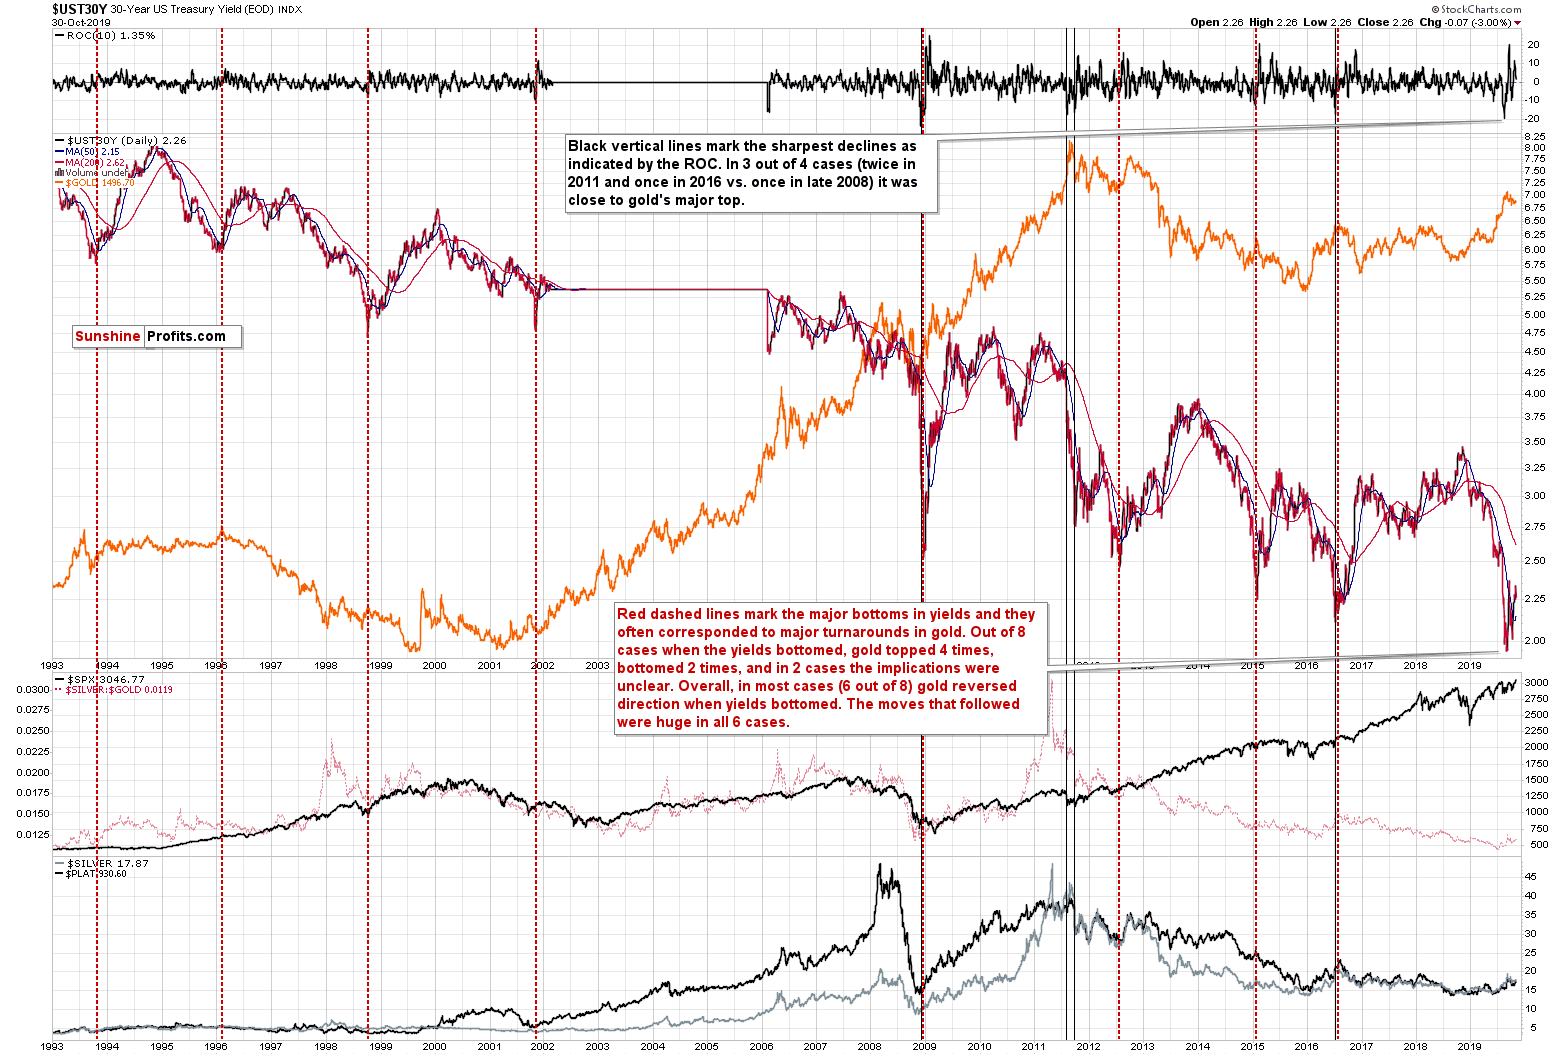
Despite the very long-term downtrend in the rates, there is a certain cyclicality in their medium-term moves. There are sharp declines, but also big rallies. What is interesting from our (gold & silver investors' and traders') point of view, is how gold performs after major bottoms in the rates, as it's quite clear now that the bottom is already in.
Let's take a look at the chart for details. The red dashed lines mark the major bottoms in yields and they often corresponded to major turnarounds in gold. Out of 8 cases when the yields bottomed, gold topped 4 times, bottomed 2 times, and in 2 cases the implications were unclear. Overall, in most cases (6 out of 8) gold reversed direction when yields bottomed. The moves that followed were huge in all 6 cases.
When yields were dropping in the first half of the year, gold was rallying in a decisive manner. This means that the above-mentioned 6 out of 8 statistic has very bearish implications. Reversing course after a rally means declines. Indeed, just as bond yields bottomed in late August, gold topped and it's been declining since that time. The decline is not profound so far, but let's keep the second part of the above-mentioned statistic in mind. Namely, that the gold price moves that followed yield bottoms were all huge. This means that the current decline in gold is likely to become much bigger before it's over.
Another determinant of gold price moves - the USD Index - also points to much lower gold prices in the following months. We haven't featured the USD chart recently as there were barely any changes in the USD's outlook, but it's important to remember this key factor.
The USD Index Keeps Rising Overall
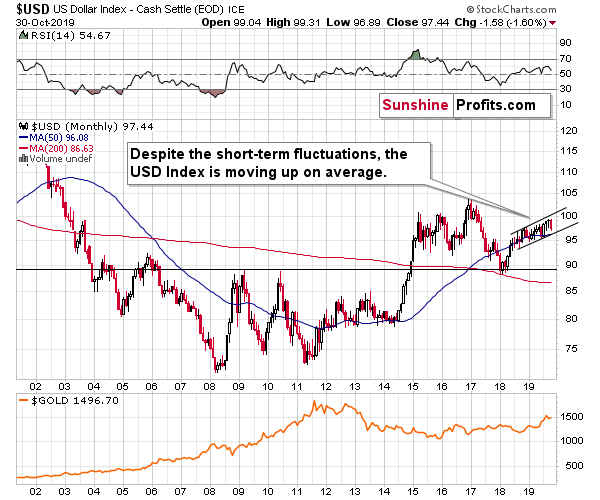
It's a matter of fact that on average, the USD Index keeps moving higher despite the short-term fluctuations. In the last 18 months or so, we saw higher highs and higher lows, which is the very definition of an uptrend. And it all happened despite the dramatic change in the Fed's approach and the following rate cuts. This confirms the strength of the USD bull market.
The USDX is moving lower today, but it doesn't change the above bearish implications the USDX continues to have on the PM market.
While we're in the long-term part of the analysis, it seems worth recalling gold stocks' big picture.
And These Are Gold Stocks Overall
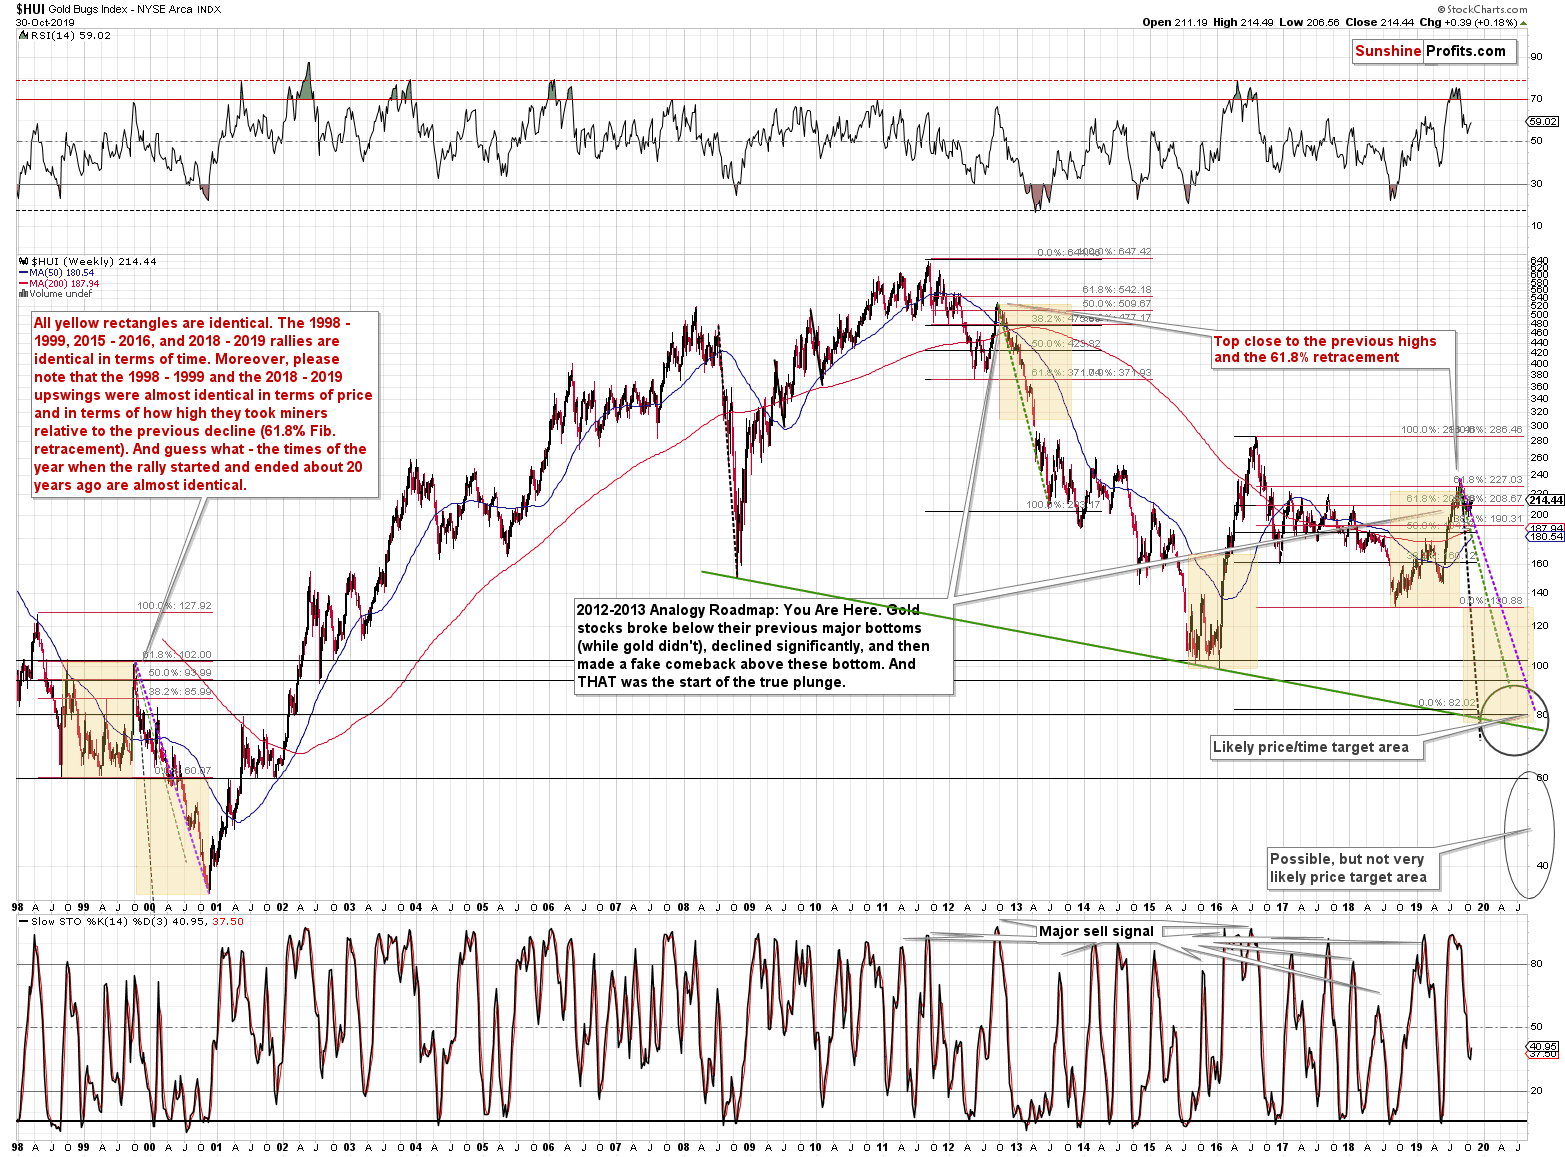
We thoroughly described the above HUI Index picture about two weeks ago, and if you haven't read that analysis, we strongly encourage you to examine it today. We don't want to repeat the entire chart description here, but there's one factor that is very much worth commenting on.
The purple dashed line represents the 1999 - 2000 decline. It was the least sharp of the huge declines. Generally, whenever gold stocks moved above this line, it meant that the counter-trend rally was ending and mining stock prices were about to collapse and move either to or below the line.
Given today's pre-market upswing in gold (about $8), gold stocks are likely to move even higher on a very short-term basis. In light of the analogy to the previous decline, it seems that it shouldn't be taken at its face (bullish) value, but instead viewed as a slingshot that's pulled back to shoot really far in the opposite direction.
This is especially the case since today is the final day of October and tomorrow is the first day of November. This is not important per se, but very important given the triangle-vertex-based reversals that we can see in gold, silver, and the HUI Index on the below short-term chart.
Precious Metals Yesterday
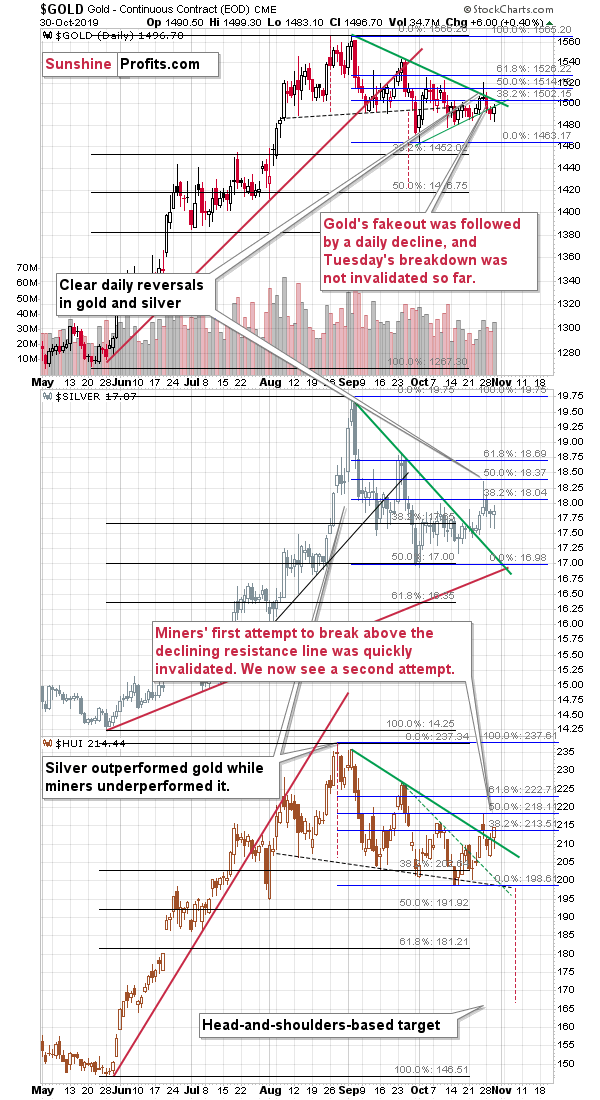
The resistance and support lines cross more or less tomorrow, so its seems likely that prices will reverse shortly. Given today's pre-market upswing in gold and silver (we don't have mining stock data yet), it's clear that the moves that precede the reversal date is up. This means that the triple reversal in gold, silver, and the HUI is likely to be a top. Consequently, we can expect the decline to resume shortly - most likely next week, or perhaps even tomorrow. This also means that tomorrow's session could be volatile (especially given the employment numbers' release) - if it is, please note that it would fall into the "normal" category given both: the news release, and the triple reversal date.
Naturally, the possibility of seeing increased volatility doesn't have to mean higher prices in the near term. It could mean that the decline starts right away and is volatile (big) on its own. That's why we are not adjusting our trading positions here (the downside potential is much greater than the upside).
Naturally, the other key bearish factors for the medium term remain intact.
Key Factors to Keep in Mind
Critical factors:
- The USD Index broke above the very long-term resistance line and verified the breakout above it. Its huge upswing is already underway.
- The USD's long-term upswing is an extremely important and bearish factor for gold. There were only two similar cases in the past few decades, when USD Index was starting profound, long-term bull markets, and they were both accompanied by huge declines in gold and the rest of the precious metals market
- Out of these two similar cases, only one is very similar - the case when gold topped in February 1996. The similarity extends beyond gold's about a yearly delay in reaction to the USD's rally. Also the shape of gold price moves prior to the 1996 high and what we saw in the last couple of years is very similar, which confirm the analysis of the gold-USD link and the above-mentioned implications of USD Index's long-term breakout.
- The similarity between now and 1996 extends to silver and mining stocks - in other words, it goes beyond USD, gold-USD link, and gold itself. The white metal and its miners appear to be in a similar position as well, and the implications are particularly bearish for the miners. After their 1996 top, they erased more than 2/3rds of their prices.
- Many investors got excited by the gold-is-soaring theme in the last few months, but looking beyond the short-term moves, reveals that most of the precious metals sector didn't show substantial strength that would be really visible from the long-term perspective. Gold doesn't appear to be starting a new bull market here, but rather to be an exception from the rule.
- Gold stocks appear to be repeating their performance from 20 years ago, which means that a bottom in the entire precious metals sector is quite likely to form at much lower prices, in about a year
Very important, but not as critical factors:
- Long-term technical signs for silver, i.a. the analogy in terms of price to what we saw in 2008, shows that silver could slide even below $10.
- Silver's very long-term cycles point to a major reversal taking place right now and since the most recent move was up, the implications are bearish (this is also silver's technical sign, but it's so important that it deserves its own point)
- Long-term technical signs for gold stocks point to this not being a new gold bull market beginning. Among others, it's their long-term underperformance relative to gold that hint this is rather a corrective upswing within a bear market that is not over yet.
- Record-breaking weekly volume in gold is a strong sign pointing to lower gold prices
Important factors:
- Extreme volume reading in the SIL ETF (proxy for silver stocks) is an effective indication that lower values of silver miners are to be expected
- Silver's short-term outperformance of gold, and gold stocks' short-term underperformance of gold both confirm that the precious metals sector is topping here
- Gold topped almost right at its cyclical turning point, which makes the trend reversal more likely
- Copper broke below its head-and-shoulders pattern and confirmed the breakdown. The last time we saw something similar was in April 2013, when the entire precious metals sector was on the verge of plunging lower.
Moreover, please note that while there may be a recession threat, it doesn't mean that gold has to rally immediately. Both: recession and gold's multi-year rally could be many months away - comparing what happened to bond yields in the 90s confirms that.
Summary
Summing up, the outlook for the precious metals sector remains very bearish for the following weeks and months and given the looming triple reversal and the very recent upswing, it seems that the big decline will resume shortly (perhaps as early as next week). Myriads of factors point to much lower precious metals prices, so regardless of what happens in the next few days, their prices are likely to slide in the following weeks and months.
The similarity to how gold stocks rallied and then declined about 20 years ago provides us with a specific time target for the decline in the entire precious metals sector - it's likely to take place close to October 2020. That may seem like a very long wait, but let's keep in mind that the road lower that gold, silver, and miners are likely to take is not short either. The profits from the short position in gold, silver and mining stocks are likely to be legendary, but the difficult part is not to miss the decline. Fortunately, the slide's pace that we saw 20 years ago provides suggestions regarding when it might be worth to bet on the corrective upswing with one's trading capital and when it's better to wait it out. Based on the analogy to the above-mentioned decline, the next medium-term bottom might take place in mid-December.
On an administrative note: due to our travel plans, there will be no regular Trading Alerts, including Gold & Silver Trading Alerts tomorrow (of course, in case of major changes, you'll receive a quick text note on your e-mail). All Alerts will be back normally on Monday.
As always, we'll keep you - our subscribers - informed.
To summarize:
Trading capital (supplementary part of the portfolio; our opinion): F speculative short position (250% of the full position) in gold, silver, and mining stocks are justified from the risk/reward perspective with the following stop-loss orders and binding exit profit-take price levels:
- Gold: profit-take exit price: $1,391; stop-loss: $1,573; initial target price for the DGLD ETN: $36.37; stop-loss for the DGLD ETN: $25.44
- Silver: profit-take exit price: $15.11; stop-loss: $19.06; initial target price for the DSLV ETN: $24.88; stop-loss for the DSLV ETN: $14.07
- Mining stocks (price levels for the GDX ETF): profit-take exit price: $23.21; stop-loss: $30.11; initial target price for the DUST ETF: $14.69; stop-loss for the DUST ETF $6.08
In case one wants to bet on junior mining stocks' prices, here are the stop-loss details and target prices:
- GDXJ ETF: profit-take exit price: $30.32; stop-loss: $41.22
- JDST ETF: profit-take exit price: $35.88 stop-loss: $12.46
Long-term capital (core part of the portfolio; our opinion): No positions (in other words: cash)
Insurance capital (core part of the portfolio; our opinion): Full position
Whether you already subscribed or not, we encourage you to find out how to make the most of our alerts and read our replies to the most common alert-and-gold-trading-related-questions.
Please note that the in the trading section we describe the situation for the day that the alert is posted. In other words, it we are writing about a speculative position, it means that it is up-to-date on the day it was posted. We are also featuring the initial target prices, so that you can decide whether keeping a position on a given day is something that is in tune with your approach (some moves are too small for medium-term traders and some might appear too big for day-traders).
Plus, you might want to read why our stop-loss orders are usually relatively far from the current price.
Please note that a full position doesn't mean using all of the capital for a given trade. You will find details on our thoughts on gold portfolio structuring in the Key Insights section on our website.
As a reminder - "initial target price" means exactly that - an "initial" one, it's not a price level at which we suggest closing positions. If this becomes the case (like it did in the previous trade) we will refer to these levels as levels of exit orders (exactly as we've done previously). Stop-loss levels, however, are naturally not "initial", but something that, in our opinion, might be entered as an order.
Since it is impossible to synchronize target prices and stop-loss levels for all the ETFs and ETNs with the main markets that we provide these levels for (gold, silver and mining stocks - the GDX ETF), the stop-loss levels and target prices for other ETNs and ETF (among other: UGLD, DGLD, USLV, DSLV, NUGT, DUST, JNUG, JDST) are provided as supplementary, and not as "final". This means that if a stop-loss or a target level is reached for any of the "additional instruments" (DGLD for instance), but not for the "main instrument" (gold in this case), we will view positions in both gold and DGLD as still open and the stop-loss for DGLD would have to be moved lower. On the other hand, if gold moves to a stop-loss level but DGLD doesn't, then we will view both positions (in gold and DGLD) as closed. In other words, since it's not possible to be 100% certain that each related instrument moves to a given level when the underlying instrument does, we can't provide levels that would be binding. The levels that we do provide are our best estimate of the levels that will correspond to the levels in the underlying assets, but it will be the underlying assets that one will need to focus on regarding the signs pointing to closing a given position or keeping it open. We might adjust the levels in the "additional instruments" without adjusting the levels in the "main instruments", which will simply mean that we have improved our estimation of these levels, not that we changed our outlook on the markets. We are already working on a tool that would update these levels on a daily basis for the most popular ETFs, ETNs and individual mining stocks.
Our preferred ways to invest in and to trade gold along with the reasoning can be found in the how to buy gold section. Additionally, our preferred ETFs and ETNs can be found in our Gold & Silver ETF Ranking.
As a reminder, Gold & Silver Trading Alerts are posted before or on each trading day (we usually post them before the opening bell, but we don't promise doing that each day). If there's anything urgent, we will send you an additional small alert before posting the main one.
Thank you.
Sincerely,
Przemyslaw Radomski, CFA
Editor-in-chief, Gold & Silver Fund Manager

