

Briefly: in our opinion, full (250% of the regular size of the position) speculative short position in gold, silver, and mining stocks is justified from the risk/reward point of view at the moment of publishing this Alert.
Friday's session was exceptional for several reasons and the most profound ones are gold's and silver's sizable intraday rally, and the subsequent slide. The reversals that both metals created are practically screaming signs pointing to what's next. The way mining stocks behaved, and how gold closed relative to its previous tops also have important implications, but let's start today's analysis with the former.
Silver, the less valuable (at least so far) of the most popular precious metals and many small investors' metal of choice, reversed in a particularly meaningful way.
Friday's PMs Reversals
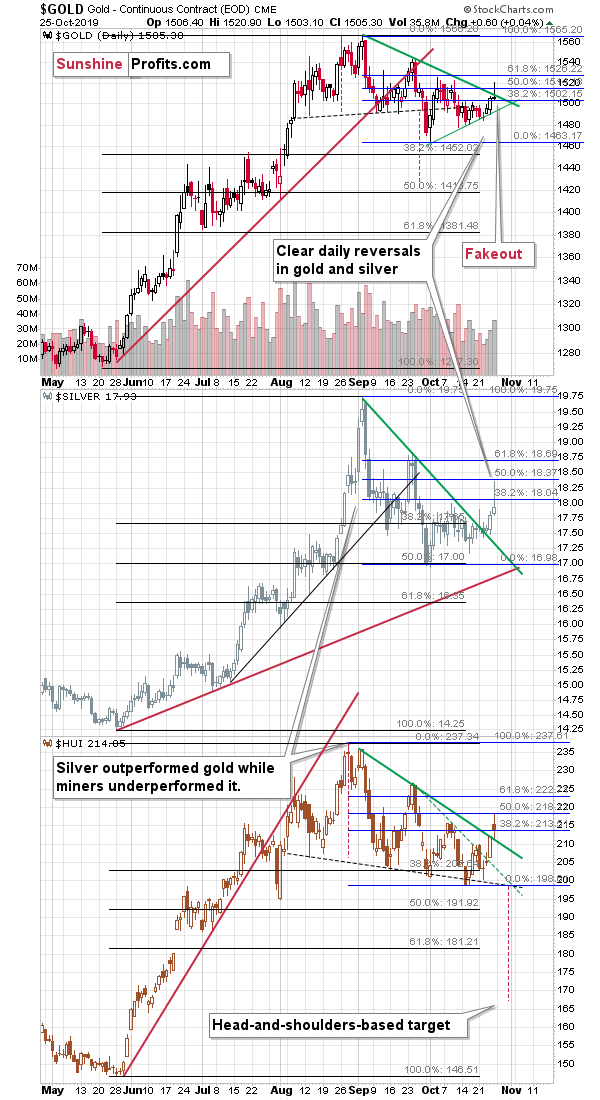
All three parts of the precious metals sector: gold, silver, and mining stocks (HUI is a proxy for gold stocks) moved to or above their respective 50% Fibonacci retracements based on the September - October declines, but only silver closed visibly below the 38.2% retracement. That's one of the reasons why silver's reversal was so important. Silver simply moved up and down the most. That's far from it all, though. The big deal about this reversal is how similar it is to what silver has done in the previous years after similar reversals.
You see, silver is known to rally very high and outperform gold and mining stocks right before or while forming a top (often creating a fake breakout a.k.a. fakeout), but it doesn't necessarily happen on one day. Silver might rally for a day or a few days, when gold and miners are not doing much, or simply visibly less than silver. At times, the above and the subsequent slide take place during the same trading day, but it is not very common. This means that such sessions are relatively easy to find among other days simply because they stand out.
We won't be able to provide you with a complete list of silver's profound daily reversals, but we will feature some of them that should make you think at least twice before viewing the initial "strength" in the white metal as being anything close to bullish.
Let's start the silver time machine and set it back to about three years ago. Whoosh!
The Power of Silver's Reversals
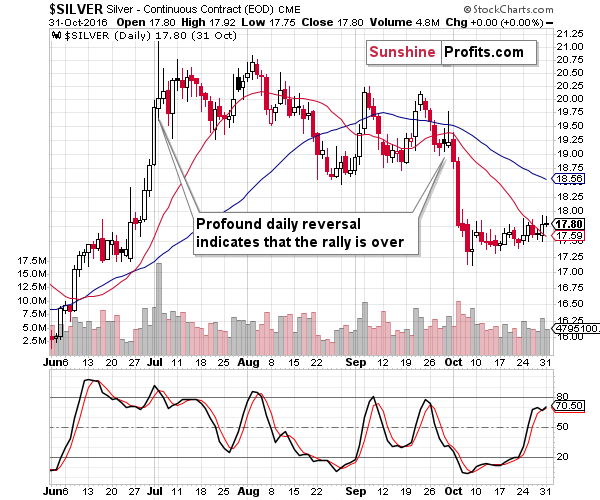
We're now in the second half of 2016. Precisely, at the beginning of July. Silver just soared several dollars, but it reversed some of its daily gains. All silver analysts are cheering as silver ended the session higher than the previous one, and the white metal gained a bit more on the following day. That was true, but the perceived - bullish - implications were entirely off. Silver had just reversed and that intraday high turned out to be the yearly high.
Before declining in the most profound way (in October), silver flashed the daily reversal once again, at the end of September. One could say that the mid-August session was also a daily reversal, which also had bearish implications for the following days and weeks.
Based on what happened in 2016, it seems that silver's daily reversals should at least raise an eyebrow.
Let's get back to the time machine. This time, we're setting it to 2013. Whoosh!
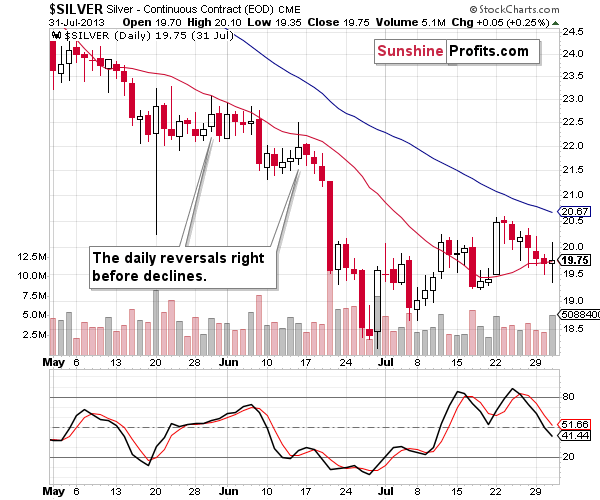
It's mid-June 2013, and silver is after a steady decline. It just moved almost a full dollar higher during just one day, but it gave away most of these gains before the session was over. The following session opened a bit higher, but silver closed the day lower. And it declined on the next day. And the next one too. And then silver plunged almost $2 in just one day, only to decline some more in the following days. And it all started with the daily reversal.
The take-away is that silver's daily reversals might be worth more than just a raised eyebrow.
The time machine still has some fuel left. Let's get back one additional year. Whoosh!
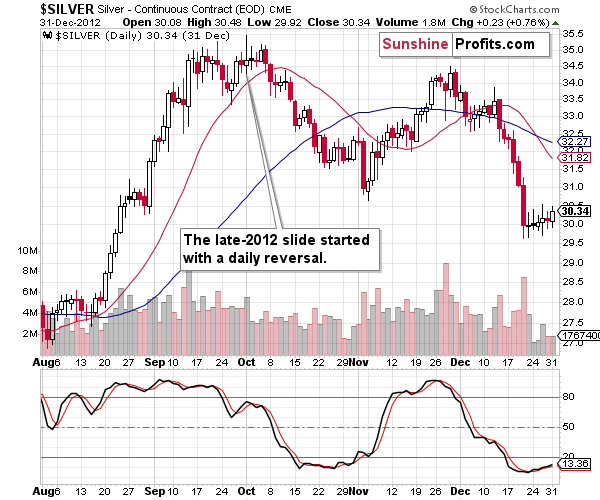
It's the first day of October 2012 and silver just rallied to new highs, after rising about $12 in less than 2 months. Silver didn't manage to hold these intraday gains, and closed the day only a bit higher. The outlook seemed quite optimistic. But in reality, it was very, very, very far from that. The daily reversal marked the end of the volatile counter-trend rally, and started the decline that continued for years (in fact, the odds are that this medium-term downswing continues up to this day). In other words, since the first day of October 2012, we haven't seen silver prices at higher levels.
All in all, silver's daily reversals should do much more than just raise both of one's eyebrows, especially when they take place in October. They should make investors prepare for much lower silver prices - if not immediately, then relatively shortly. And we have just seen a profound daily silver reversal on Friday.
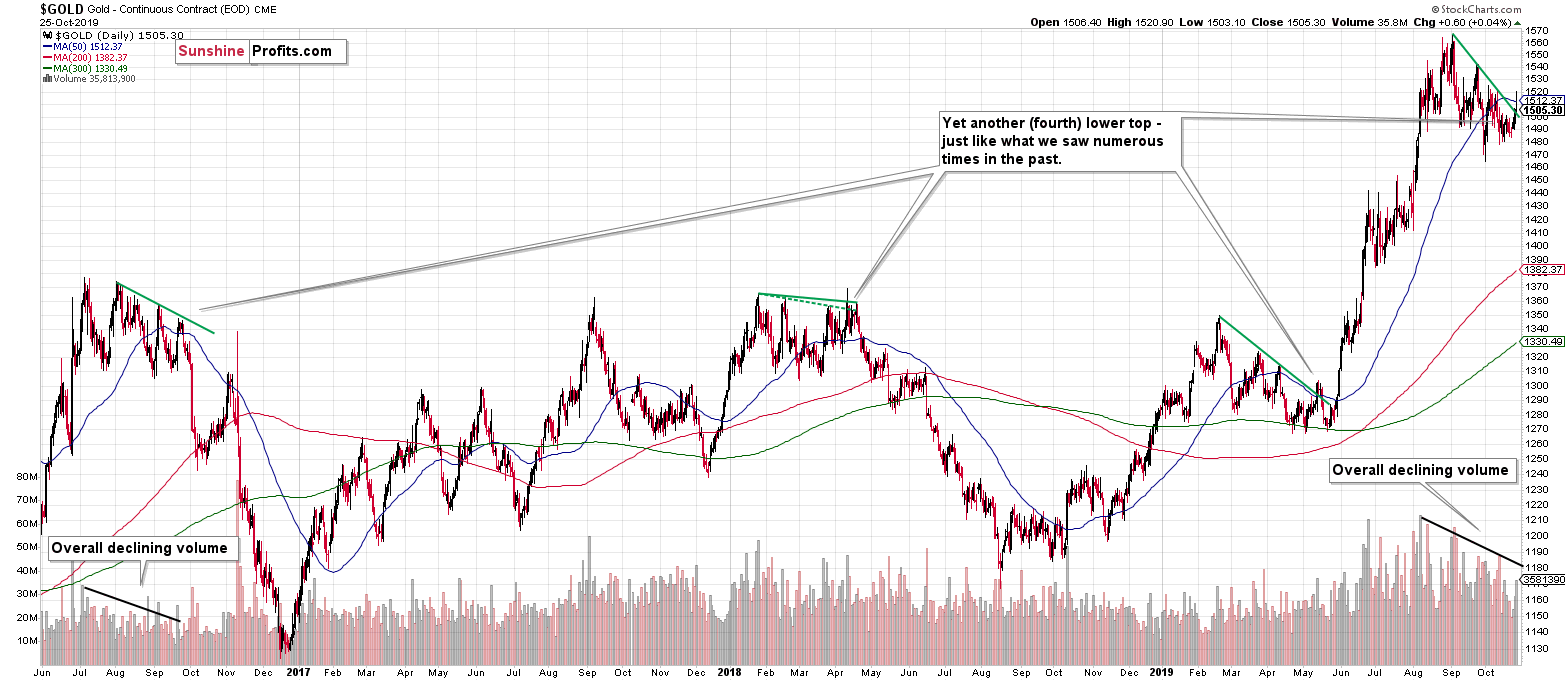
Ok, but silver was not the only part of the precious metals market that reversed on Friday. Gold's reversal is also particularly important, because of the resistance line that gold tried to break. It tried, but it failed, and the quick rally above it was reversed even faster. The invalidation of a breakout is a strong sell sign for the short term.
Moreover, please note that during the intraday rally, gold moved a bit above the 50-day moving average, which make this topping sequence very similar to the previous tops.
Gold's Reversal
In Friday's regular Gold & Silver Trading Alert, we wrote the following:
That's the fourth local top in a row and each of them formed lower than the previous one. This makes the current situation similar to what we saw in late 2016 and early 2019. In a way, it's also similar to what we saw in the first half of 2018. In 2016, gold plunged after the fourth top that formed at the declining resistance line. In May 2019, gold declined to the previous lows and then rallied, but still, the short-term decline came first. The first half of 2018 also marked the beginning of a major decline in gold that started at the fourth local top.
The implications of all these cases are bearish in the short term, but they are also mostly bearish for the following weeks and months. The current case seems most similar to what happened in late 2016 because of the time of the year, and because of the contracting volume. Gold's trading is likely to be choppy in October and that's exactly what we saw recently. The above similarity suggests that this choppiness is likely ending right now. Lower gold values are to be expected next.
The above remains up-to-date, but we would like to point out that in each of the previous three similar cases, gold moved at least a bit above its 50-day moving average before topping and moving lower. This analogy makes Friday's intraday rally even more bearish.
Gold stocks didn't erase their entire intraday rally and the HUI Index even moved to new monthly intraday high. Gold didn't, so shouldn't this kind of strength be viewed as bullish? Not necessarily. First of all, this was just a one-day event. Second, another important proxy for the mining stocks - the GDX ETF - doesn't confirm the bullish interpretation.
What About Gold Stocks?
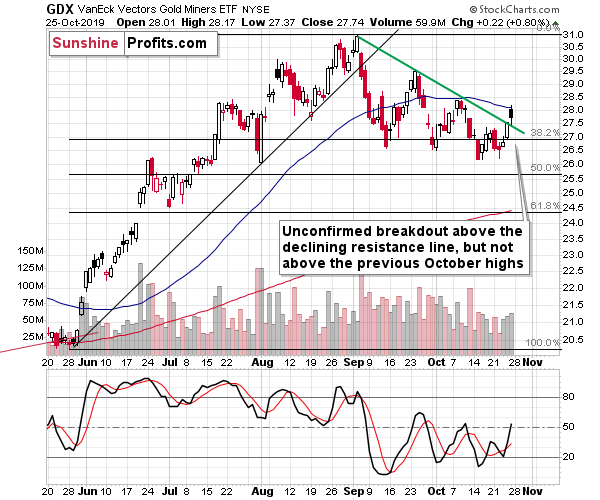
Unlike the HUI Index, the GDX ETF didn't move to new intraday high. Instead it moved to the 50-day moving average and then declined, just as it did earlier this month. Consequently, the indication of relative strength doesn't seem to be worth taking into account.
GDX broke above the declining resistance line, but this move is relatively small and not confirmed. If it closes above the line for two more consecutive days, the implications might be bullish, but they are not bullish at this time.
Before summarizing, let's take a look at gold from the European point of view.
Gold in European Currencies
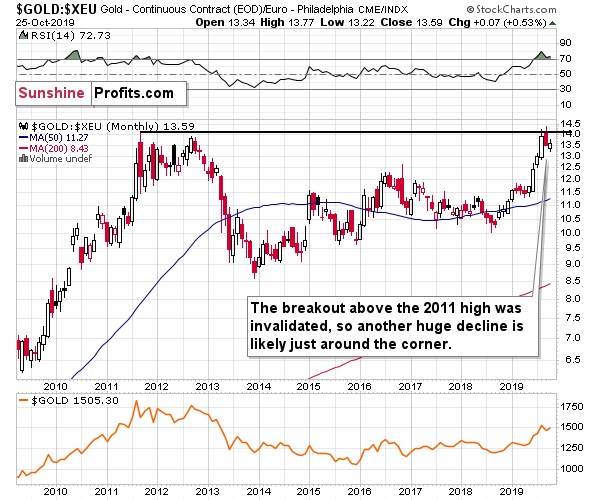
Gold priced in the euro moved a bit higher this month, but this move is relatively insignificant. It's only a bit more than half of a percent. It didn't change the implications of the September decline.
The September slide was important not only because it was the largest monthly decline of this year. It was crucial because during this month, gold broke above its 2011 high and then invalidated this move by closing well below it. Breakouts are signs of strength, but they are clear only after a given move is confirmed. Breakouts confirmation is necessary, because markets can move based on emotions that are so strong that the price gets way ahead of itself. This happens when buyers win over sellers despite the latter being stronger. Simply put, for a period of time, buyers are very determined to keep on buying, while the sellers are hesitating. This may cause the price to break above certain resistance levels that would normally remain unbroken.
This seems to have been the case with gold in terms of the euro. How can we tell that we saw this kind of reaction and not a true sign of strength? Because gold didn't manage to stay at the elevated levels for long. The emotional reactions can be very strong, but they are often temporary - just like the brightest flame that burns quickest. Once all was said and done, gold reversed and plunged back below the 2011 high. The price was not ready to break above this important level, proving that the buyers were not as strong as they appeared. They were only temporarily more determined.
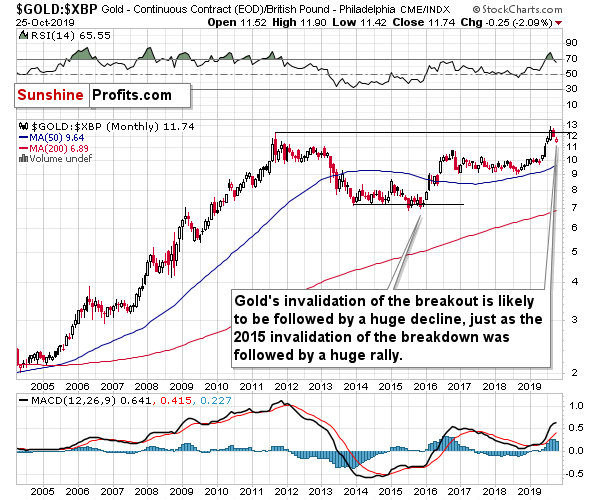
Those who use the British pound to buy gold reacted in the same way. The buyers' strength was enormous, but temporary. The failed attempt to break above the previous highs proved that the market is not yet ready for much higher prices.
The key point about these failed attempts is that after we see one, it's immediately obvious that the strength of a given market - here: gold - was much lower than it appeared. It is thus an immediate sell signal. In fact, invalidations of gold's (or silver's or miners') breakouts are one of the most clear bearish gold trading tips. The moves that we are discussing and the price extreme that was almost broken are both significant, so the weight of the sell signal is important as well.
What does it mean? It means that gold is likely to slide in the following months in terms of both the euro and the British pound. The odds are that if gold slides in terms of these two currencies, it will slide in terms of the U.S. dollar as well, quite likely to an even greater extent.
Naturally, the other key bearish factors for the medium term remain intact.
Key Factors to Keep in Mind
Critical factors:
- The USD Index broke above the very long-term resistance line and verified the breakout above it. Its huge upswing is already underway.
- The USD's long-term upswing is an extremely important and bearish factor for gold. There were only two similar cases in the past few decades, when USD Index was starting profound, long-term bull markets, and they were both accompanied by huge declines in gold and the rest of the precious metals market
- Out of these two similar cases, only one is very similar - the case when gold topped in February 1996. The similarity extends beyond gold's about a yearly delay in reaction to the USD's rally. Also the shape of gold price moves prior to the 1996 high and what we saw in the last couple of years is very similar, which confirm the analysis of the gold-USD link and the above-mentioned implications of USD Index's long-term breakout.
- The similarity between now and 1996 extends to silver and mining stocks - in other words, it goes beyond USD, gold-USD link, and gold itself. The white metal and its miners appear to be in a similar position as well, and the implications are particularly bearish for the miners. After their 1996 top, they erased more than 2/3rds of their prices.
- Many investors got excited by the gold-is-soaring theme in the last few months, but looking beyond the short-term moves, reveals that most of the precious metals sector didn't show substantial strength that would be really visible from the long-term perspective. Gold doesn't appear to be starting a new bull market here, but rather to be an exception from the rule.
- Gold stocks appear to be repeating their performance from 20 years ago, which means that a bottom in the entire precious metals sector is quite likely to form at much lower prices, in about a year
Very important, but not as critical factors:
- Long-term technical signs for silver, i.a. the analogy in terms of price to what we saw in 2008, shows that silver could slide even below $10.
- Silver's very long-term cycles point to a major reversal taking place right now and since the most recent move was up, the implications are bearish (this is also silver's technical sign, but it's so important that it deserves its own point)
- Long-term technical signs for gold stocks point to this not being a new gold bull market beginning. Among others, it's their long-term underperformance relative to gold that hint this is rather a corrective upswing within a bear market that is not over yet.
- Record-breaking weekly volume in gold is a strong sign pointing to lower gold prices
Important factors:
- Extreme volume reading in the SIL ETF (proxy for silver stocks) is an effective indication that lower values of silver miners are to be expected
- Silver's short-term outperformance of gold, and gold stocks' short-term underperformance of gold both confirm that the precious metals sector is topping here
- Gold topped almost right at its cyclical turning point, which makes the trend reversal more likely
- Copper broke below its head-and-shoulders pattern and confirmed the breakdown. The last time we saw something similar was in April 2013, when the entire precious metals sector was on the verge of plunging lower.
Moreover, please note that while there may be a recession threat, it doesn't mean that gold has to rally immediately. Both: recession and gold's multi-year rally could be many months away - comparing what happened to bond yields in the 90s confirms that.
Summary
Summing up, the outlook for the precious metals sector remains very bearish for the following weeks and months and while the short-term outlook remains bearish as well, there is a small chance that we'll see higher prices before the decline continues. The markets might continue to react emotionally to the Brexit-related turmoil and continue to re-live Draghi's gloomy speech. Based on the triple triangle-vertex-based reversals (visible on today's second chart), we might get another small rally (until early November) before the decline really picks up. Given relatively little potential of the possible (far from certain) rally and the huge potential of the very likely decline, it seems best to keep the current short positions intact.
The similarity to how gold stocks rallied and then declined about 20 years ago provides us with a specific time target for the decline in the entire precious metals sector - it's likely to take place for about 1 year from now. That's not particularly close, but the road lower that gold, silver, and miners are likely to take is not short either. The profits from the short position in gold, silver and mining stocks are likely to be legendary, but the difficult part is not to miss the decline. Fortunately, the slide's pace that we saw 20 years ago provides suggestions regarding when it might be worth to bet on the corrective upswing with one's trading capital and when it's better to wait it out. Based on the analogy to the above-mentioned decline, the next medium-term bottom might take place in mid-December. There are additional indications pointing to a short-term reversal in early November, but at this time it's unclear whether it will be a local top or a bottom. The above is justified also from the news point of view - this is the week when we're going to get Fed's interest rate decision, and Friday - the first day of November - is the day when we'll get the latest employment numbers.
As always, we'll keep you - our subscribers - informed.
To summarize:
Trading capital (supplementary part of the portfolio; our opinion): F speculative short position (250% of the full position) in gold, silver, and mining stocks are justified from the risk/reward perspective with the following stop-loss orders and binding exit profit-take price levels:
- Gold: profit-take exit price: $1,391; stop-loss: $1,573; initial target price for the DGLD ETN: $36.37; stop-loss for the DGLD ETN: $25.44
- Silver: profit-take exit price: $15.11; stop-loss: $19.06; initial target price for the DSLV ETN: $24.88; stop-loss for the DSLV ETN: $14.07
- Mining stocks (price levels for the GDX ETF): profit-take exit price: $23.21; stop-loss: $30.11; initial target price for the DUST ETF: $14.69; stop-loss for the DUST ETF $6.08
In case one wants to bet on junior mining stocks' prices, here are the stop-loss details and target prices:
- GDXJ ETF: profit-take exit price: $30.32; stop-loss: $41.22
- JDST ETF: profit-take exit price: $35.88 stop-loss: $12.46
Long-term capital (core part of the portfolio; our opinion): No positions (in other words: cash)
Insurance capital (core part of the portfolio; our opinion): Full position
Whether you already subscribed or not, we encourage you to find out how to make the most of our alerts and read our replies to the most common alert-and-gold-trading-related-questions.
Please note that the in the trading section we describe the situation for the day that the alert is posted. In other words, it we are writing about a speculative position, it means that it is up-to-date on the day it was posted. We are also featuring the initial target prices, so that you can decide whether keeping a position on a given day is something that is in tune with your approach (some moves are too small for medium-term traders and some might appear too big for day-traders).
Plus, you might want to read why our stop-loss orders are usually relatively far from the current price.
Please note that a full position doesn't mean using all of the capital for a given trade. You will find details on our thoughts on gold portfolio structuring in the Key Insights section on our website.
As a reminder - "initial target price" means exactly that - an "initial" one, it's not a price level at which we suggest closing positions. If this becomes the case (like it did in the previous trade) we will refer to these levels as levels of exit orders (exactly as we've done previously). Stop-loss levels, however, are naturally not "initial", but something that, in our opinion, might be entered as an order.
Since it is impossible to synchronize target prices and stop-loss levels for all the ETFs and ETNs with the main markets that we provide these levels for (gold, silver and mining stocks - the GDX ETF), the stop-loss levels and target prices for other ETNs and ETF (among other: UGLD, DGLD, USLV, DSLV, NUGT, DUST, JNUG, JDST) are provided as supplementary, and not as "final". This means that if a stop-loss or a target level is reached for any of the "additional instruments" (DGLD for instance), but not for the "main instrument" (gold in this case), we will view positions in both gold and DGLD as still open and the stop-loss for DGLD would have to be moved lower. On the other hand, if gold moves to a stop-loss level but DGLD doesn't, then we will view both positions (in gold and DGLD) as closed. In other words, since it's not possible to be 100% certain that each related instrument moves to a given level when the underlying instrument does, we can't provide levels that would be binding. The levels that we do provide are our best estimate of the levels that will correspond to the levels in the underlying assets, but it will be the underlying assets that one will need to focus on regarding the signs pointing to closing a given position or keeping it open. We might adjust the levels in the "additional instruments" without adjusting the levels in the "main instruments", which will simply mean that we have improved our estimation of these levels, not that we changed our outlook on the markets. We are already working on a tool that would update these levels on a daily basis for the most popular ETFs, ETNs and individual mining stocks.
Our preferred ways to invest in and to trade gold along with the reasoning can be found in the how to buy gold section. Additionally, our preferred ETFs and ETNs can be found in our Gold & Silver ETF Ranking.
As a reminder, Gold & Silver Trading Alerts are posted before or on each trading day (we usually post them before the opening bell, but we don't promise doing that each day). If there's anything urgent, we will send you an additional small alert before posting the main one.
=====
Latest Free Trading Alerts:
Brace for a very busy week on the financial markets! The Fed will decide about the U.S. monetary policy and the Bureau of Labor Statistics will release its usually important monthly figures. Will quarterly corporate earnings push stock prices to new record highs? Let's take a look at this week's schedule.
Important Economic News Calendar: October 28 - November 1, 2019
=====
Thank you.
Sincerely,
Przemyslaw Radomski, CFA
Editor-in-chief, Gold & Silver Fund Manager

