
tools spotlight

-
USD Index: Are New Milestones in the Cards?
November 8, 2021, 9:16 AMWhile the greenback's failed breakout on Nov. 4th may seem bearish, it faced a similar situation in August and October, only to recover and achieve new highs.
After the USD Index’s negative response to the ECB’s monetary policy meeting on Oct. 28, I warned on Oct. 29 that dollar bears were unlikely to celebrate for much longer. I wrote:
Based on the rather random comment during the conference, the traders panicked and bought the EUR/USD, which triggered declines in the USD Index (after all, the EUR/USD is the largest component of the USDX).
Was the breakout to new 2021 lows invalidated? No. The true breakout was above the late-March highs (the August highs also served as a support level, but the March high is more important here) and it wasn’t invalidated.
What was the follow-up action? At the moment of writing these words, the USDX is up and trading at about 93.52, which is just 0.07 below the August high in terms of the closing prices. Consequently, it could easily be the case that the USD Index ends today’s session (and the week) back above this level.
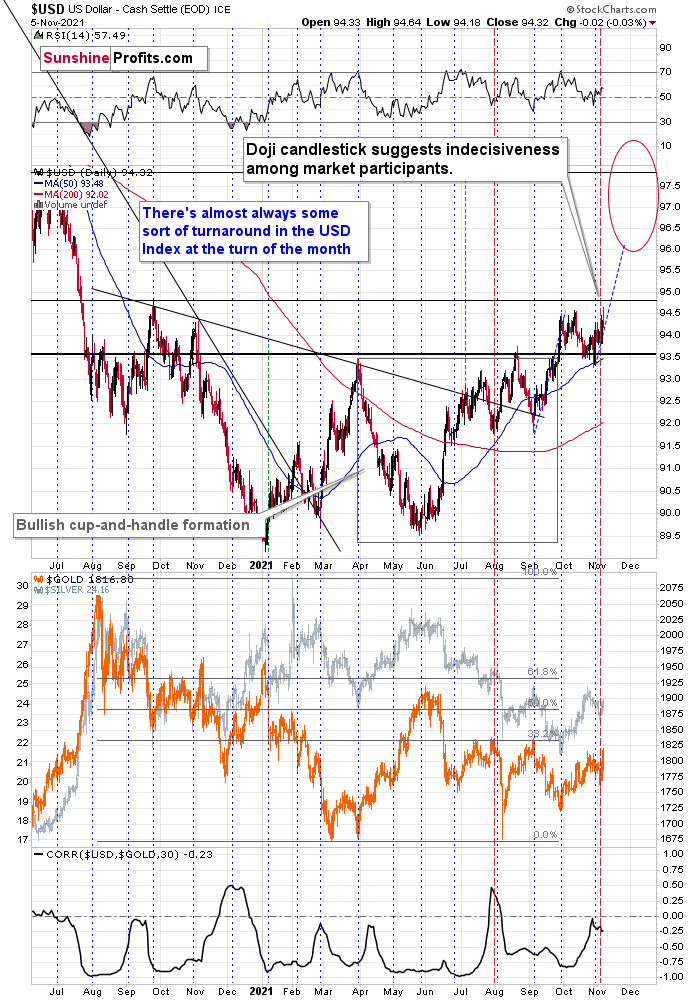
You’ve probably heard the saying that time is more important than price. It’s the end of the month, so let’s check what happened in the case of previous turns of the month; that’s where we usually see major price turnarounds. I marked the short-term turnarounds close to the turns of the month with horizontal dashed blue lines, and it appears that, in the recent past, there was practically always some sort of a turnaround close to the end of the month. Consequently, seeing a turnaround (and a bottom) in the USD index now would be perfectly normal.
And after the forecast turned into reality, the USD Index surged above 94 and remains poised to resume its uptrend over the medium term. To explain, if we zoom in on the four-hour chart, it highlights the importance of the price action on Nov. 5. During the session, the USD Index hit a new 2021 intraday high before a small reversal occurred. This might seem bearish at the first sight (it’s a failed breakout, after all)…
However, similar developments were also present in August and October. After the dollar basket attempted to make new highs and failed, the greenback eventually regained its composure and achieved the milestones. As a result, another 2021 high should occur sooner rather than later.
Please see below:
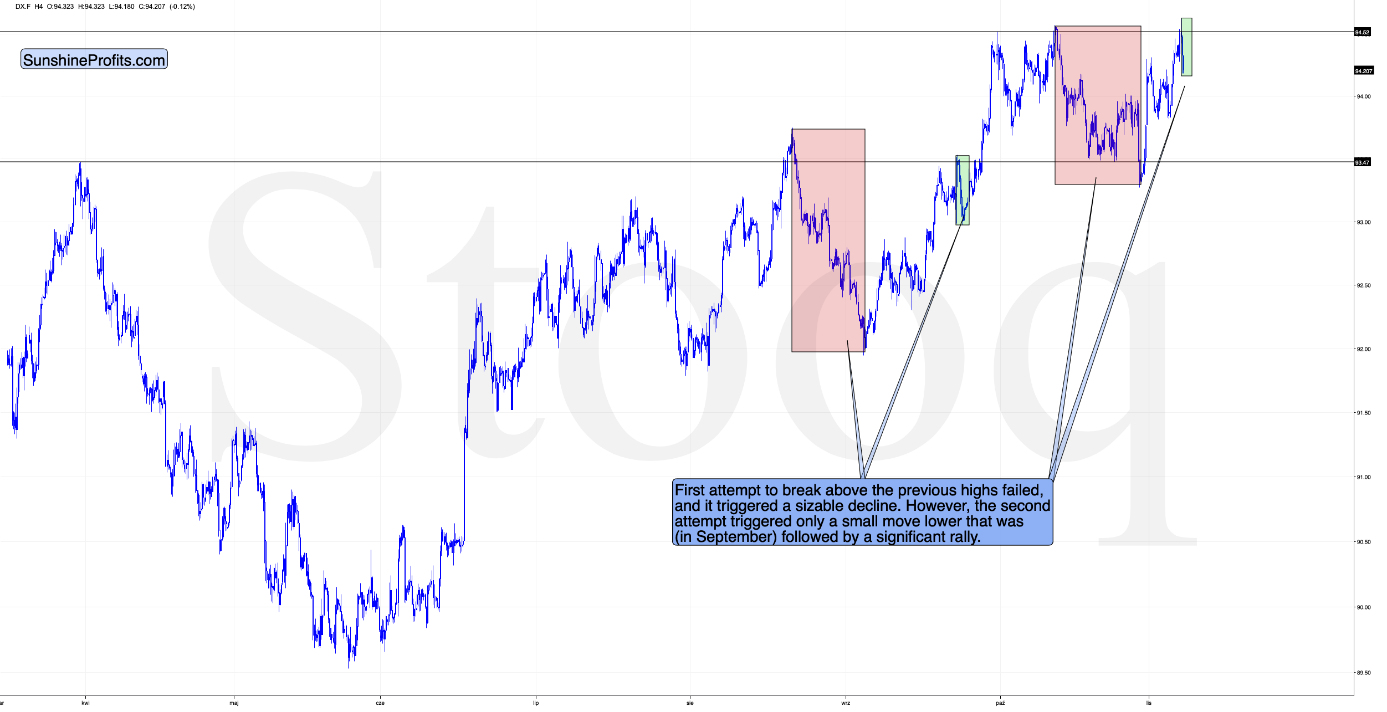
The first failed attempt to break above the previous highs triggered sizable short-term declines. This happened in August (marked with red). The second – September – attempt triggered only a small correction (marked with green) that was then followed by a bigger rally.
Similarly, the – marked with red – October invalidation was followed by a sizable decline, and the current one (marked with green), is relatively small. And it’s likely to be followed by a short-term rally, just like the September correction was.
On top of that, as you can see on the below chart, the current setup for the USD Index and gold mirrors what we witnessed in early August. Following its sharp summertime rally, the USD Index moved close to its 50-day moving average without reaching it. And after buyers stepped in, the USD Index resumed its uptrend and made a new 2021 high. Moreover, with a similar pattern and a similar reading on the USD Index’s RSI (Relative Strength Index) present today, the greenback’s outlook remains robust. I marked both cases with red, vertical, dashed lines below.
More importantly, though gold, silver, and mining stocks’ upswings concluded once the USD Index bottomed close to its 50-day moving average in August and sharp drawdowns followed. Moreover, while gold, silver, and mining stocks’ recent rallies were likely underwritten by expectations of a weaker USD Index (it did fail to move to new highs, right?) , technical (as described above and below) and fundamental realities contrast this thesis.
As a result, the 2021 theme of ‘USD Index up, PMs down’ will likely resume over the medium term.
Please see below:
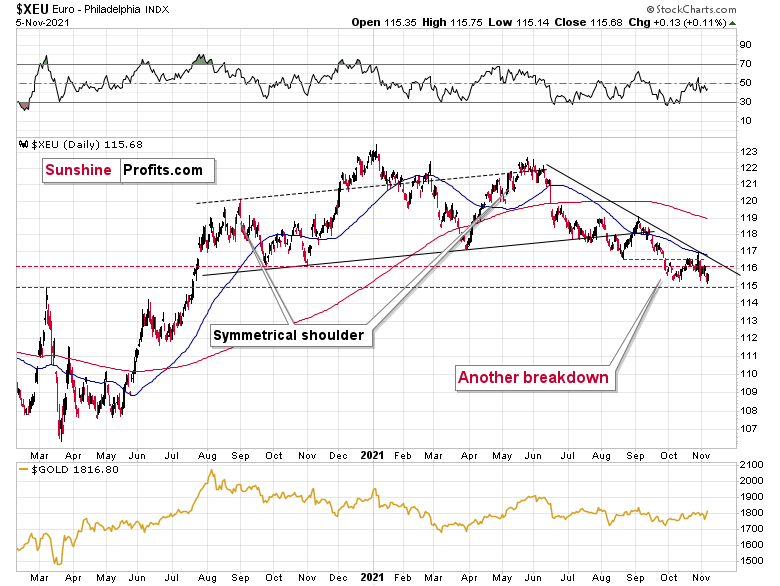
Equally bullish for the greenback, the Euro Index remains overvalued and should suffer a material drawdown over the medium term. For example, the index’s previous lows, its 50-day moving average, and its declining resistance line combined to create major resistance and the Euro Index is now retesting its 2021 lows.
As a result, the next temporary stop could be ~1.1500 (the March 2020 highs, then likely lower). For context, the EUR/USD accounts for nearly 58% of the movement of the USD Index, and that’s why the euro’s behavior is so important.
Please see below:
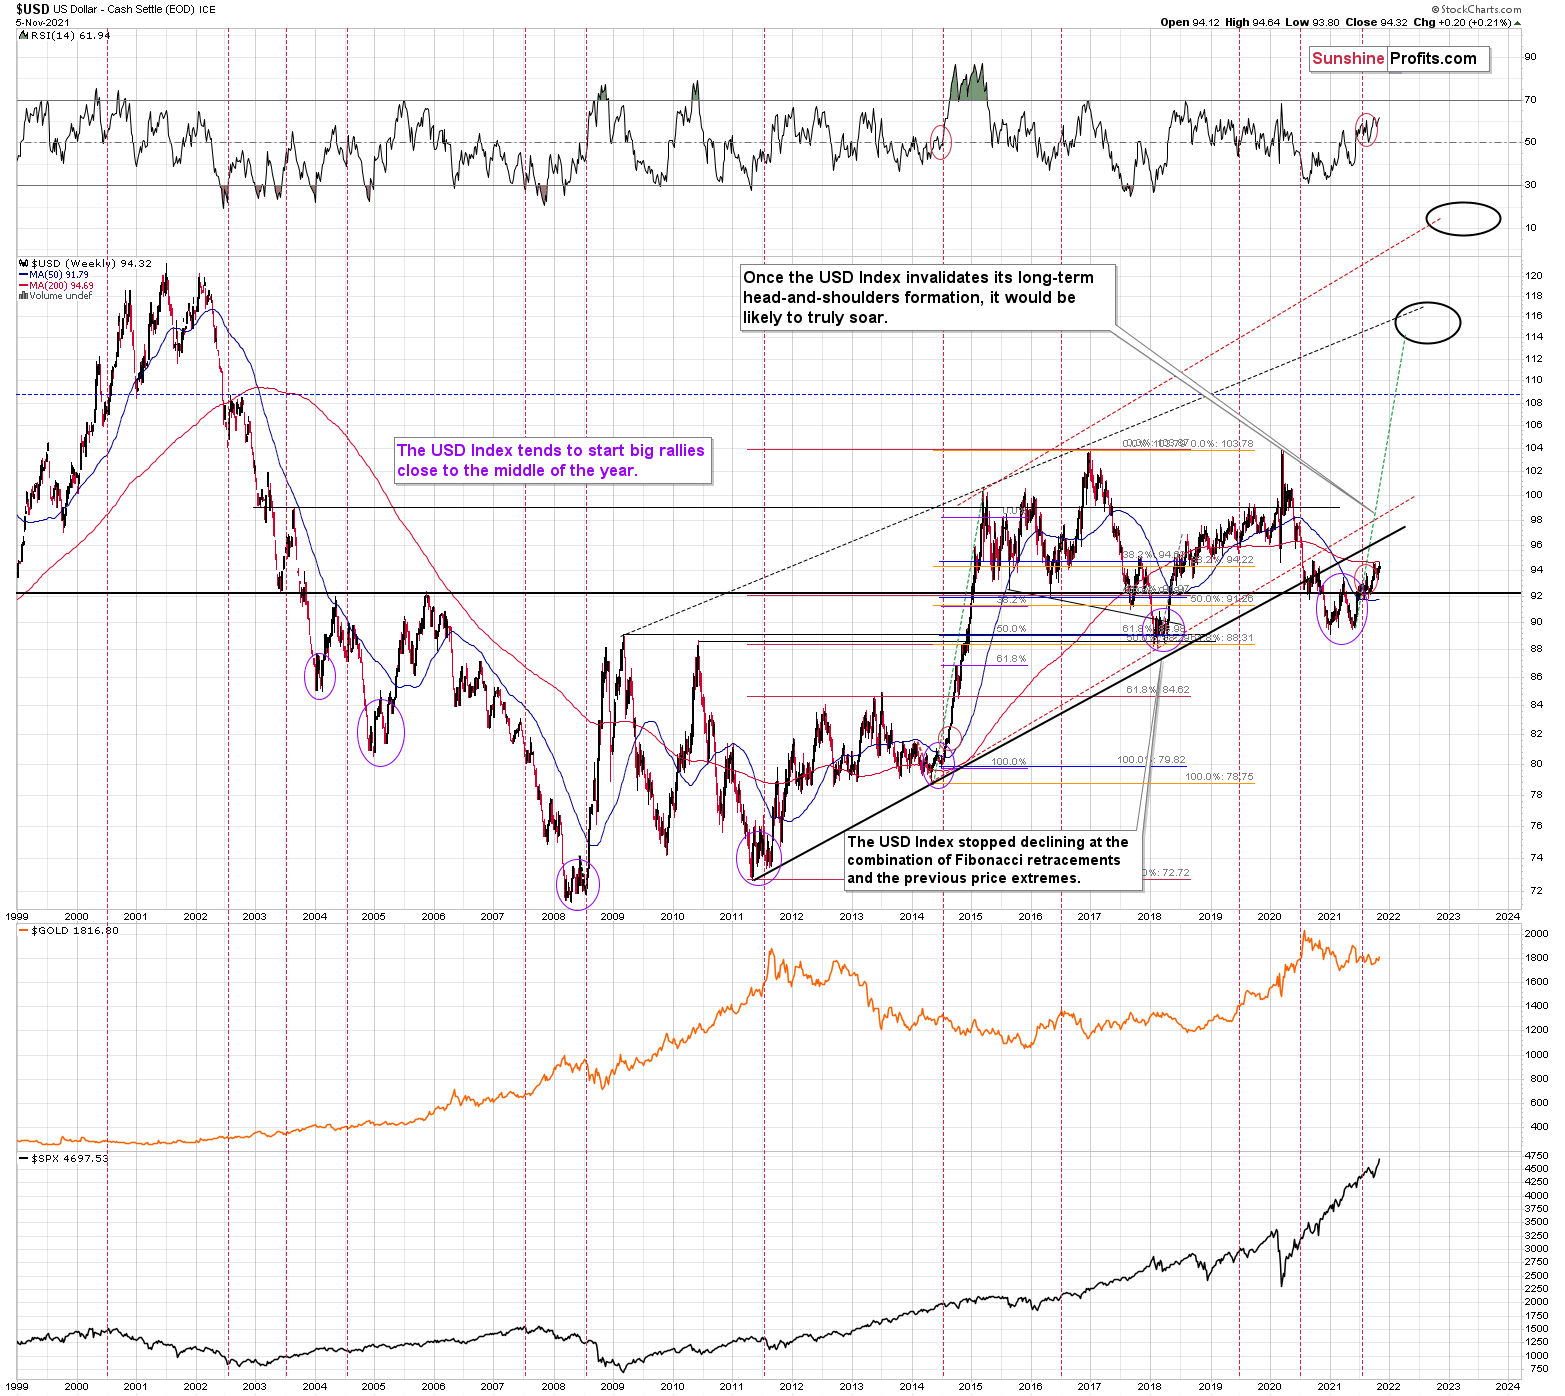
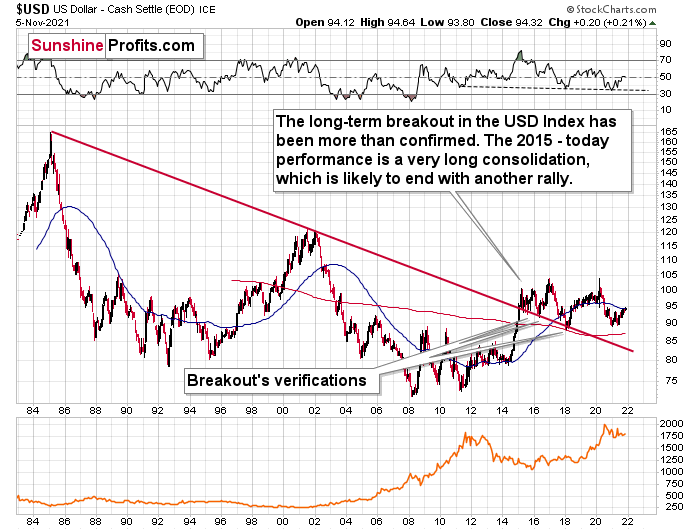
Adding to our confidence (don’t get me wrong, there are no certainties in any market; it’s just that the bullish narrative for the USDX is even more bullish in my view), the USD Index often sizzles in the summer sun and major USDX rallies often start during the middle of the year. Summertime spikes have been mainstays on the USD Index’s historical record and in 2004, 2005, 2008, 2011, 2014 and 2018 a retest of the lows (or close to them) occurred before the USD Index began its upward flights (which is exactly what’s happened this time around).
Furthermore, profound rallies (marked by the red vertical dashed lines below) followed in 2008, 2011 and 2014. With the current situation mirroring the latter, a small consolidation on the long-term chart is exactly what occurred before the USD Index surged in 2014. Likewise, the USD Index recently bottomed near its 50-week moving average; an identical development occurred in 2014. More importantly, though, with bottoms in the precious metals market often occurring when gold trades in unison with the USD Index (after ceasing to respond to the USD’s rallies with declines), we’re still far away from that milestone in terms of both price and duration.
Moreover, as the journey unfolds, the bullish signals from 2014 have resurfaced once again. For example, the USD Index’s RSI is hovering near a similar level (marked with red ellipses), and back then, a corrective downswing also occurred at the previous highs. More importantly, though, the short-term weakness was followed by a profound rally in 2014, and many technical and fundamental indicators signal that another reenactment could be forthcoming.
Please see below:
Just as the USD Index took a breather before its massive rally in 2014, it seems that we saw the same recently. This means that predicting higher gold prices (or the ones of silver) here is likely not a good idea.
Continuing the theme, the eye in the sky doesn’t lie. And with the USDX’s long-term breakout clearly visible, the wind still remains at the dollar’s back.
Please see below:
The bottom line?
With my initial 2021 target of 94.5 already hit, the ~98 target is likely to be reached over the medium term, and the USDX will likely exceed 100 at some point over the medium or long term. Keep in mind though: we’re not bullish on the greenback because of the U.S.’ absolute outperformance. It’s because the region is fundamentally outperforming the Eurozone, the EUR/USD accounts for nearly 58% of the movement of the USD Index, and the relative performance is what really matters.
In conclusion, the USD Index remains in the driver’s seat and new highs should materialize over the medium term. And while gold, silver and mining stocks have rode the S&P 500 higher recently, history has been unkind when the precious metals ignore technical and fundamental realities. Moreover, with gold, silver, and mining stocks’ strong negative correlations with the U.S. dollar standing the test of time, it’s likely only a matter of time before investors realize this as well.
Thank you for reading our free analysis today. Please note that the above is just a small fraction of the full analyses that our subscribers enjoy on a regular basis. They include multiple premium details such as the interim targets for gold and mining stocks that could be reached in the next few weeks. We invite you to subscribe now and read today’s issue right away.
Sincerely,
Przemyslaw Radomski, CFA
Founder, Editor-in-chief -
Early (Gold Video) Heads-up before the Next Week
November 6, 2021, 10:34 AMBased on Friday’s (and last week’s in general) rally, it seems that the outlook for gold might be bullish. But is it? I recorded a video where I’m talking about two reversal in gold as well as about the recent performance of mining stocks.
-
The Dollar Flexes Its Muscles - Will Gold Chicken Out?
November 5, 2021, 8:29 AMLagarde spoke once again yesterday, and the markets reacted in a rather erratic manner once again too. The most important short-term details remain intact, though:
- The USD Index remains above its previous 2021 highs.
- Gold miners’ underperformance relative to gold is back with vengeance.
Let’s take a look at the charts.
The USD Index is once again moving higher, and once it breaks above its October highs, the volatility might be truly substantial. In fact, the USDX might then quickly shoot up to 97, just as it declined quickly from that level to the current levels in mid-2020.
The implications for the precious metals sector would be – of course – very bearish.
Yesterday, gold moved higher despite USD’s upswing, which might be viewed as bullish on regular days, but when there are comments regarding the euro on a given day, things are not that simple.
Gold was not that strong against the USD, it was mostly strong against the euro. But will this move continue? It’s doubtful. Instead, what we see now seems very similar to what we saw in 2013 before the decline accelerated. The back-and-forth decline, which I mentioned so many times before, simply continues.
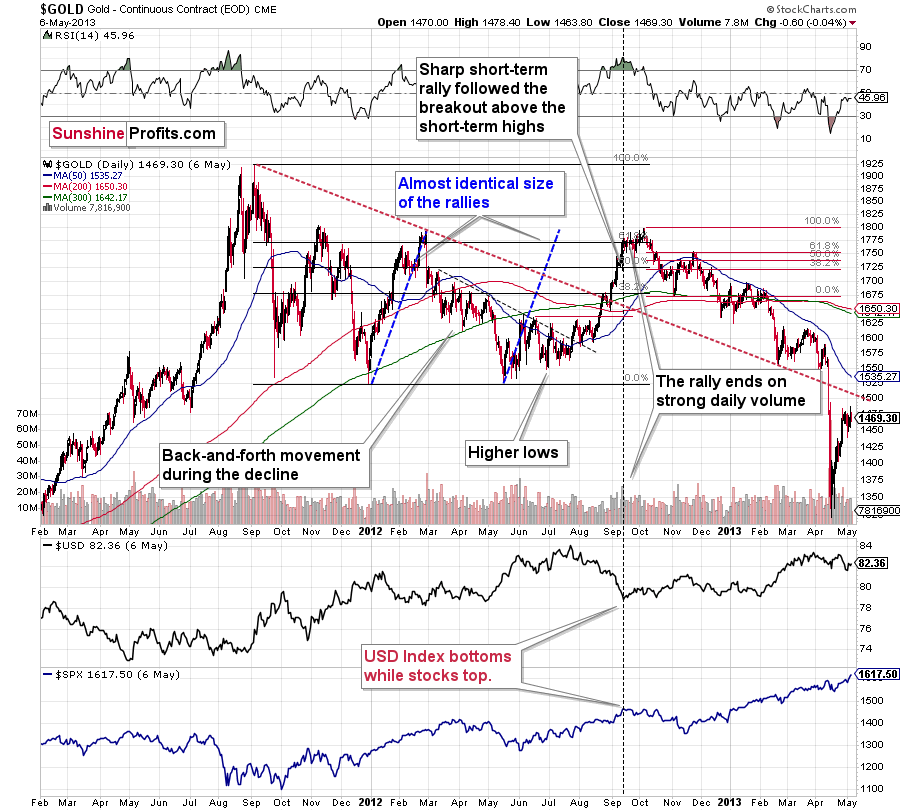
Just as the back-and-forth movement wasn’t bullish in early 2013, it’s not bullish now. And once gold moves lower, the size of the decline is likely to surprise most investors, just as it did in 2013.
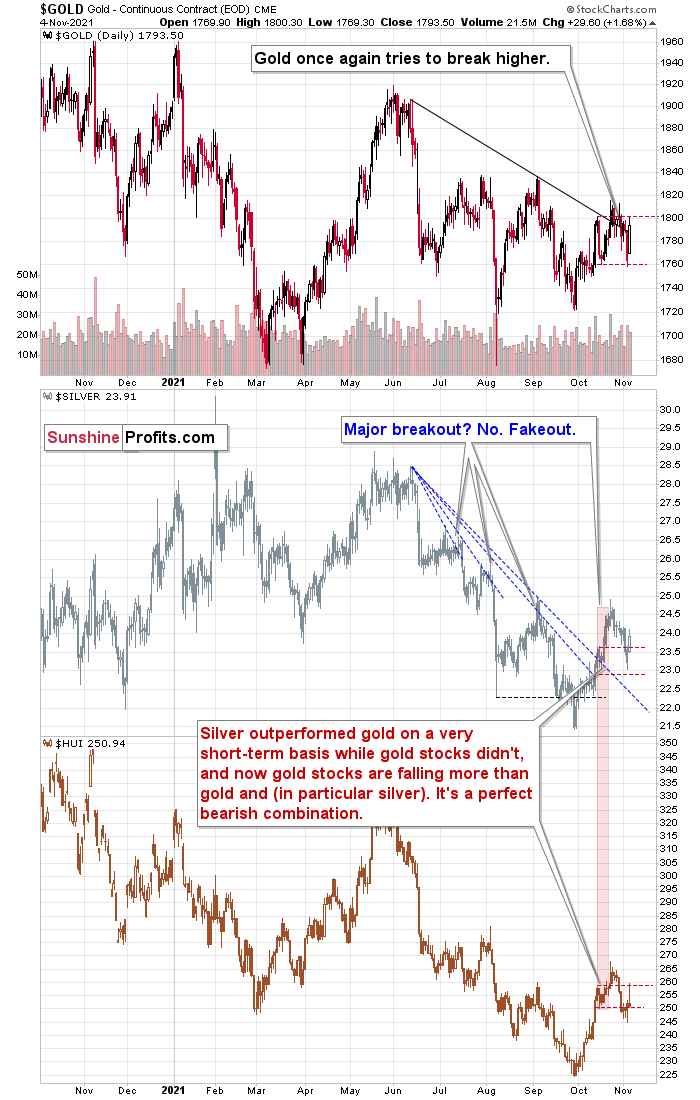
Please note that on the previous chart I marked the mid-October highs and lows with red, dashed lines. This makes it easy to see which market is outperforming and which isn’t. And, well, it’s clear that while gold and silver are quite strong (gold is slightly below the highs, while silver is above them), gold stocks are very weak. After today’s intraday rally, they declined back to the October lows. In other words, the corrective upswing might be over at this point.
In yesterday’s analysis, I wrote the following about the GDX’s performance:
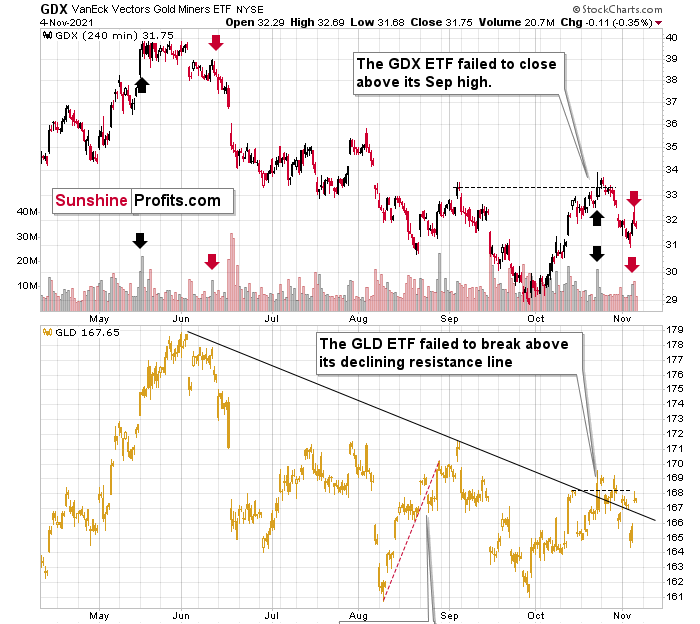
The above 4-hour GDX ETF chart allows us to see what happened in the first and second half of each session. In short, we saw the upswing – on quite strong volume – in the final part of the day. Was it truly a game-changer?
The context here is provided by the preceding decline and the rally that preceded the decline. The last time we saw something similar was in May and June. The similarity is not just in price movement, but also in terms of volume.
In both cases (in late October and in mid-May), the GDX topped on strong volume, then it moved back-and-forth for a few days, after which it declined again. However, before the decline accelerated and the GDX plunged, we first saw a small counter-trend (and fake!) sign of strength that materialized on relatively strong volume.
I marked the first (topping) volume spike with black arrows, and the final counter-trend (fake) rallies and their volume spikes with red arrows.
Did the history rhyme? That seems quite likely. And if so, the implications are not bullish, but bearish.
Also, since the rally and broad top in mid-2021 took longer to form than what we saw in October, we might also wait less for the decline’s continuation in this case than we did in June. In other words, bigger declines could be days, not weeks away. You will find additional explanations that I included in today’s video analysis of the above chart.
The above remains up-to-date, and yesterday’s intraday reversal (and decline in terms of the closing prices) further confirms it. The outlook for the precious metals sector remains bearish.
Thank you for reading our free analysis today. Please note that the above is just a small fraction of the full analyses that our subscribers enjoy on a regular basis. They include multiple premium details such as the interim targets for gold and mining stocks that could be reached in the next few weeks. We invite you to subscribe now and read today’s issue right away.
Sincerely,
Przemyslaw Radomski, CFA
Founder, Editor-in-chief -
Chasing Inflation: When You Wish Upon a Star
November 4, 2021, 7:52 AMIf Fed Chair Powell can’t see the reality for what it is, will more hawkish moves result in higher interest rate hikes?
With Fed Chairman Jerome Powell still searching for his inflationary shooting star, the FOMC chief isn’t ready to label inflation as problematic. “I don’t think that we’re behind the curve,” he said. “I actually believe that policy is well-positioned to address the range of plausible outcomes, and that’s what we need to do.”
However, before we dissect all of the details from Powell’s press conference, the FOMC officially announced the death of QE on Nov. 3. To explain, with the Fed reducing its bond purchases by $15 billion per month (effective immediately), QE should hit net-zero in June 2022.
The precious metals reacted, and mining stocks even managed to show strength. I discussed details of the implications of the upswing in the GDX in my video analysis today.
Moving back to the fundamental issues - the FOMC’s monetary policy statement read:
“In light of the substantial further progress the economy has made toward the Committee's goals since last December, the Committee decided to begin reducing the monthly pace of its net asset purchases by $10 billion for Treasury securities and $5 billion for agency mortgage-backed securities.
“Beginning later this month, the Committee will increase its holdings of Treasury securities by at least $70 billion per month and of agency mortgage‑backed securities by at least $35 billion per month. Beginning in December, the Committee will increase its holdings of Treasury securities by at least $60 billion per month and of agency mortgage-backed securities by at least $30 billion per month.
“The Committee judges that similar reductions in the pace of net asset purchases will likely be appropriate each month, but it is prepared to adjust the pace of purchases if warranted by changes in the economic outlook.”
As a result, while taper clouds have hovered over the precious metals for months and helped upend their YTD performance, have we finally reached the fundamental ‘all-clear?’ Well, in a word, no.
The reality is: while Powell has taken the path of least resistance to help calm inflation (the taper), his inability to understand the realities on the ground leaves plenty of room for hawkish shifts in the coming months (interest rate hikes).
For example, Powell said during his press conference that “the inflation that we’re seeing is really not due to a tight labor market. It’s due to bottlenecks and it’s due to shortages and it’s due to very strong demand meeting those…. We don’t see troubling increases in wages, and we don’t expect those to emerge.”
And as for “transitory:”
“Transitory is a word that has had different understandings,” said Powell. “Really for us, what transitory has meant is that if something is transitory it will not leave behind permanently – or very persistently higher – inflation. So that’s why we took a step back from transitory. We said ‘expected to be transitory.’”
For context, all inflation is transitory. And depending on one’s time horizon, 25 years can be considered transitory. Thus, while Powell’s explanation of his forecasting error is quite humorous, the taper is now in the rearview. However, now it’s time for the second act:
“We don’t think it’s time yet to raise interest rates,” said Powell. “Our decision today to begin tapering our asset purchases does not imply any direct signal regarding our interest rate policy. We continue to articulate a different and more stringent test for the economic conditions that would need to be met before raising the federal funds rate.”
However, to repeat what I wrote on Oct. 26:
Originally, the Fed forecasted that it wouldn’t have to taper its asset purchases until well into 2022. However, surging inflation pulled that forecast forward. Now, the Fed forecasts that it won’t have to raise interest rates until well into 2023. However, surging inflation will likely pull that forecast forward as well.
To explain, when asked about the FOMC “chasing inflation” and why investors have priced in rate hikes in 2022, Powell responded:
“What’s happened, and we’re very, very straightforward about it: inflation has come in higher than expected. Bottlenecks have been more persistent and more prevalent; we see that just like everybody else does. And we see that they’re now on track to persist well into next year. That was not expected. Not expected by us. Not expected by other macro forecasters.”
For context, I wrote on Apr. 30:
With Powell changing his tune from not seeing any “unwelcome” inflation on Jan. 14 to “we are likely to see upward pressure on prices, but [it] will be temporary” on Apr. 28, can you guess where this story is headed next?
More importantly, though, when a reporter pointed out that the pace of the current taper is strikingly faster than 2013, Powell responded:
“This is faster than what people had expected six months ago. It’s earlier and faster…. And that’s partly because we see inflation coming in higher.”
For context, I wrote on May 26:
For weeks, I’ve been warning that the U.S. Federal Reserve (Fed) is likely to reduce its bond-buying program much sooner than investors expect. And while investors are happy to ignore the warning signs, it was only two weeks ago that Clarida called April’s CPI print “one data point” and said that “the economy remains a long way from our goals.” As a result, the markets are a lot like the weather, and things can change rather quickly.
Thus, with “earlier and faster” likely to be repeated in the coming months, the fundamental outlook for the PMs is still quite treacherous. To explain, with U.S. Treausry yields rallying during Powell’s press conference, further momentum could elicit a re-enactment of the PMs’ drawdowns that we witnessed in early 2021.
Please see below:
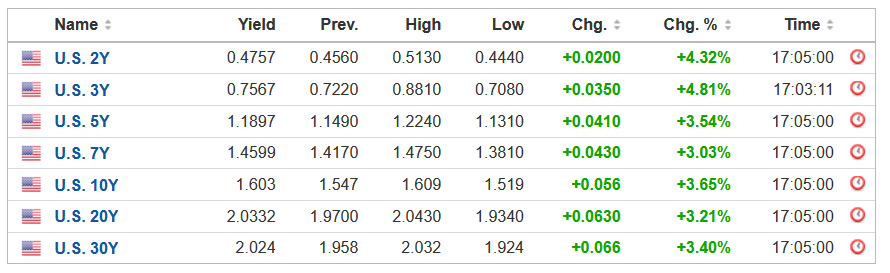 Source: Investing.com
On top of that, while the U.S. 10-Year Treasury yield has consolidated in recent weeks, the benchmark is still following its 2009-2010 analogue.
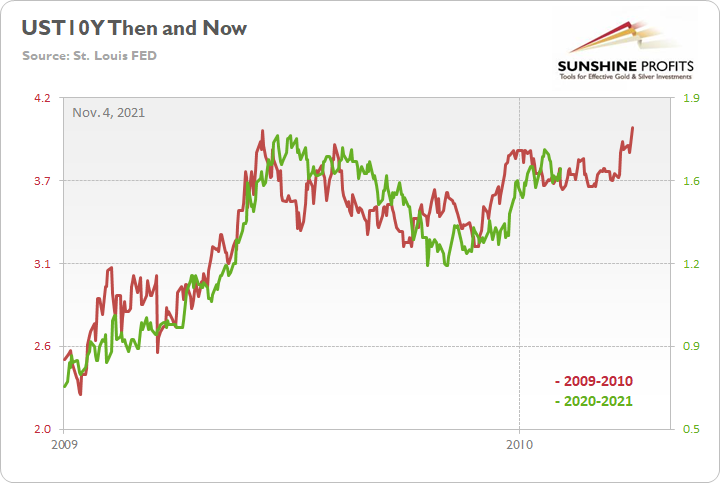
To explain, the red line above tracks the U.S. 10-Year Treasury yield’s rally off of the bottom in 2009-2010, while the green line above tracks the U.S. 10-Year Treasury yield’s current move. If you analyze the fits and starts, you can see that excessive optimism often gives way to excessive pessimism. However, after the dust settled in 2009, the U.S. 10-Year Treasury yield continued its uptrend and ultimately made a new high.
For context, the yield fell off a cliff in April 2010, before another sharp rally ensued in October 2010 (which recouped most of the losses). However, the important point is that the second cliff arrived roughly four months after the U.S. 10-Year Treasury yield recorded its second bottom. As a result, with the pace of the current economic recovery tracking well ahead of 2009, it will likely take a Black Swan event to keep the U.S. 10-Year Treasury yield from following a similar script.
Finally, while I haven’t mentioned the Fed’s daily reverse repurchase agreements (repos) in some time, the liquidity drain will now be augmented by an official taper. For context, the Fed’s reverse repos haven’t hit a new daily high since Sep. 30. However, the daily average has made a new all-time high – increasing from $642 billion in June, to $848 billion in July, to $1.053 trillion in August, to $1.211 trillion in September, and now, to $1.426 trillion in October.
Please see below:
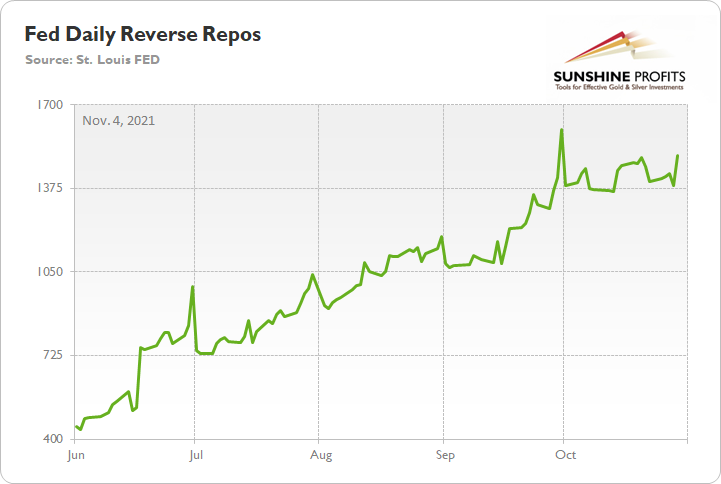
To explain, a reverse repo occurs when an institution offloads cash to the Fed in exchange for a Treasury security (on an overnight or short-term basis). And with U.S. financial institutions currently flooded with excess liquidity, they’re shipping cash to the Fed at an alarming rate.
And while I’ve been warning for months that the activity is the fundamental equivalent of a taper – due to a lower supply of U.S. dollars in the system (which is bullish for the USD Index) – the psychological effect is not the same. However, with an official taper now in place, the combination is fundamentally bullish for the U.S. dollar.
The bottom line? While the USD Index endured a ‘sell the news’ event on Nov. 3, the greenback’s fundamentals are stronger now than at any other point in 2021. And with Powell’s lack of foresight poised to elicit more hawkish shifts over the medium term, the dollar basket’s uptrend should remain in place for the foreseeable future. Furthermore, with U.S. Treasury yields likely to resume their uptrends as well, more downside should confront the PMs over the next few months.
In conclusion, the PMs were mixed on Nov. 3, as mining stocks ignored gold’s plight and rode the S&P 500 higher. However, stock market strength can only uplift the miners for so long and the GDXJ ETF will likely succumb to the technical and fundamental realities over the medium term. As a result, the bearish thesis remains intact and lower lows should materialize in the coming months.
Thank you for reading our free analysis today. Please note that the above is just a small fraction of the full analyses that our subscribers enjoy on a regular basis. They include multiple premium details such as the interim targets for gold and mining stocks that could be reached in the next few weeks. We invite you to subscribe now and read today’s issue right away.
Sincerely,
Przemyslaw Radomski, CFA
Founder, Editor-in-chief -
Gold, Silver, and Miners Just Can’t Jump
November 3, 2021, 9:22 AMLet’s face it, the metals are not having an easy time breaking out. Short-term rallies end up going nowhere and bearish signs are still in abundance.
Yesterday’s session was once again quite informative, and so is today’s pre-market trading. In yesterday’s analysis, I emphasized the importance of the relative weakness that we just saw in mining stocks, so let’s start with taking a look at what mining stocks did yesterday.
At first glance, yesterday’s performance might look like a bullish reversal, but zooming in clarifies that something else was actually in the works. Let’s take a look at the GDXJ 1-hour candlestick chart for details.
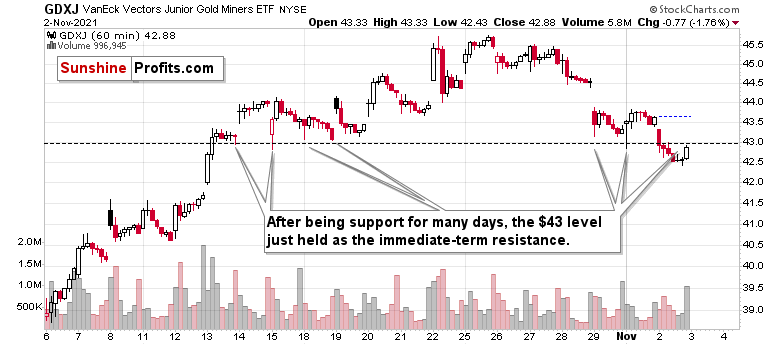
Yesterday’s “reversal” was actually a breakdown below the previous (mid-October) intraday lows along with the verification thereof. The GDXJ moved below the above-mentioned lows and – while it moved back up – it ended the session below them.
This is a bearish type of session.
Also, if you were wondering about the high volume in the final hour of trading – that’s relatively normal as that’s when bigger trades tend to take place.
And while mining stocks were busy verifying the breakdown, gold tried to break above its declining, red resistance line, and verify that breakout.
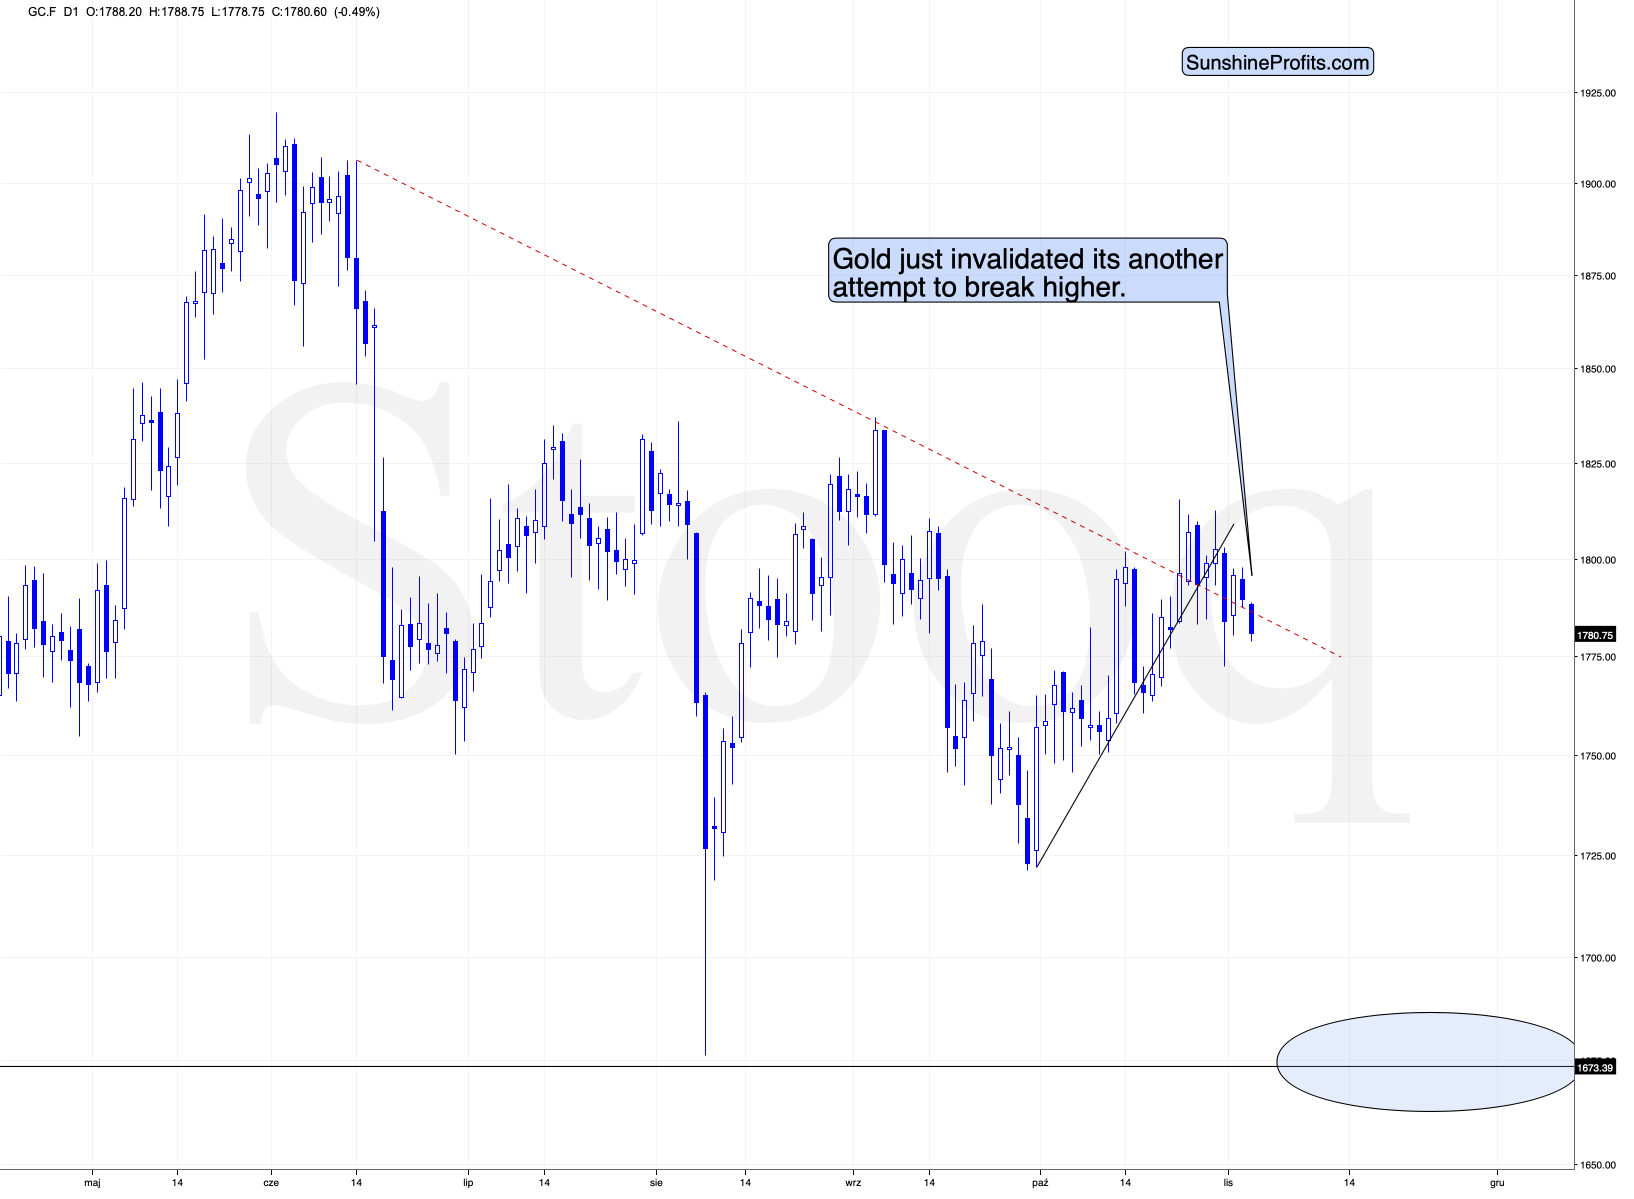
While yesterday’s session didn’t bring much lower gold prices (and the invalidation), today’s pre-market trading makes it clear that the attempt to break higher failed. Just like I had indicated yesterday.
This time the rising short-term support line is not there to prevent further declines as the breakdown below it was also confirmed.
What does it mean? It means that gold is likely to fall, and quite likely it’s going to fall hard.
Besides, silver price is after a major short-term breakdown, too.
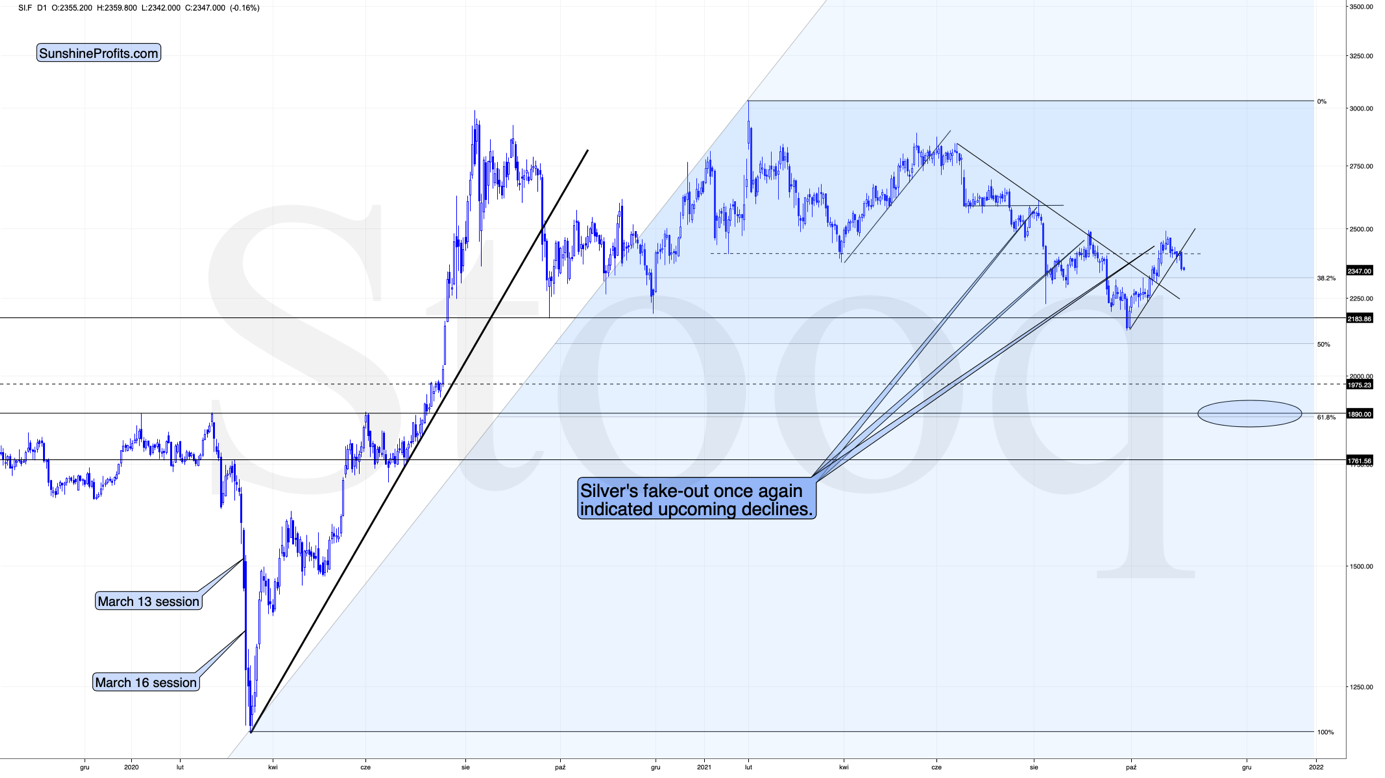
After a powerful short-term rally, silver had reversed, and now it broke below its rising support line. That’s yet another bearish indication. Please note that at first silver was reluctant to decline while mining stocks moved decisively lower, which was normal during the early part of a given decline. Silver did some catching-up action yesterday, but since miners are not showing strength, I’d say that we’re getting to the regular part of a short-term move, not close to its end.
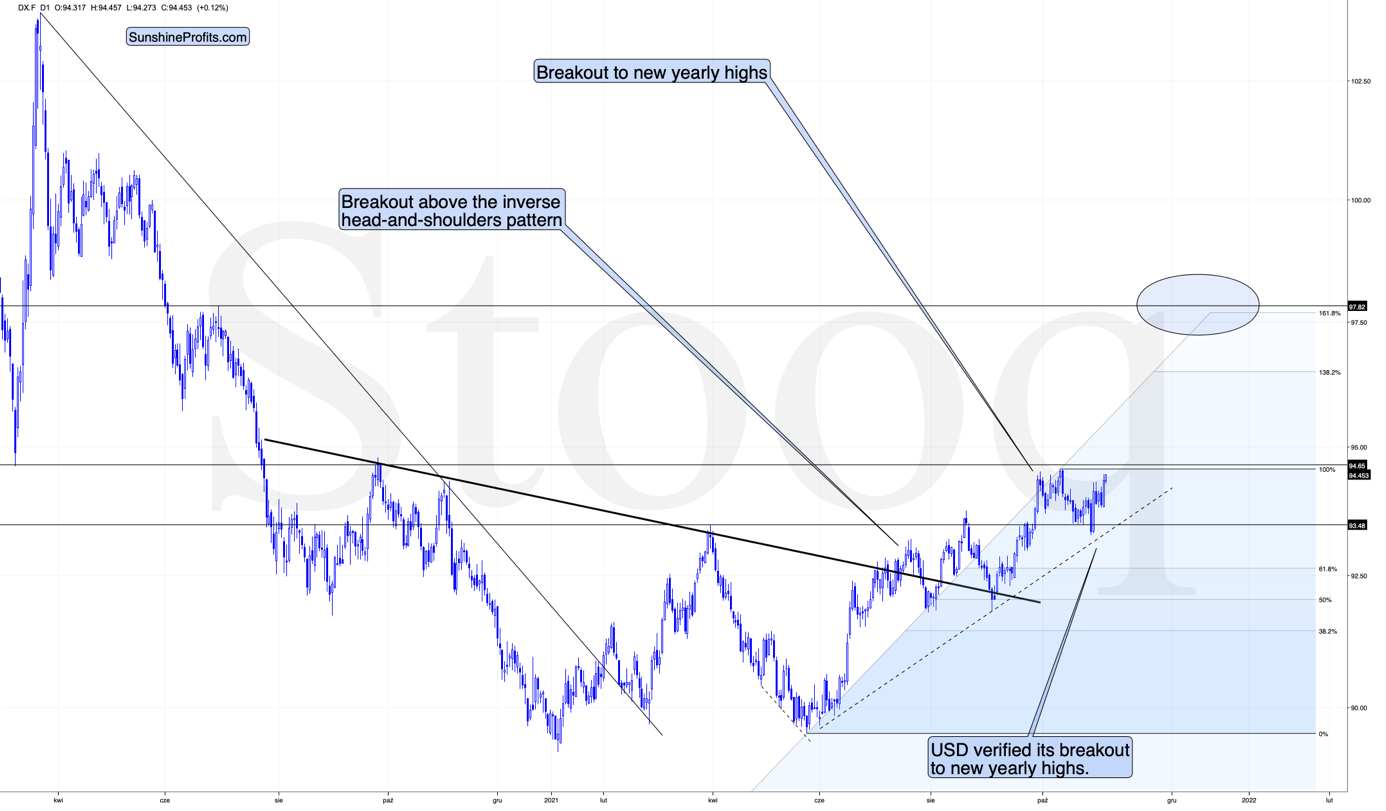
And the move lower is likely to continue, just as the move higher is likely to continue in case of the USD Index.
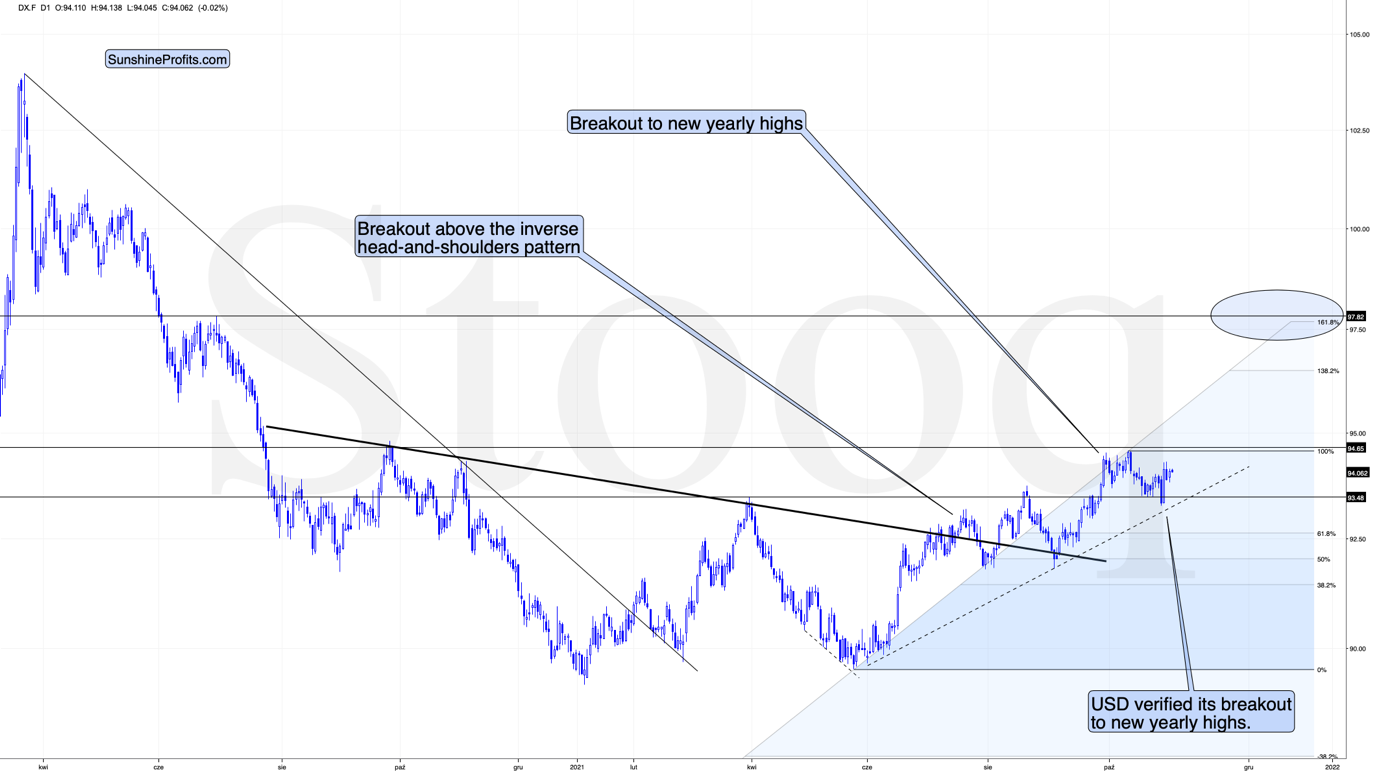
The USDX is after a verification of the breakout to new 2021 highs and after an about monthly consolidation above them. This is a perfect starting point for a major upswing, and we’re likely to see one soon.
All in all, while the outlook for the precious metals sector is very bullish for the following years, it’s very bearish for the following weeks.
Thank you for reading our free analysis today. Please note that the above is just a small fraction of the full analyses that our subscribers enjoy on a regular basis. They include multiple premium details such as the interim targets for gold and mining stocks that could be reached in the next few weeks. We invite you to subscribe now and read today’s issue right away.
Sincerely,
Przemyslaw Radomski, CFA
Founder, Editor-in-chief


Gold Investment News
Delivered To Your Inbox
Free Of Charge
Bonus: A week of free access to Gold & Silver StockPickers.
Gold Alerts
More-
Status
New 2024 Lows in Miners, New Highs in The USD Index
January 17, 2024, 12:19 PM -
Status
Soaring USD is SO Unsurprising – And SO Full of Implications
January 16, 2024, 8:40 AM -
Status
Rare Opportunity in Rare Earth Minerals?
January 15, 2024, 2:06 PM

