
tools spotlight

-
Early (Gold Video) Heads-up before the Next Week
October 16, 2021, 2:04 PMBased on last week’s events, I recorded a video in which I’m talking about the key thing that every gold investor and trader should keep in mind right now.
You can access the video using the following link:
-
Beware, Gold Bulls — That’s the Beginning of the End
October 15, 2021, 8:58 AMStrong words, I know. Can I back them up? Well, what we see now – looking at various markets – does indeed look like the start of gold’s end.
“Everything that has a beginning has an end.”
– The Oracle in Matrix Revolutions, 2003
The counter-trend rally has probably just ended, and the final big downswing has probably just started. This “beginning” of the final downswing is, in my opinion, the beginning of the final part of the prolonged sideways trend in gold that started in 2011. In the case of silver and mining stocks, that’s likely the final part of the decline that started back then.
These are strong words – I know. Let’s see if I can back them up.
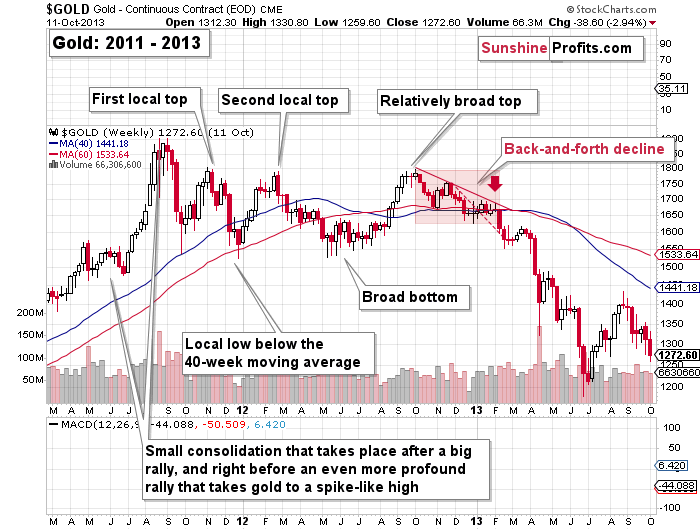
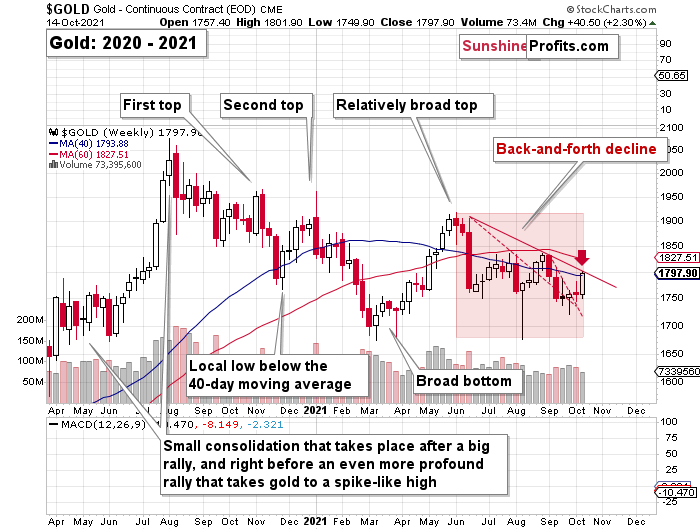
First of all, I’ve been writing about the analogy between 2013 and now for many weeks now, and you can read about these analogies in this week’s flagship analysis. This key link remains intact. The charts given below confirm that from the short-term point of view.
In yesterday’s analysis, I commented on them in the following way:
Gold jumped to its 40-week moving average and to the declining red line based on the previous short-term highs. Let’s check the context – what happened in 2013?
Right before moving to its previous medium-term lows, gold moved to its declining red resistance line that was also very close to its 40-week moving average. I marked this situation with a red arrow on both charts.
As you can see, nothing changed. The link between 2013 and now remains completely intact and its implications remain very bearish.
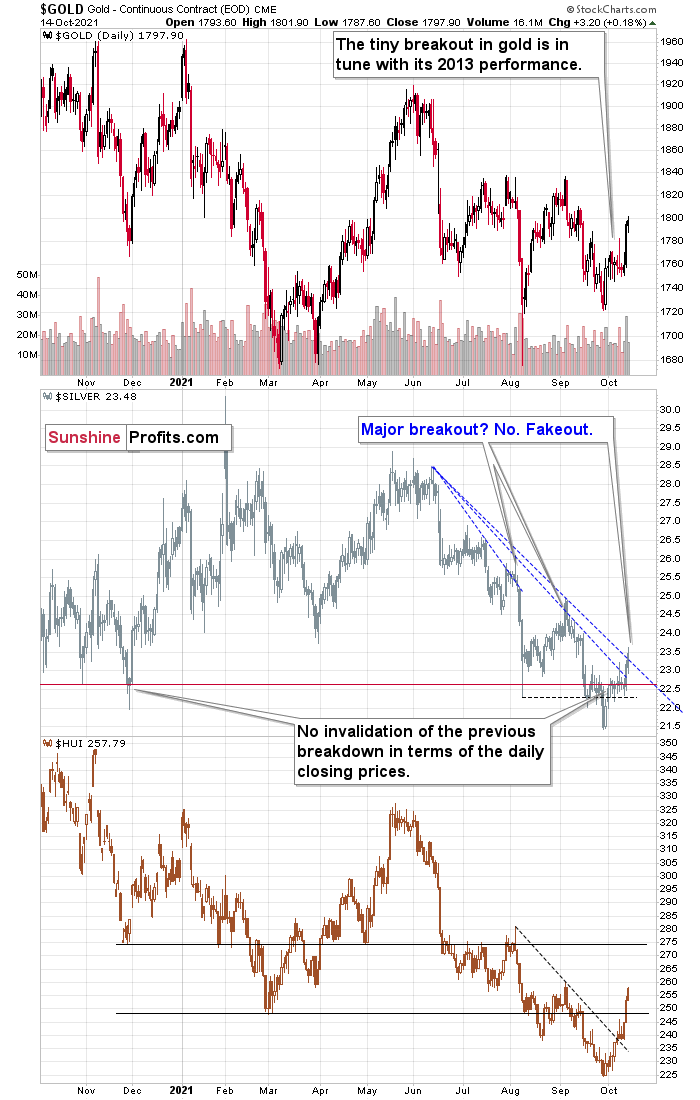
On a very short-term basis (yesterday’s session), silver outperformed gold and moved above its declining resistance line.
While gold moved higher by 0.18%, silver moved higher by 1.32%. I wrote this numerous times, and I’m going to write about this again today – silver’s very short-term outperformance of gold is not a bullish sign but a bearish one, and being aware of that is one of the more useful gold trading tips.
As far as silver’s “breakout” is concerned, it’s nothing bullish either. When you look at the August top, you’ll see that it also happened after a small, short-term breakout. The same with the early-September high. We’re seeing the same thing once again, and the implications are, once again, bearish.
On the bottom part of the above chart, you can see the HUI Index – a proxy for gold stocks. It moved notably higher recently, and it even moved above its March low, but it’s still far from its November 2020 low. So, taking a broader point of view, gold stocks are still the weakest part of the precious metals sector right now.
Moreover, please note that gold failed to hold its tiny move back above $1,800 – it was quickly invalidated. At the moment of writing these words, gold is trading at about $1,785.
Also, speaking of mining stocks, let’s take a look at what the juniors did.
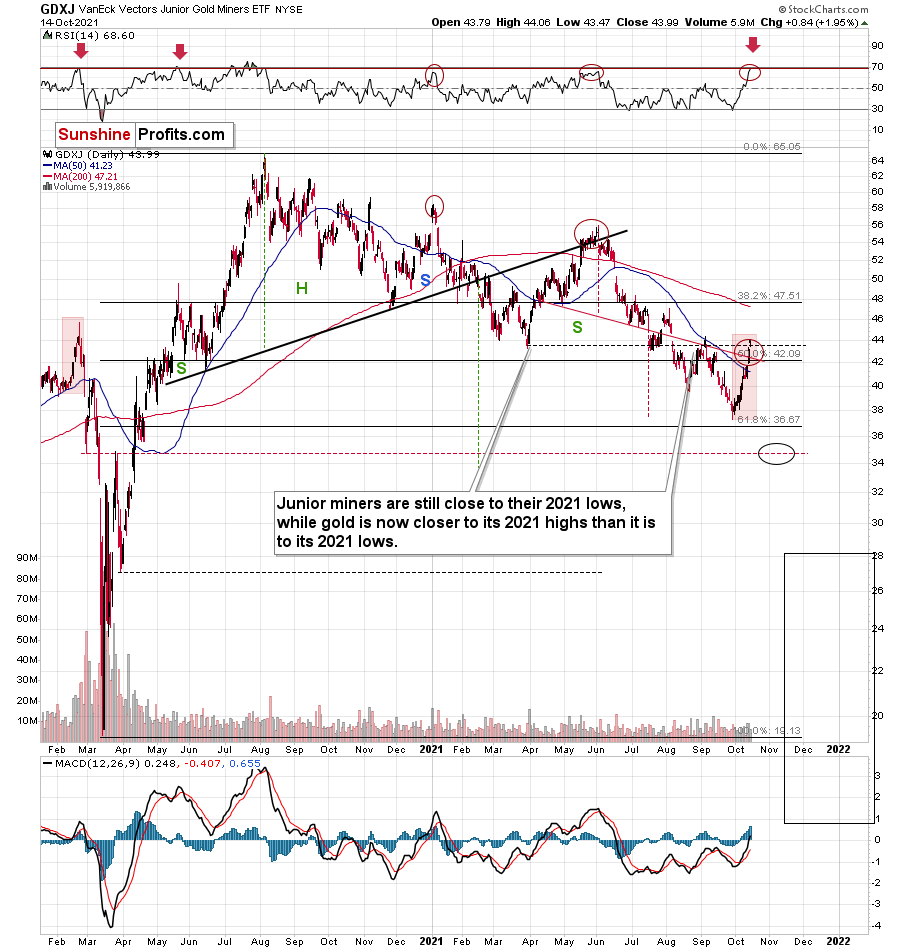
They rallied profoundly, which by itself might not be the most exciting thing you read today, especially given our short positions in them (let’s keep in mind that we took profits from the previous short position in the junior miners on Sep. 28, just one day before the bottom), but it is quite interesting when you consider how high the RSI is right now, and when in the past both the RSI and the GDXJ itself were trading at today’s levels.
That was in late February 2020. Back then, juniors were after a short-term rally from below $40, and they topped above $44. The RSI approached 70 — just like what we see today. And then the GDXJ declined below $20 in less than a month. I think the decline will take place longer this time, but the outlook is still extremely bearish.
By the way, the last time when the RSI was as high as it is right now was… right at the 2020 top. That’s yet another indication for gold that signals that the top is in or at hand.
But why shouldn’t gold, silver, and mining stocks rally even higher before turning south? Not only are they overbought on their own, but they actually have a good reason to reverse, which is coming from the USD Index.
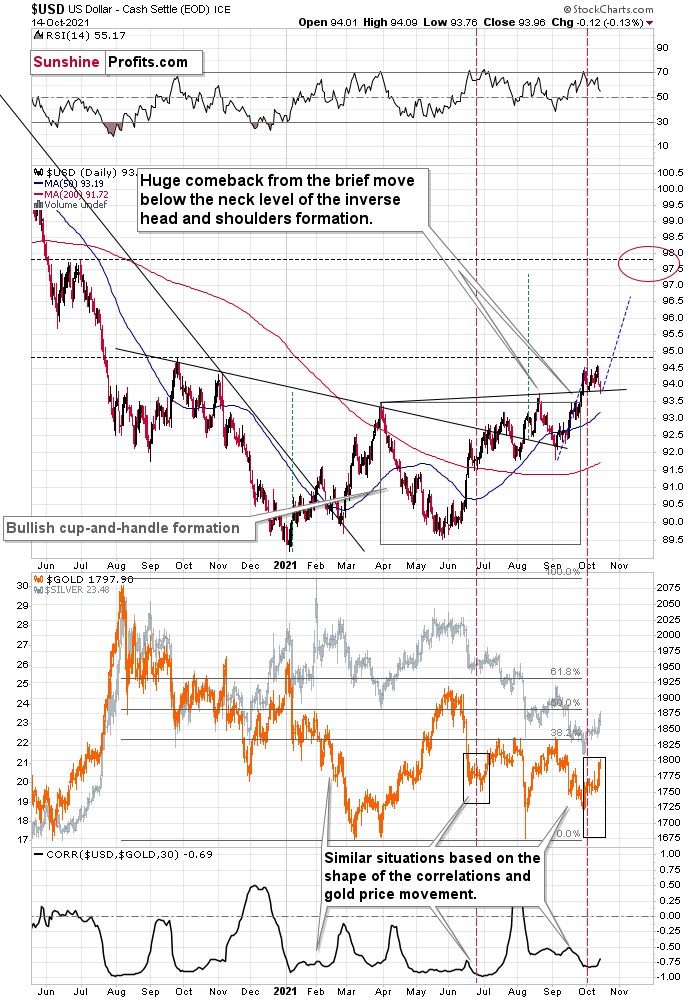
The USD Index moved back to its previous 2021 lows and its rising support line, and then it moved back up. It’s also been moving higher in today’s pre-market trading.
This tells us that the corrective flag pattern might already be over and – since the support held – the next move higher is quite likely just about to start, or it’s already underway.
Even though the USD’s move higher is so far very tiny, gold and silver are down by about 0.5% today. Is the top in the PMs in? This seems quite likely to me. What we see right now – especially in light of the analogy to Feb. 2020 in the GDXJ – does indeed look like the beginning of the end.
Thank you for reading our free analysis today. Please note that the above is just a small fraction of the full analyses that our subscribers enjoy on a regular basis. They include multiple premium details such as the interim targets for gold and mining stocks that could be reached in the next few weeks. We invite you to subscribe now and read today’s issue right away.
Sincerely,
Przemyslaw Radomski, CFA
Founder, Editor-in-chief -
Fed: Tapering in November Seems Like a Done Deal
October 14, 2021, 9:32 AMInflation is surging and consumers’ inflation expectations are doing the same. The FOMC minutes show that the central bank finally accepted reality.
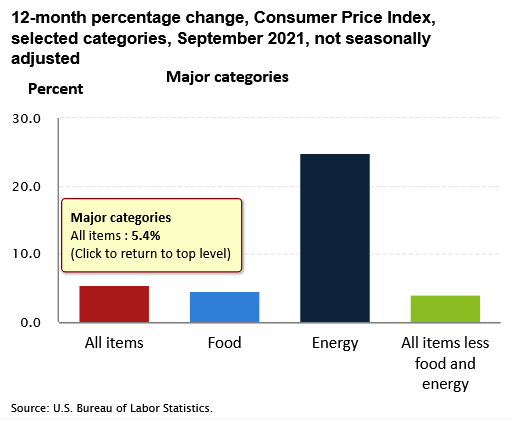
With inflation running hot and another month on the books, I wrote on Sep. 15 that another headline Consumer Price Index (CPI) print of roughly 5.25% to 5.75% should hit the wire when the data is released on Oct. 13. And with the headline CPI increasing by 5.4% year-over-year (YoY) in September, inflation is still running 2.7x the Fed’s annual target.
Please see below:
In addition, while I’ve been warning for months that rent inflation should make its presence felt during the autumn months, the Shelter CPI increased by 3.2% YoY in September – the highest YoY percentage increase so far in 2021.
Please see below:
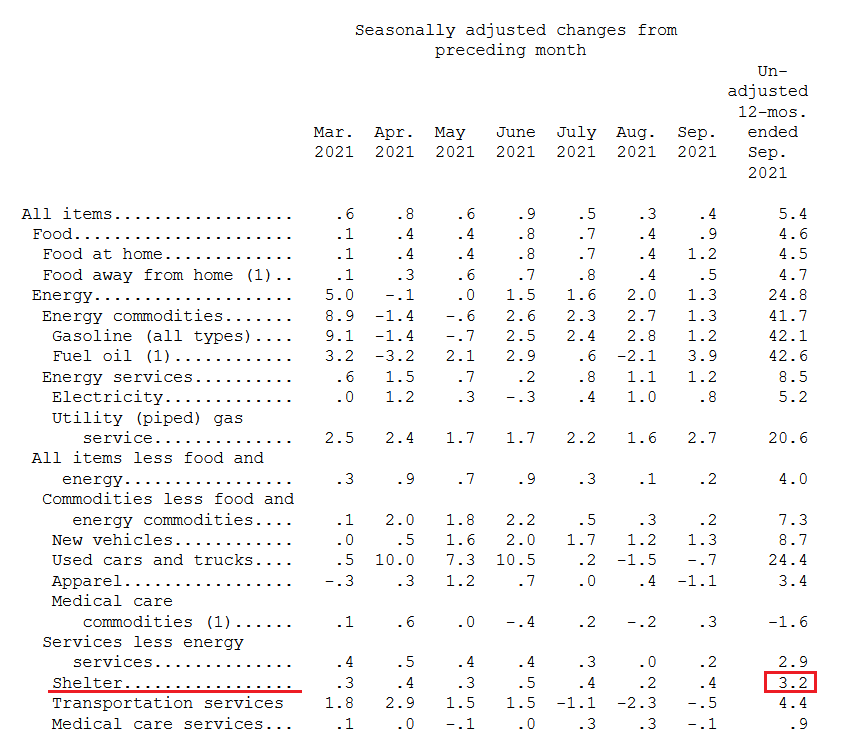 Source: U.S. Bureau of Labor Statistics (BLS)
More importantly, though, the FOMC released the minutes from its September 21/22 policy meeting on Oct. 13. And while the group essentially admitted its 2021 error, officials reiterated their expectations that “this year’s rise in inflation would prove to be transitory.”
However, highlighting the FOMC’s (stag) inflationary anxiety, the report revealed:
“The staff continued to judge that the risks to the baseline projection for economic activity were skewed to the downside. In particular, the future course of the pandemic was seen as an important source of downside risk. The staff also continued to judge that the risks around the inflation projection were tilted to the upside, with the possibility of more severe and persistent supply issues viewed as especially salient. In addition, the staff pointed to a risk that longer-run inflation expectations would move appreciably higher and lead to persistently elevated inflation.”
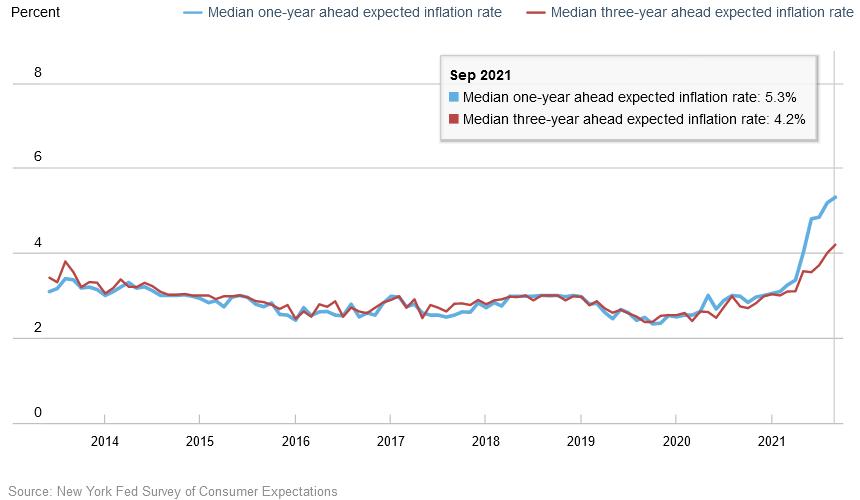
Speaking of “inflation expectations,” the New York Fed released its Survey of Consumer Expectations on Oct. 12. And while imploring that five-year inflation expectations remain “well-anchored,” the report revealed:
“Median short-term (one-year-ahead) inflation expectations increased by 0.1 percentage point in September to 5.3%, the eleventh consecutive monthly increase and a new series high since the inception of the survey in 2013. Median medium-term (three-year-ahead) inflation expectations also increased, to 4.2% from 4.0%, representing the third consecutive monthly increase and a new series high.”
Please see below:
November to Remember?
Furthermore, with inflation (as well as consumers’ inflation expectations) surging and the Fed’s largesse only exacerbating the problem, the central bank seems to have finally accepted reality. To explain, the FOMC minutes revealed that a November taper announcement is likely a done deal. And with that, a “gradual” taper that formally begins in “either mid-November or mid-December” is profoundly bullish for the U.S. dollar.
Please see below:
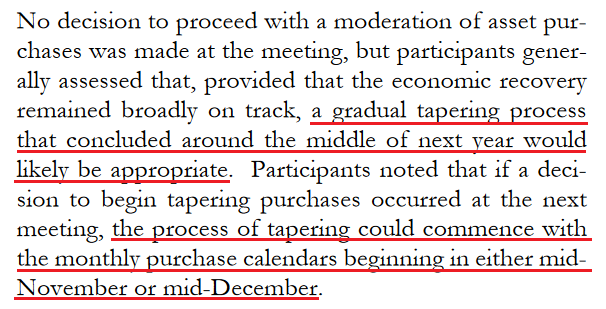 Source: U.S. Fed
For context, a taper that ends “around the middle of next year” is not “gradual.” The pace is faster than currently expected and also exceeds the precedent set in 2013. To that point, while the performances of the EUR/USD and the USD Index on Oct. 13 didn’t reflect this reality, neither move has fundamental foundations.
To explain, with the Fed essentially announcing the death of QE on Oct. 13, a profound monetary divergence will likely unfold over the medium term with significant implications for gold and silver. For example, with the Fed closing in on a taper announcement, ECB Chief Economist Philip Lane said on Oct. 11 that “we need to be much less trigger happy, we need to wait for data.” As a result:
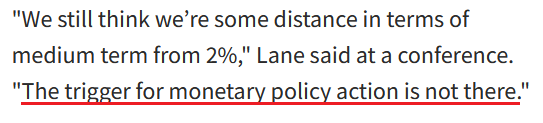 Source: Reuters
 Thus, with the Fed’s policy shift poised to usher the Fed/ECB ratio back to (or near) its 2019 lows, the EUR/USD – which accounts for nearly 58% of the movement of the USD Index – has to defy fundamental and historical precedent to move higher.
For example, the Fed/ECB ratio – which measures the relative money printing of the two central banks – stands at roughly 1.02. And since 2015, if we exclude the EUR/USD’s outlier strength in 2017-2018, when the Fed/ECB ratio sunk below 1, the EUR/USD spent most of its time in the 1.100 to 1.150 range. Moreover, when the Fed/ECB ratio sunk to an all-time low of 0.81 in September 2019, the EUR/USD closed the week trading at 1.1029.
What’s Going On, Germany?
Also supporting a dovish ECB, German economic confidence sunk to a five-month low on Oct. 12 and Germany is Europe’s largest economy. To explain, I wrote on Jun. 9 and updated monthly:
While investors continue to buy hope and sell reality, rather than rising to 86.0 (the consensus estimate), the German ZEW Economic Sentiment Index (released on Jun. 8) fell from 84.4 in May to 79.8 in June.
Please see below:
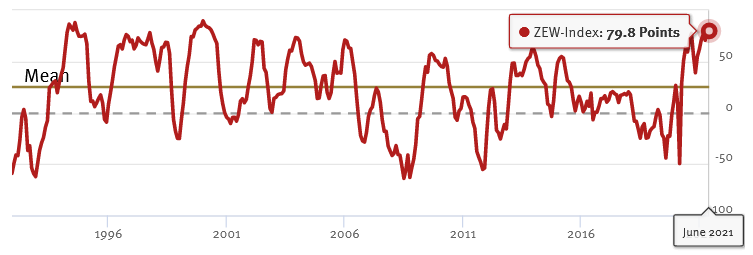 Source: ZEW
To explain, the red line above tracks the German ZEW Economic Sentiment Index. If you analyze the behavior, you can see that 79.8 is still well above its historical average. More importantly, tough, notice how abnormally high readings are often followed by swift reversions? And with the prior high (84.4) only superseded by 2000, there is an awful lot of optimism already priced into the EUR/USD.
To that point, if we fast forward to Jul. 6, the German ZEW Economic Sentiment Index sunk to 63.3. And following right along, the EUR/USD ended the Jul. 6 session at its lowest level since Mar. 24.
Please see below:
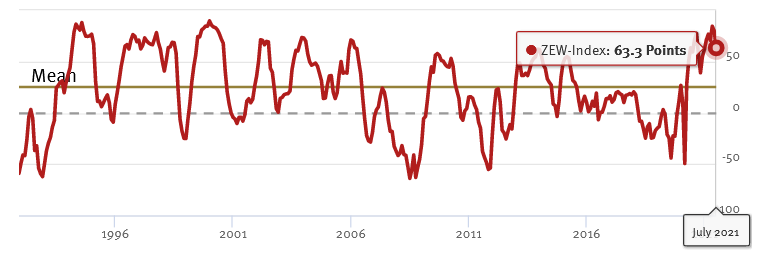 Source: ZEW
Now, with August’s reading falling off a cliff, the German ZEW Economic Sentiment Index (released on Aug. 10) fell to 40.4 – its lowest level since November 2020.
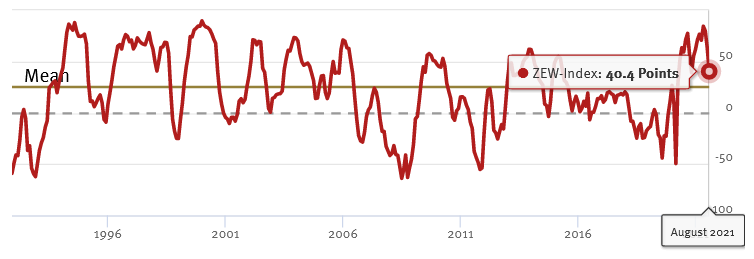 Source: ZEW
And with another month on the books and another new low, the German ZEW Economic Sentiment Index (released on Sep. 7) fell to 26.5 – its lowest level since coronavirus-induced lockdowns plagued the region in March 2020.
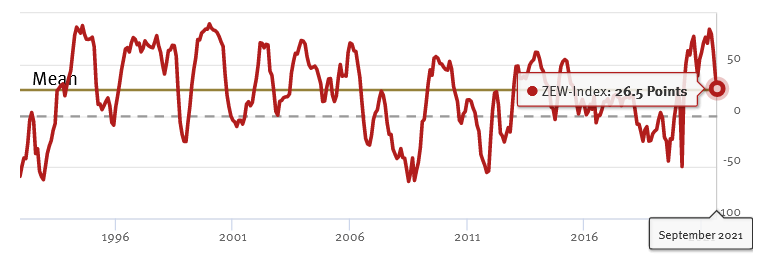 Source: ZEW
And sounding like a broken record, the German ZEW Economic Sentiment Index (released on Oct. 12) made another 2021 low (at 22.3).
Please see below:
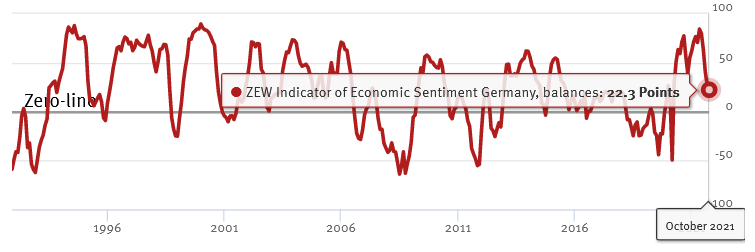 Source: ZEW
ZEW President Professor Achim Wambach provided the following context:
“The economic outlook for the German economy has dimmed noticeably. The further decline of the ZEW Indicator of Economic Sentiment is mainly due to the persisting supply bottlenecks for raw materials and intermediate products. The financial market experts expect profits to go down, especially in export-oriented sectors such as vehicle manufacturing and chemicals/pharmaceuticals.”
The Eurozone Still Behind the US
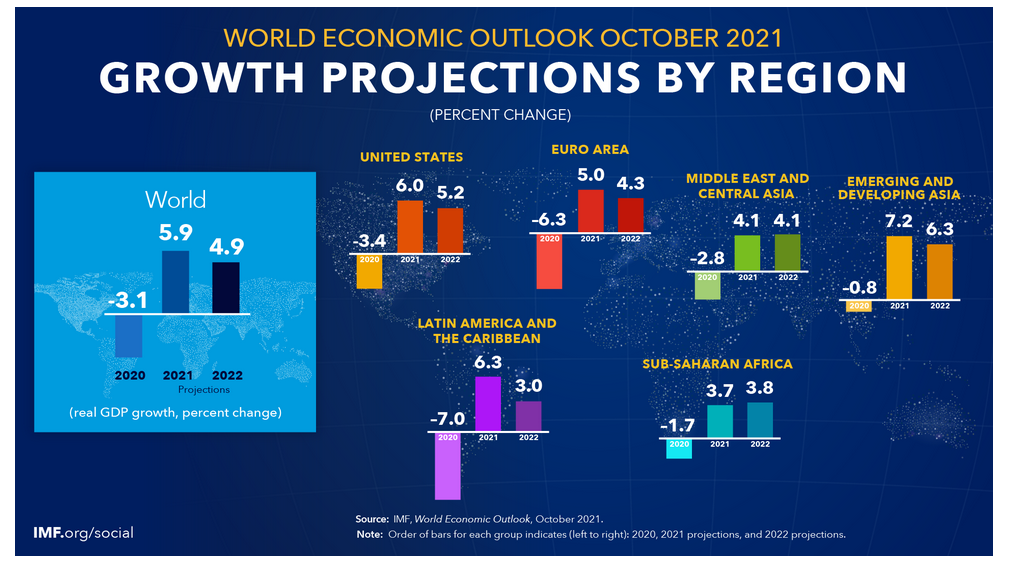
If that wasn’t enough, the International Monetary Fund (IMF) released its latest World Economic Outlook report on Oct. 12. And while changes from the group’s July projections left the Eurozone as a net-gainer over the U.S., the latter’s real GDP growth is still expected to outperform the former in 2021 and 2022.
Please see below:
Even more relevant, market participants expect the Fed to normalize its policy well in advance of the ECB.
Please see below:
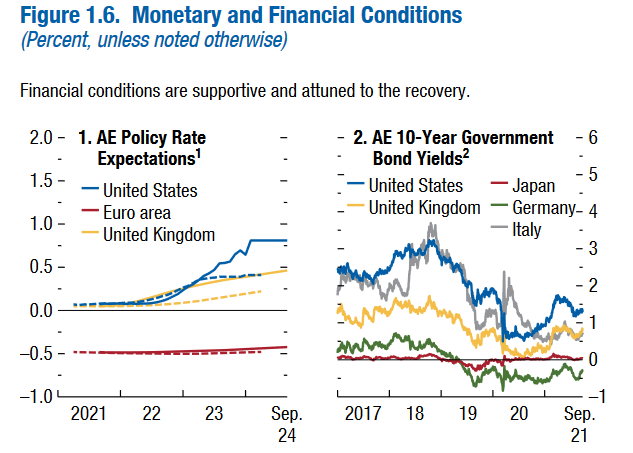 Source: IMF
To explain, the chart on the left is where you should focus your attention. The blue line above (U.S.) tracks the expected path of the federal funds rate per the futures market, while the red line above (Eurozone) tracks the expected path of the euro interbank offered forward rate. If you analyze the profound divergence, you can see that the Eurozone overnight lending rate is expected to remain negative well into 2024 and beyond. Conversely, U.S. liftoff is expected near the end of 2022, with further rate hikes commencing thereafter.
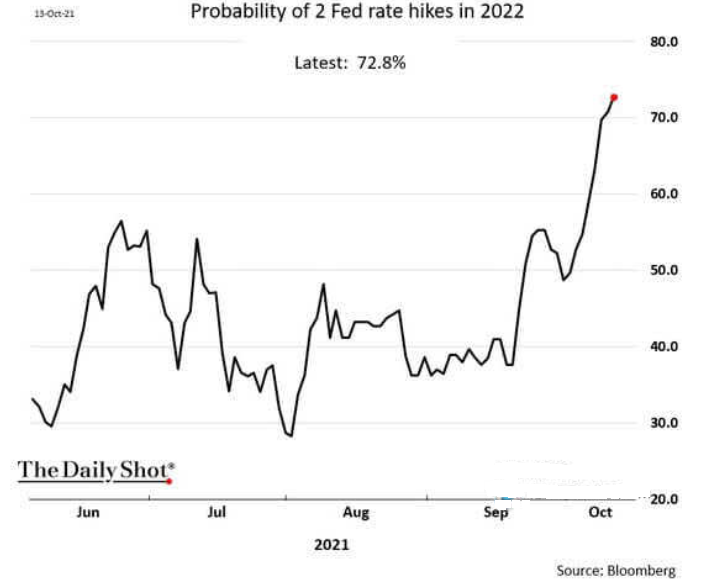
As further evidence, the probability of the Fed announcing two rate hikes in 2022 has recently spiked and is now approaching 73%.
Please see below:
The bottom line? The EUR/USD is materially overvalued relative to Eurozone-U.S. growth, liquidity and interest rate expectations. And with the currency pair responsible for the bulk of the USD Index’s fundamental movement, a material re-rating should uplift the dollar basket over the medium term. And with gold, silver and mining stocks often moving inversely to the U.S. dollar, a stronger greenback will likely weigh on the PMs during the autumn months.
In conclusion, the PMs rallied on Oct. 13, with a weaker USD Index and mixed U.S. Treasury yields helping to underwrite the daily optimism. However, with the latter poised to move higher over the medium term, the strength of the PMs’ upswings on Oct. 13 are cautionary tales of how violent the reversals could be once sentiment shifts. As a result, the PMs’ countertrend rallies will likely fizzle out and their medium-term downtrends should continue over the next few months.
Thank you for reading our free analysis today. Please note that the above is just a small fraction of the full analyses that our subscribers enjoy on a regular basis. They include multiple premium details such as the interim targets for gold and mining stocks that could be reached in the next few weeks. We invite you to subscribe now and read today’s issue right away.
Sincerely,
Przemyslaw Radomski, CFA
Founder, Editor-in-chief -
Folks, Inflation Ain’t Transitory
October 13, 2021, 9:50 AMWith inflation getting worse, has the Fed woken up? And with the USD looking bright, gold, silver, and mining stocks continue to feel the pinch.
By the way, I most recently discussed the short and medium-term outlook for silver in both charts and a video analysis. Please check them out.
With U.S. nonfarm payrolls coming in weaker than expected on Oct. 8, the Fed’s taper timeline was once again in the spotlight. However, with the U.S. unemployment rate falling to 4.8% (versus 5.1% expected) and the weakness mainly driven by a decline in government payrolls (private payrolls increased by 317,000), the lukewarm print should still meet Chairman Jerome Powell’s taper threshold.
To explain, July’s data was revised upward by 38,000 (increased for the second time), while August’s data was revised upward by 131,000. As a result, 169,000 more jobs were added than previously reported.
Please see below:
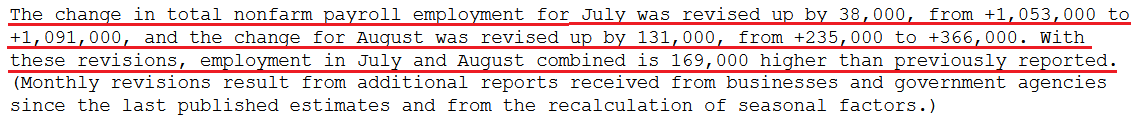 Source: U.S. Bureau of Labor Statistics (BLS)
What’s more, with inflation surging and the “transitory” narrative suffering a slow and painful death, the Fed is having its ‘come-to-Jesus’ moment. For context, I’ve been warning for months that the central bank remains materially behind the inflation curve.
I wrote on Apr. 30:
With Powell changing his tune from not seeing any “unwelcome” inflation on Jan. 14 to “we are likely to see upward pressure on prices, but [it] will be temporary” on Apr. 28, can you guess where this story is headed next?
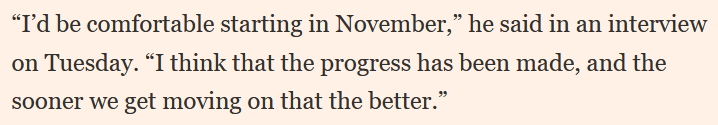
To that point, Atlanta Fed President Raphael Bostic said on Oct. 12:
“I believe evidence is mounting that price pressures have broadened beyond the handful of items most directly connected to supply chain issues or the reopening of the services sector.... Up to now, indicators do not suggest that long-run inflation expectations are dangerously untethered. But the episodic pressures could grind on long enough to unanchor expectations.”
More importantly, though, he admitted:
“Transitory is a dirty word…. It is becoming increasingly clear that the feature of this episode that has animated price pressures – mainly the intense and widespread supply chain disruptions – will not be brief. By this definition, then, the forces are not transitory.”
And how does this impact his taper timeline?
 Source: the Financial Times
Also making the rounds, Fed Vice Chairman Richard Clarida supported the hawkish rhetoric on Oct. 12. Speaking at the Institute of International Finance’s virtual annual meeting, he said that “the risks to inflation are to the upside.” And after conceding that “the big unknown right now is how long it will take for these bottleneck effects to work their way through,” he admitted:
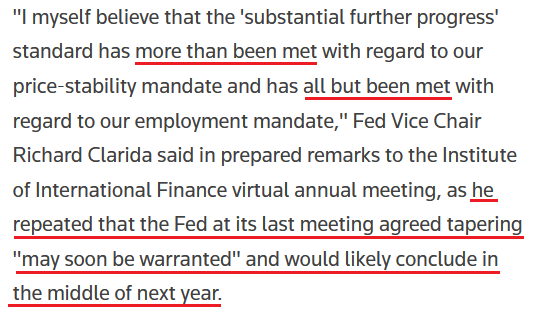 Source: Reuters
For context, if the Fed concludes the taper by the “middle of next year,” the timeline is extremely hawkish. To explain why, I wrote on Sep. 23:
With ~$120 billion worth of bond purchases poised to hit zero in roughly nine months, the accelerated liquidity drain is extremely bullish for the USD Index.
Please see below:
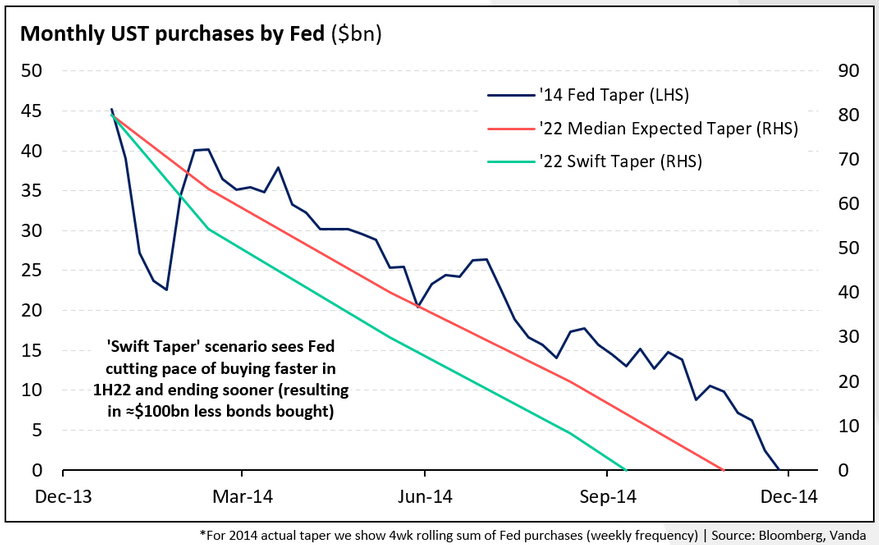
To explain, the dark blue line above tracks the pace of the Fed’s taper following its announcement in December 2013, while the orange line above tracks the consensus estimate this time around. However, if you focus your attention on the light blue line, you can see that Powell’s taper timeline pushes QE to zero in advance of both the precedent set in 2014 and the current consensus estimate.
On top of that, while the Fed has finally opened its eyes to persistent inflation, the central bank is still operating in the rearview. To explain, while Fed officials seem to agree that tapering is necessary to calm inflation (which we also agree on), at the current rate, the hawkish shift isn’t nearly hawkish enough.
For example, while I’ve been sounding the alarm on the cost-push inflationary spiral for months, Brent and WTI prices are now trading north of $80 per barrel and Citigroup said that winter weather could uplift the former to $90 per barrel in the fourth quarter. For context, Citigroup, Goldman Sachs and Bank of America are all forecasting $90+ per barrel Brent this year. And while The White House called on OPEC (for the second time) to “do more” (increase supply to reduce oil prices), the cartel has ignored the pleas. As a result, if oil’s upward momentum persists, the Fed is materially underestimating the inflationary impact.
Second, while commodity prices remain the most important driver of inflation, even “transitory” factors have leaped to new highs. For context, I wrote on Apr. 16:
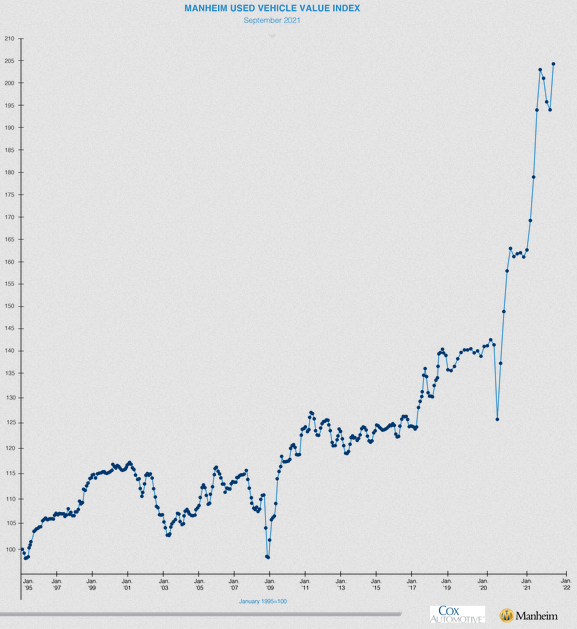
The Manheim Used Vehicle Index – compiled from a database of more than five million annual used vehicle transactions – increased by 5.87% month-over-month to a record high 179.2 in March. What’s more, the pace of the surge is unlike anything that we’ve ever witnessed before.
And after a brief pause – which even we conceded given that abnormally high used car prices should be “transitory” – Manheim revealed that wholesale used vehicle prices “increased 5.3% month-over-month in September” and “brought the Manheim Used Vehicle Index to [a record high] 204.8.”
Please see below:
In addition, Oshkosh Corporation – an American manufacturer of specialty trucks, military vehicles, truck bodies, airport fire apparatus and access equipment – reduced its full-year revenue and earnings guidance on Oct. 8. The company cited “significant supply chain and logistics disruptions as well as material and freight cost inflation similar to other companies that are beyond the company’s prior expectations.”
CEO John C. Pfeifer added:
“We implemented multiple price increases in our non-defense segments over the past six to nine months to combat unprecedented raw material inflation and freight cost escalation. Based on current conditions, we expect that our pricing actions will cover our higher input costs. However, due to our backlogs, we do not believe this price catch-up will occur until the end of the second quarter of Calendar 2022. If cost escalation persists, we will take additional pricing actions.”
On the other side of the inflationary coin, the NFIB released its Small Business Optimism Index on Oct. 12. And while the headline index declined from 100.1 in August to 99.1 in September, wage inflation rose to levels unseen since the 1970s.
Please see below:
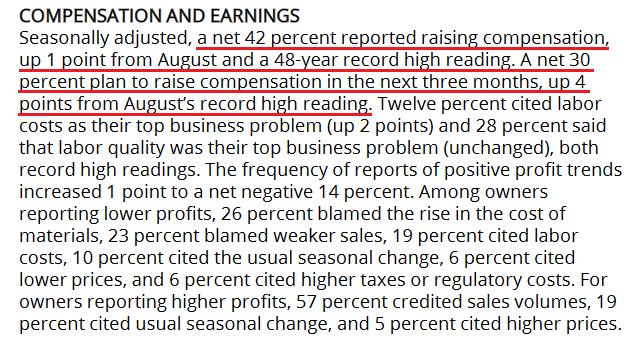 Source: NFIB
Furthermore, while “the net percent of owners raising average selling prices decreased 3 points to a net 46 percent,” output inflation still remains at a more than 30-year high.
Please see below:
 Source: NFIB
Finally, I’ve mentioned on several occasions that the commodity Producer Price Index (PPI) will likely determine when/if the inflationary momentum subsides. For context, its relationship with the headline Consumer Price Index (CPI) remains right on trend (follow the black arrow below):
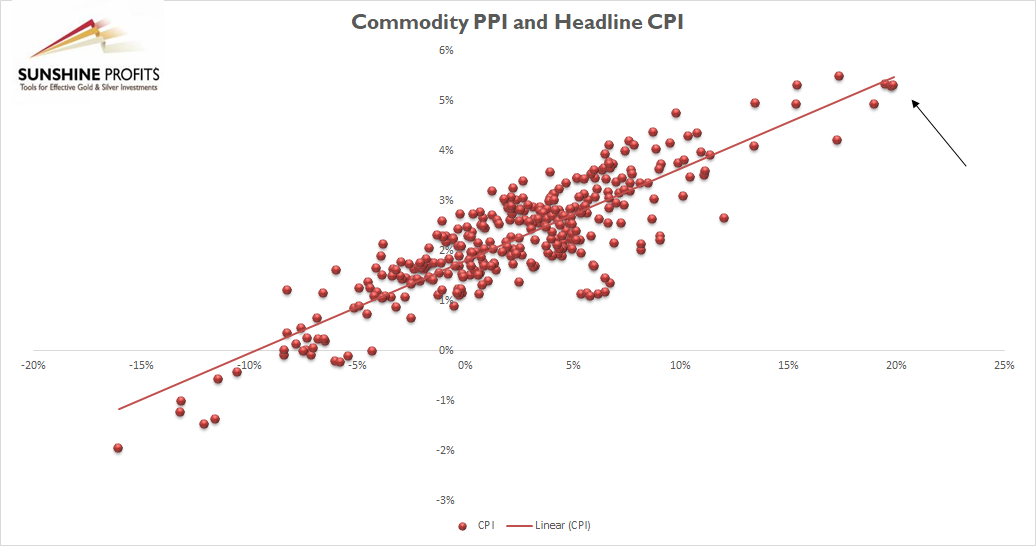
And with the headline CPI the most important fundamental data point released today, I wrote on Sep. 15 that “another headline CPI print of roughly 5.25% to 5.75% should hit the wire when the data is released on Oct. 13.
Please see below:
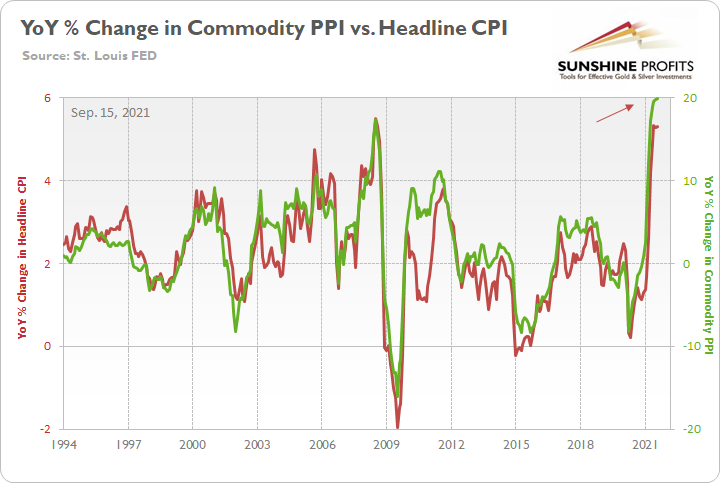
To explain, the green line above tracks the YoY percentage change in the commodity PPI, while the red line above tracks the YoY percentage change in the headline CPI. If you analyze the relationship, you can see that the pair have a close connection.
The bottom line? While the headline CPI remains pinned in the 5%+ range (expected) for now, the metric is still well above the Fed’s 2% annual target. What’s more, with the S&P Goldman Sachs Commodity Index (S&P GSCI) making new highs alongside Brent and WTI, the future impact on the commodity PPI should be material. And if the Fed doesn’t accelerate the liquidity drain and calm commodities’ fervor, we may see a 6% headline CPI print before we see 4%. Conversely, if companies can’t pass through the higher input inflation, the impact on corporate profit margins could upend the general stock market and leave the Fed handcuffed.
As a result, whether the Fed accelerates its taper timeline or margin pressures lead to a stock market correction, both outcomes are profoundly bullish for the U.S. dollar. And with the PMs exhibiting strong negative correlations with the greenback, they could suffer materially as the events unfold.
In conclusion, the PMs were mixed on Oct. 12. However, with the EUR/USD hitting a new 2021 low and the USD Index hitting a new 2021 high, the dollar’s medium-term outlook remains quite bright. Moreover, with the Fed upping the hawkish ante and an accelerated liquidity drain poised to chip away at the PMs, new lows should materialize over the next few months.
Thank you for reading our free analysis today. Please note that the above is just a small fraction of the full analyses that our subscribers enjoy on a regular basis. They include multiple premium details such as the interim targets for gold and mining stocks that could be reached in the next few weeks. We invite you to subscribe now and read today’s issue right away.
Sincerely,
Przemyslaw Radomski, CFA
Founder, Editor-in-chief


Gold Investment News
Delivered To Your Inbox
Free Of Charge
Bonus: A week of free access to Gold & Silver StockPickers.
Gold Alerts
More-
Status
New 2024 Lows in Miners, New Highs in The USD Index
January 17, 2024, 12:19 PM -
Status
Soaring USD is SO Unsurprising – And SO Full of Implications
January 16, 2024, 8:40 AM -
Status
Rare Opportunity in Rare Earth Minerals?
January 15, 2024, 2:06 PM

