

Briefly: in our opinion, full (300% of the regular position size) speculative short positions in junior mining stocks are justified from the risk/reward point of view at the moment of publishing this Alert.
Yesterday’s session was once again quite informative, and so is today’s pre-market trading. In yesterday’s analysis, I emphasized the importance of the relative weakness that we just saw in mining stocks, so let’s start with taking a look at what mining stocks did yesterday.
At first glance, yesterday’s performance might look like a bullish reversal, but zooming in clarifies that something else was actually in the works. Let’s take a look at the GDXJ 1-hour candlestick chart for details.
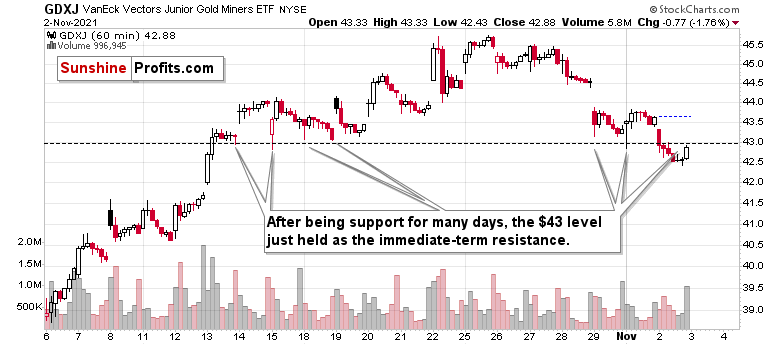
Yesterday’s “reversal” was actually a breakdown below the previous (mid-October) intraday lows along with the verification thereof. The GDXJ moved below the above-mentioned lows and – while it moved back up – it ended the session below them.
This is a bearish type of session.
Also, if you were wondering about the high volume in the final hour of trading – that’s relatively normal as that’s when bigger trades tend to take place.
And while mining stocks were busy verifying the breakdown, gold tried to break above its declining, red resistance line, and verify that breakout.
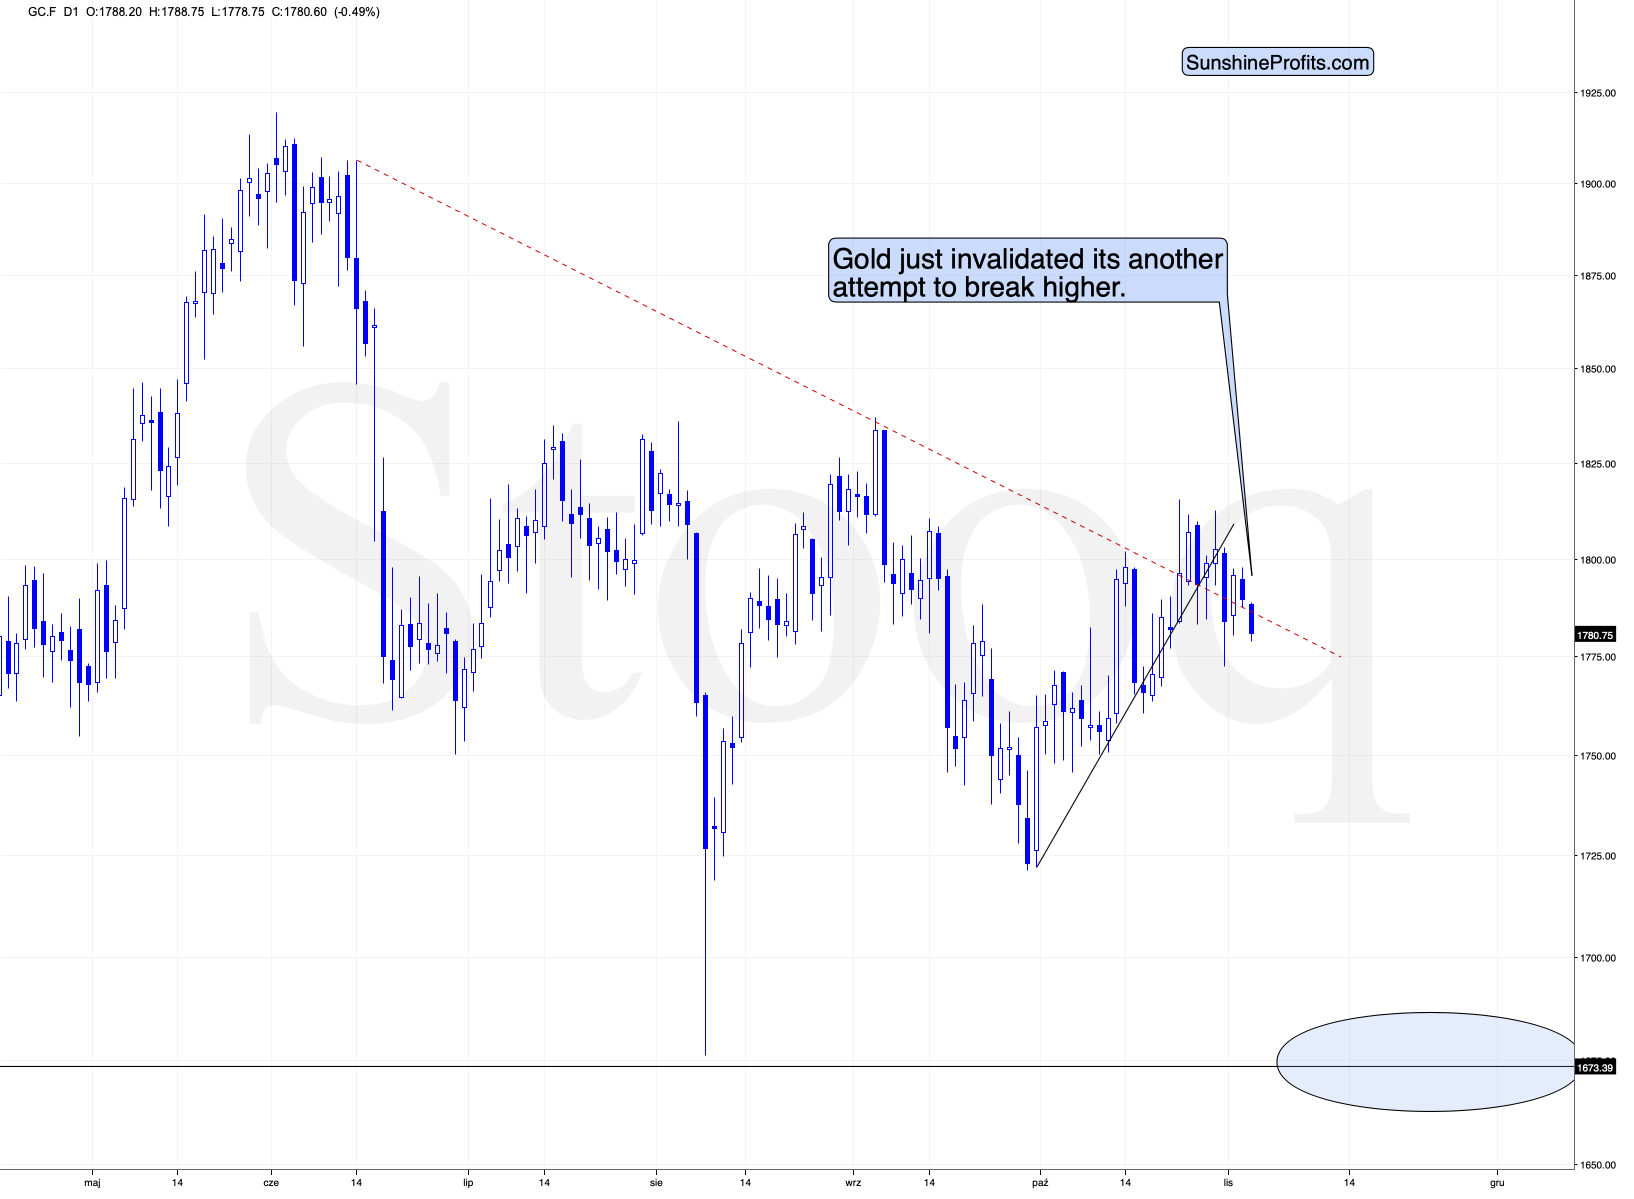
While yesterday’s session didn’t bring much lower gold prices (and the invalidation), today’s pre-market trading makes it clear that the attempt to break higher failed. Just like I had indicated yesterday.
This time the rising short-term support line is not there to prevent further declines as the breakdown below it was also confirmed.
What does it mean? It means that gold is likely to fall, and quite likely it’s going to fall hard.
Besides, silver price is after a major short-term breakdown, too.
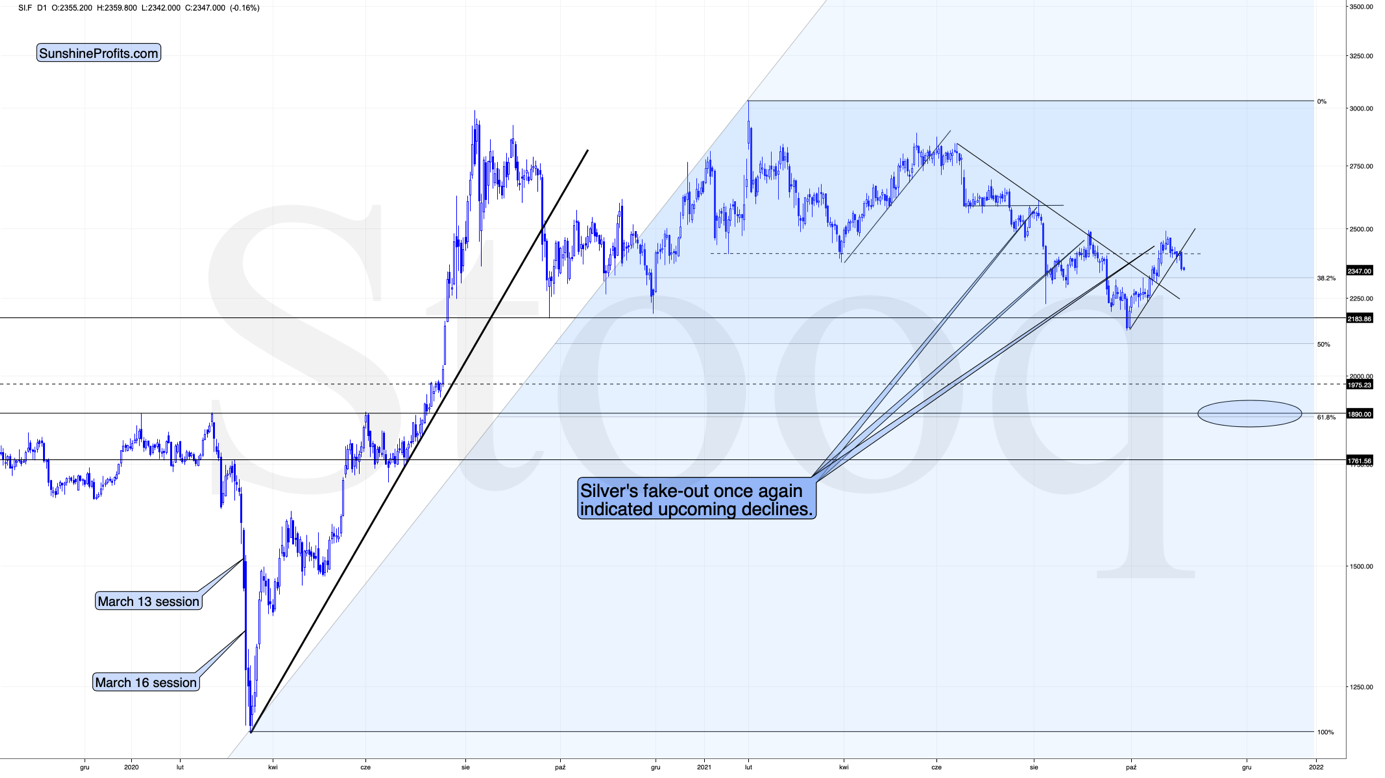
After a powerful short-term rally, silver had reversed, and now it broke below its rising support line. That’s yet another bearish indication. Please note that at first silver was reluctant to decline while mining stocks moved decisively lower, which was normal during the early part of a given decline. Silver did some catching-up action yesterday, but since miners are not showing strength, I’d say that we’re getting to the regular part of a short-term move, not close to its end.
And the move lower is likely to continue, just as the move higher is likely to continue in case of the USD Index.
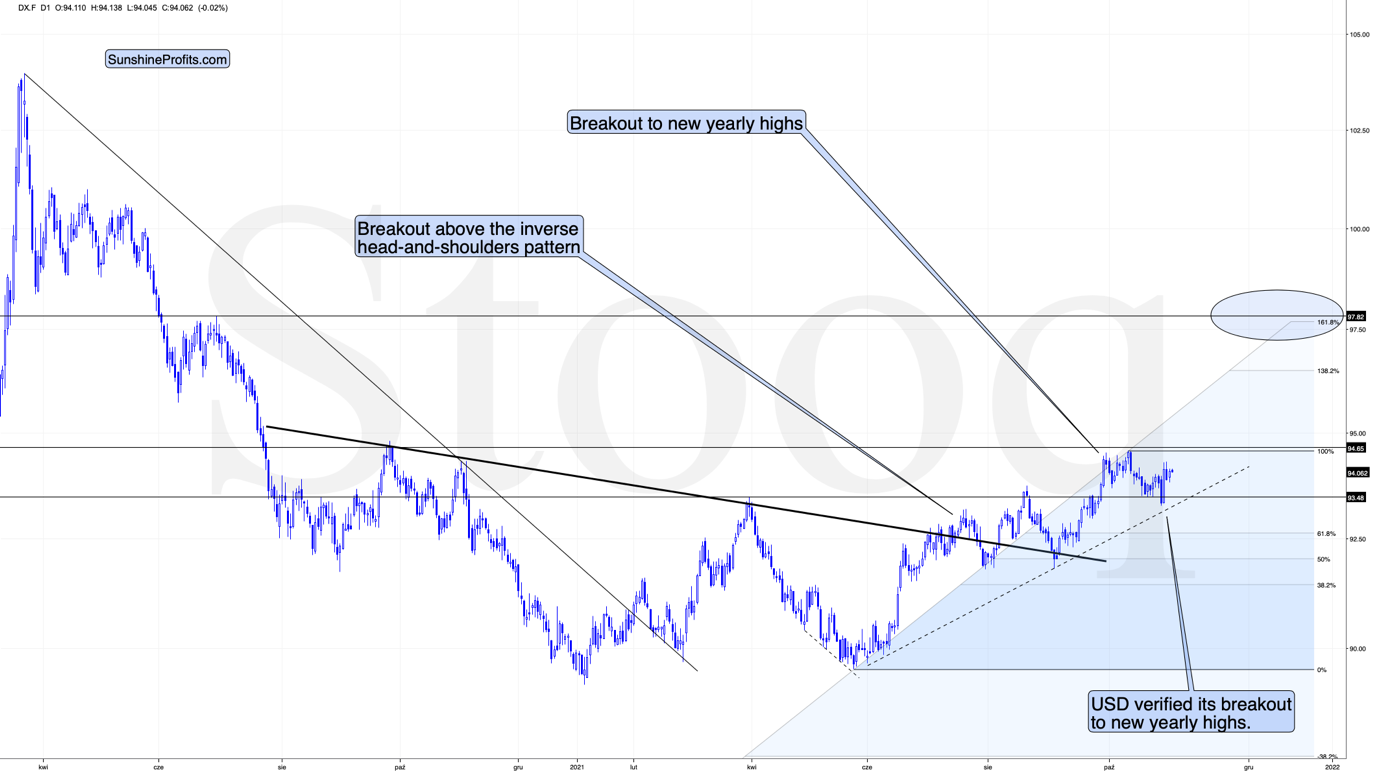
The USDX is after a verification of the breakout to new 2021 highs and after an about monthly consolidation above them. This is a perfect starting point for a major upswing, and we’re likely to see one soon.
All in all, while the outlook for the precious metals sector is very bullish for the following years, it’s very bearish for the following weeks.
Having said that, let’s take a look at the markets from a more fundamental point of view.
Nowhere to Hide
With Fed Chairman Jerome Powell taking center stage today, his “transitory” narrative is all but dead. And while a tapering announcement is a near certainty, his characterization of inflation will provide a window into the FOMC’s next move. As we await, the majority of investment banks expect liftoff in 2022 and Goldman Sachs expects that lingering inflation will elicit two rate hikes in 2022.
Please see below:
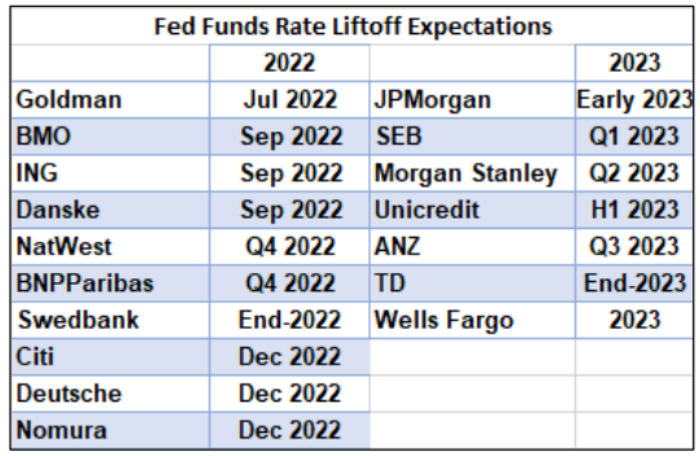 Source: Nordea
However, while Powell will likely downplay the need for a higher federal funds rate, inflationary winds should blow that forecast out of the water.
To explain, the Institute for Supply Management (ISM) released its Manufacturing PMI on Nov. 1. And while the headline index decreased from 61.1 in September to 60.8 in October, the report revealed:
“The ISM Prices Index registered 85.7 percent, an increase of 4.5 percentage points compared to the September reading of 81.2 percent, indicating raw materials prices increased for the 17th consecutive month, at a faster rate in October. This is the 14th month in a row that the index has been above 60 percent and the 11th straight month it has exceeded 70 percent.
“In October, all 18 industries reported paying increased prices for raw materials.”
As double trouble, IHS Markit also released its U.S. Manufacturing PMI on Nov. 1. And while the headline index declined from 60.7 in September to 58.4 in October, inflationary pressures reached new all-time highs:
“October saw U.S. manufacturers report yet another near-record lengthening of supply chains,” said Chris Williamson, Chief Business Economist at IHS Markit. “This shortfall of production relative to demand was the principal driving force behind a survey record rise in manufacturers’ selling prices, suggesting that inflationary pressures continue to build and look unlikely to abate to any significant degree anytime soon.”
Please see below:
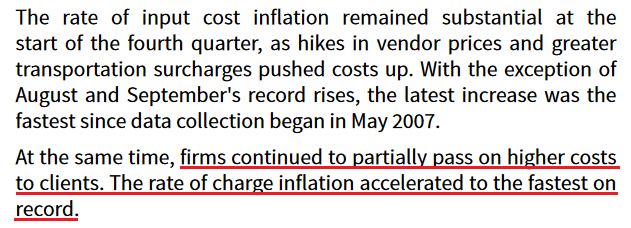 Source: IHS Markit
Making three of a kind, the Kansas City Fed released its Tenth District Manufacturing Survey on Oct. 28. And unlike its predecessors, the headline index increased from 22 in September to 31 in October. However, with inflationary winds blowing hard in the Midwest, it was another month and another record high.
Please see below:
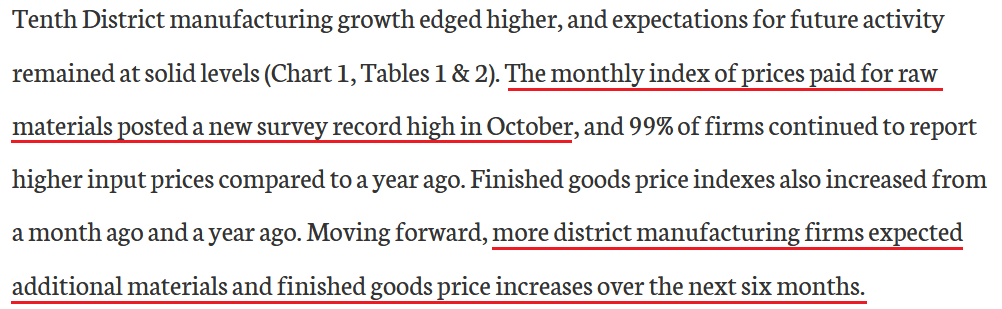 Source: KC Fed
If that wasn’t enough, I’ve been warning for months that rent inflation is poised to uplift the Shelter Consumer Price Index (CPI). For context, the index hit a 2021 high in September (the latest release) after increasing by 3.2% year-over-year (YoY). However, rent inflation is still far from its peak.
To explain, Invitation Homes – the largest landlord in the U.S. with more than 80,000 single-family rental properties – released its third-quarter earnings on Oct. 28. CEO Dallas Tanner said:
“Home price appreciation has been fairly dramatic in, say, the last 12 to 18 months…. I was looking at the Case-Shiller numbers from this point in time last year. And on a look-back basis, it was like 6%. And if you look at our market, it's like 22% right now. It's just – it's a little bit crazy, and it's a moment in time where we're feeling the supply chain challenge, and there just isn't enough quality housing available right now…..
“We've just been lucky as operators that the environment or the marketplace doesn't have enough supply, so it's supporting the rate growth in a similar fashion.”
And speaking of “rate growth:”
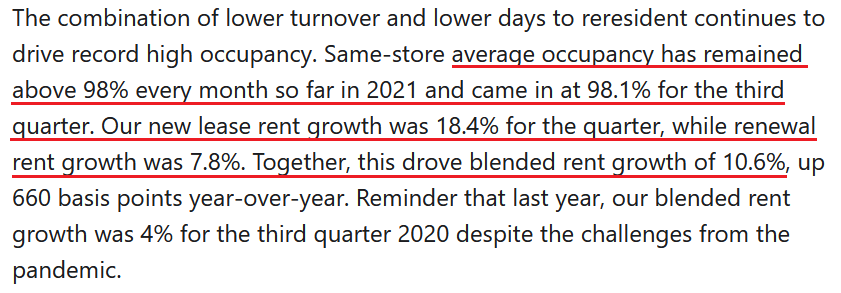 Source: Invitation Homes/The Motley Fool
For context, “rent growth” means that rent inflation was more than 18% YoY on new leases and roughly 8% YoY on renewed leases in Q3. As a result, the 3.2% YoY increase in September’s Shelter CPI doesn’t reflect the reality on the ground.
On top of that, wage inflation is still far from its peak. For example, Starbucks – the world's largest coffeehouse chain with 16,826 North American stores as of Oct. 3 – released its fourth-quarter earnings on Oct. 28. CEO Kevin Johnson said:
“Effective in January, partners with two or more years of service will get up to a 5% raise and partners with five or more years will get up to a 10% raise, in keeping with our long-standing history of investing in our partners. And next summer, hourly partners in the U.S. will make an average of nearly $17 an hour with Barista rates ranging from $15 to $23 an hour across the country.”
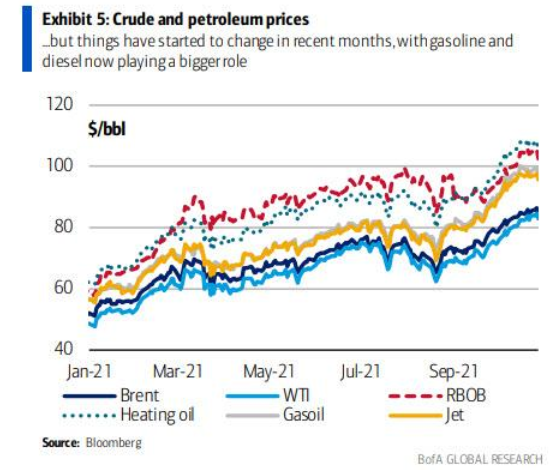
And circling back to raw materials, oil bulls have upped the ante once again. To explain, Bank of America commodities analyst Francisco Blanch told clients on Oct. 29 that he expects Brent to reach $120 per barrel by the end of June 2022.
“Pent-up demand for oil was the main reason we laid out a $100 target for Brent in 2022 back in June,” wrote Blanch. “Yet we now believe that the run-up in global gas and coal prices has turbocharged the Brent and WTI price recovery.
“As we look into 2022 and 2023… structural oil demand and supply rigidities are emerging, and we now forecast Brent and WTI crude oil prices will average $85/bbl and $75 and $82 and $70 in 2022 and 2023, respectively, compared to $75 and $65 (for Brent) and $71 and $61 (for WTI) prior…. We also raise our end-1H22 Brent oil price target to $120/bbl.”
Please see below:
Finally, with inflation coming at the U.S. economy from all angles, Bank of America’s tracker of “persistent inflation” continues to make new 2021 highs.
Please see below:
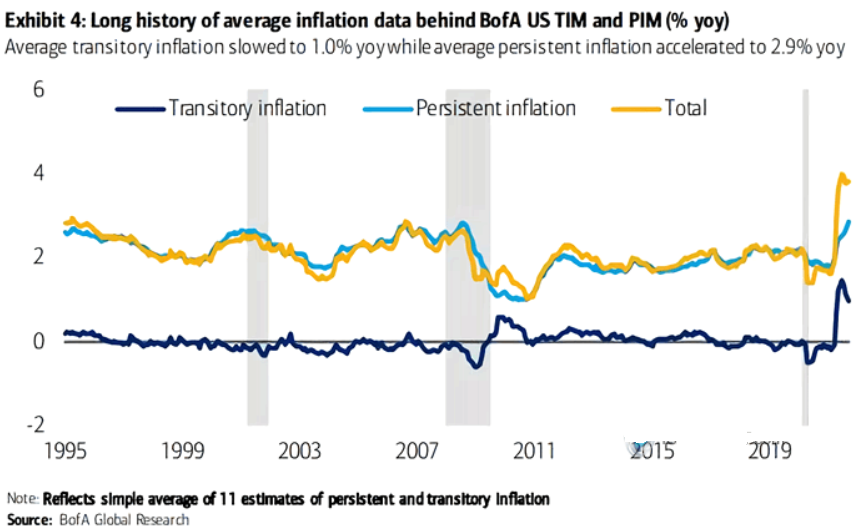
To explain, the dark blue line above tracks “transitory inflation,” while the light blue line above tracks “persistent inflation.” If you analyze the right side of the chart, you can see that while the dark blue line has come down recently, the light blue line is still seeking higher ground. As a result, if Powell preaches patience, he runs the risk of a much bigger problem down the road.
The bottom line? With the Fed’s hawkish shift more of a walk than a run, slowly the “transitory” narrative faded and officials realized that tapering was necessary. However, while Powell’s next move may be to talk down potential rate hikes, the FOMC remains materially behind the inflation curve. As a result, another hawkish shift should materialize in the coming months and the Fed’s impending war on inflation should leave the PMs suffering major casualties.
In conclusion, the PMs declined on Nov. 2 and gold mining stocks were noticeable underperformers. And with the EUR/USD falling and the USD Index rising, more pain should materialize over the medium term. Moreover, while Powell will likely walk his usual ‘fine line’ today, he’s running out of inflationary excuses. And with a hawkish FOMC necessary to reduce inflation’s grip on the U.S. economy, Powell will likely come to this realization sooner rather than later.
Overview of the Upcoming Part of the Decline
- It seems to me that the current corrective upswing in gold is over, and the next short-term move lower is about to begin. Since it seems to be another short-term move more than it seems to be a continuation of the bigger decline, I think that junior miners are be likely to (at least initially) decline more than silver.
- It seems that the first stop for gold will be close to its previous 2021 lows, slightly below $1,700. Then it will likely correct a bit, but it’s unclear if I want to exit or reverse the current short position based on that – it depends on the number and the nature of the bullish indications that we get at that time.
- After the above-mentioned correction, we’re likely to see a powerful slide, perhaps close to the 2020 low ($1,450 - $1,500).
- If we see a situation where miners slide in a meaningful and volatile way while silver doesn’t (it just declines moderately), I plan to – once again – switch from short positions in miners to short positions in silver. At this time, it’s too early to say at what price levels this could take place, and if we get this kind of opportunity at all – perhaps with gold close to $1,600.
- I plan to exit all remaining short positions when gold shows substantial strength relative to the USD Index while the latter is still rallying. This might take place with gold close to $1,350 - $1,400. I expect silver to fall the hardest in the final part of the move. This moment (when gold performs very strongly against the rallying USD and miners are strong relative to gold after its substantial decline) is likely to be the best entry point for long-term investments, in my view. This might also happen with gold close to $1,375, but it’s too early to say with certainty at this time. I expect the final bottom to take place near the end of the year, perhaps in mid-December. It is not set in stone that PMs have to bottom at that time. If not then, then early 2022 would become a likely time target. The official start of tapering will serve as an additional indication or confirmation of the bottom.
- As a confirmation for the above, I will use the (upcoming or perhaps we have already seen it?) top in the general stock market as the starting point for the three-month countdown. The reason is that after the 1929 top, gold miners declined for about three months after the general stock market started to slide. We also saw some confirmations of this theory based on the analogy to 2008. All in all, the precious metals sector is likely to bottom about three months after the general stock market tops. The additional confirmation will come from the tapering schedule, as markets are likely to move on the rumor and reverse on the fact as they tend to do in general.
- The above is based on the information available today, and it might change in the following days/weeks.
You will find my general overview of the outlook for gold on the chart below:
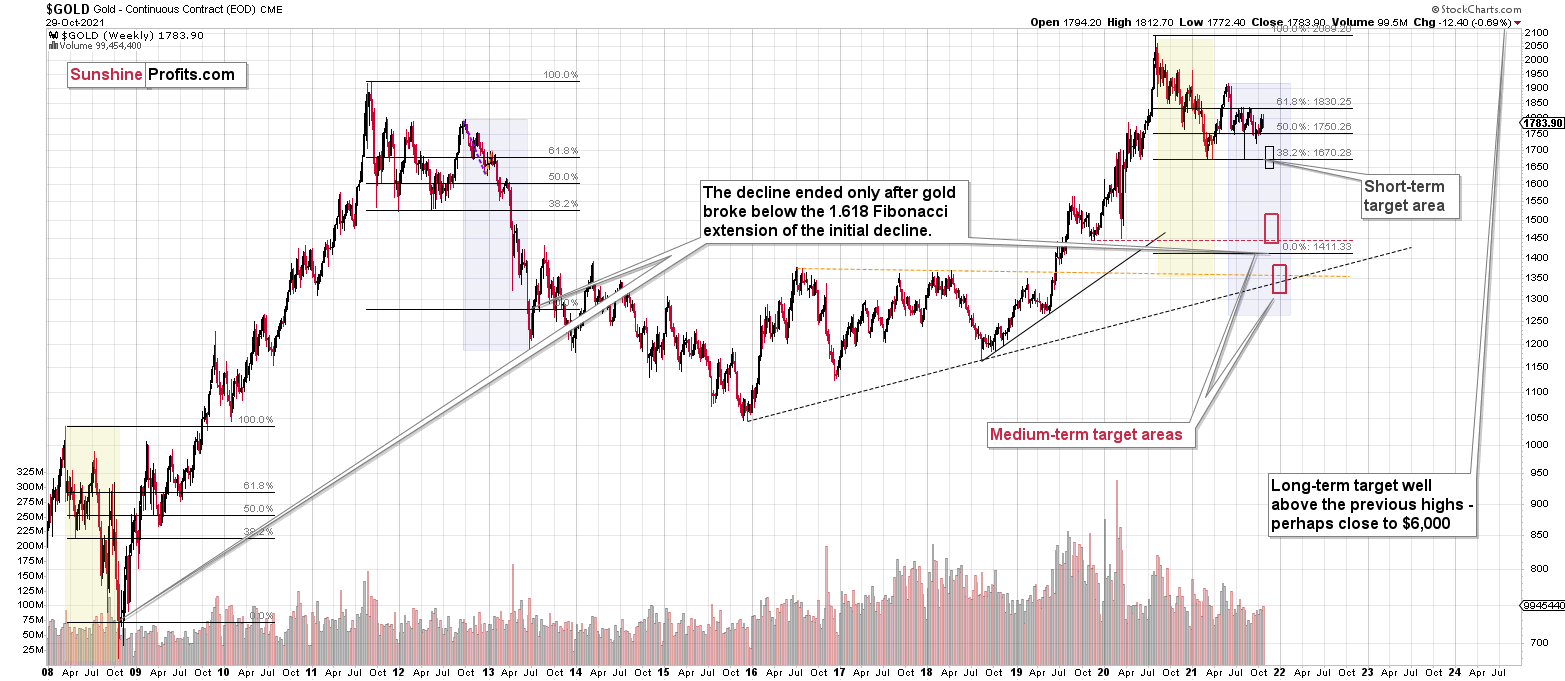
Please note that the above timing details are relatively broad and “for general overview only” – so that you know more or less what I think and how volatile I think the moves are likely to be – on an approximate basis. These time targets are not binding or clear enough for me to think that they should be used for purchasing options, warrants or similar instruments.
Summary
To summarize, the outlook for the precious metals sector remains extremely bearish for the next few months. Since it seems that the PMs are starting another short-term move lower more than it seems that they are continuing their bigger decline, I think that junior miners would be likely to (at least initially) decline more than silver.
From the medium-term point of view, the key two long-term factors remain the analogy to 2013 in gold and the broad head and shoulders pattern in the HUI Index. They both suggest much lower prices ahead.
It seems that our profits from the short positions are going to become truly epic in the following months.
After the sell-off (that takes gold to about $1,350 - $1,500), I expect the precious metals to rally significantly. The final part of the decline might take as little as 1-5 weeks, so it's important to stay alert to any changes.
Most importantly, please stay healthy and safe. We made a lot of money last March and this March, and it seems that we’re about to make much more on the upcoming decline, but you have to be healthy to enjoy the results.
As always, we'll keep you - our subscribers - informed.
By the way, we’re currently providing you with the possibility to extend your subscription by a year, two years, or even three years with a special 20% discount. This discount can be applied right away, without the need to wait for your next renewal – if you choose to secure your premium access and complete the payment upfront. The boring time in the PMs is definitely over, and the time to pay close attention to the market is here. Naturally, it’s your capital, and the choice is up to you, but it seems that it might be a good idea to secure more premium access now while saving 20% at the same time. Our support team will be happy to assist you in the above-described upgrade at preferential terms – if you’d like to proceed, please contact us.
To summarize:
Trading capital (supplementary part of the portfolio; our opinion): Full speculative short positions (300% of the full position) in junior mining stocks are justified from the risk to reward point of view with the following binding exit profit-take price levels:
Mining stocks (price levels for the GDXJ ETF): binding profit-take exit price: $35.73; stop-loss: none (the volatility is too big to justify a stop-loss order in case of this particular trade)
Alternatively, if one seeks leverage, we’re providing the binding profit-take levels for the JDST (2x leveraged) and GDXD (3x leveraged – which is not suggested for most traders/investors due to the significant leverage). The binding profit-take level for the JDST: $16.18; stop-loss for the JDST: none (the volatility is too big to justify a SL order in case of this particular trade); binding profit-take level for the GDXD: $32.08; stop-loss for the GDXD: none (the volatility is too big to justify a SL order in case of this particular trade).
For-your-information targets (our opinion; we continue to think that mining stocks are the preferred way of taking advantage of the upcoming price move, but if for whatever reason one wants / has to use silver or gold for this trade, we are providing the details anyway.):
Silver futures downside profit-take exit price: $19.12
SLV profit-take exit price: $17.72
ZSL profit-take exit price: $41.38
Gold futures downside profit-take exit price: $1,683
HGD.TO – alternative (Canadian) inverse 2x leveraged gold stocks ETF – the upside profit-take exit price: $12.48
HZD.TO – alternative (Canadian) inverse 2x leveraged silver ETF – the upside profit-take exit price: $30.48
Long-term capital (core part of the portfolio; our opinion): No positions (in other words: cash
Insurance capital (core part of the portfolio; our opinion): Full position
Whether you already subscribed or not, we encourage you to find out how to make the most of our alerts and read our replies to the most common alert-and-gold-trading-related-questions.
Please note that we describe the situation for the day that the alert is posted in the trading section. In other words, if we are writing about a speculative position, it means that it is up-to-date on the day it was posted. We are also featuring the initial target prices to decide whether keeping a position on a given day is in tune with your approach (some moves are too small for medium-term traders, and some might appear too big for day-traders).
Additionally, you might want to read why our stop-loss orders are usually relatively far from the current price.
Please note that a full position doesn't mean using all of the capital for a given trade. You will find details on our thoughts on gold portfolio structuring in the Key Insights section on our website.
As a reminder - "initial target price" means exactly that - an "initial" one. It's not a price level at which we suggest closing positions. If this becomes the case (like it did in the previous trade), we will refer to these levels as levels of exit orders (exactly as we've done previously). Stop-loss levels, however, are naturally not "initial", but something that, in our opinion, might be entered as an order.
Since it is impossible to synchronize target prices and stop-loss levels for all the ETFs and ETNs with the main markets that we provide these levels for (gold, silver and mining stocks - the GDX ETF), the stop-loss levels and target prices for other ETNs and ETF (among other: UGL, GLL, AGQ, ZSL, NUGT, DUST, JNUG, JDST) are provided as supplementary, and not as "final". This means that if a stop-loss or a target level is reached for any of the "additional instruments" (GLL for instance), but not for the "main instrument" (gold in this case), we will view positions in both gold and GLL as still open and the stop-loss for GLL would have to be moved lower. On the other hand, if gold moves to a stop-loss level but GLL doesn't, then we will view both positions (in gold and GLL) as closed. In other words, since it's not possible to be 100% certain that each related instrument moves to a given level when the underlying instrument does, we can't provide levels that would be binding. The levels that we do provide are our best estimate of the levels that will correspond to the levels in the underlying assets, but it will be the underlying assets that one will need to focus on regarding the signs pointing to closing a given position or keeping it open. We might adjust the levels in the "additional instruments" without adjusting the levels in the "main instruments", which will simply mean that we have improved our estimation of these levels, not that we changed our outlook on the markets. We are already working on a tool that would update these levels daily for the most popular ETFs, ETNs and individual mining stocks.
Our preferred ways to invest in and to trade gold along with the reasoning can be found in the how to buy gold section. Furthermore, our preferred ETFs and ETNs can be found in our Gold & Silver ETF Ranking.
As a reminder, Gold & Silver Trading Alerts are posted before or on each trading day (we usually post them before the opening bell, but we don't promise doing that each day). If there's anything urgent, we will send you an additional small alert before posting the main one.
Thank you.
Przemyslaw Radomski, CFA
Founder, Editor-in-chief

