

Briefly: in our opinion, full (300% of the regular position size) speculative short positions in junior mining stocks are justified from the risk/reward point of view at the moment of publishing this Alert.
In Wednesday’s analysis, I focused on the specific situation in the currency market and its impact on the gold price. I told you that the USD Index was probably forming a short-term top, while the Euro Index was forming a short-term low. But I also wrote that – despite their usual link – this time, the decline in the USDX could actually make the gold price move lower, not higher. And that’s exactly what we saw yesterday. Specifically, I wrote the following:
“Bullish” or “bearish” refers to the future, not the past. In fact, the rally in the USD Index might need a breather as all markets – no matter how bullish or bearish they are – can’t rise or decline in a straight line without periodic corrections. The USD Index, gold, silver, mining stocks, and practically all the other markets are no exception to this rule. Even real estate prices don’t increase in the long run without periodic downturns.
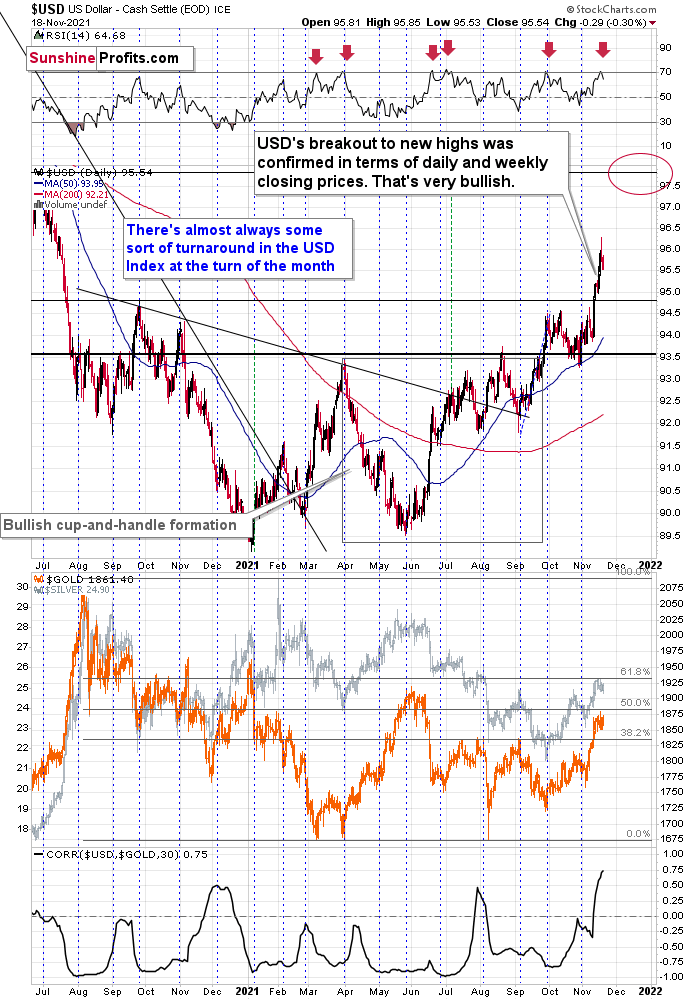
As you can see on the chart above, the U.S. currency index soared to almost 96 yesterday, and that was after an almost straight-up rally. That rally caused the RSI indicator to move above 70, which has been a quite precise short-term sell signal this year. In fact, in all the cases when we saw it, some kind of short-term correction followed.
Based on the size of the current rally, the current situation seems very similar to that of early March and late June. Back then, we saw short-term declines that took the USDX approximately a full index point lower. In the current case, this could mean a decline back to 95. This would be a perfectly natural thing for the USD Index to do right now, as the previous resistance (which is now serving as support) is located slightly below 95. The support is provided by the late-2020 high and the March 2020 low (not visible in the chart above).
“So, surely this corrective downswing in the USD Index would cause an even bigger rally in the precious metals sector, right?”
This is where things get complicated.
You see, the biggest (over 50%) part of the USD Index (which is a weighted average) is the EUR/USD currency pair. Let’s take a look at it.
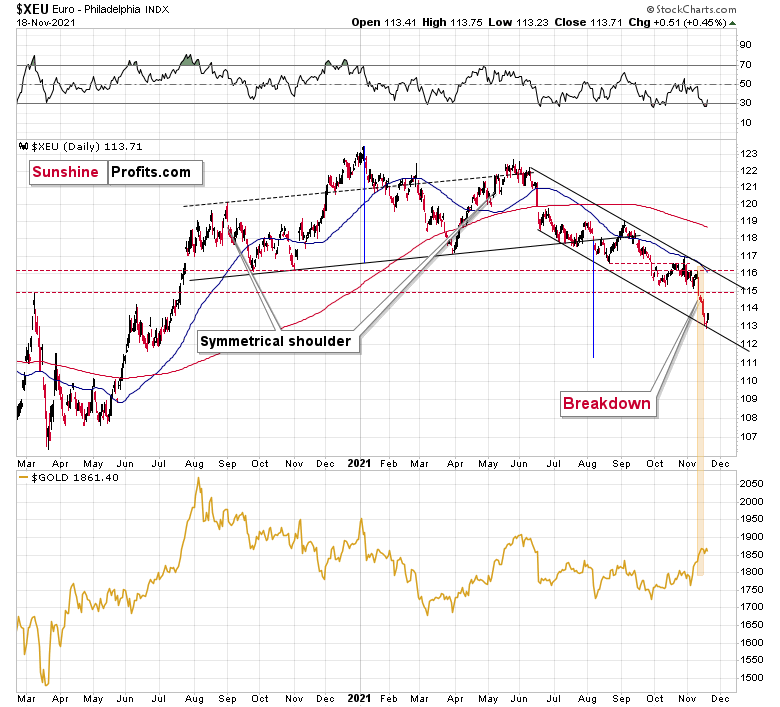
The Euro Index has dropped significantly over the past week and just as the RSI based on the USD Index flashed a sell signal, the RSI based on the Euro Index flashed a buy signal.
Also, the Euro Index just moved to the lower border of its declining trade channel, which is likely to indicate some kind of rebound.
Why am I discussing the euro here? Because that’s what’s complicated about the current USD-gold link.
The euro has recently declined and the prices of silver and gold have rallied shortly after the dovish comments from the eurozone. Namely, while the expansionary nature of fiscal and monetary policy decisions in the U.S. might be after its peak (with the infrastructure bill signed even despite high inflation numbers), the eurozone is far from limiting its expansionary (i.e. inflationary) policies and it has been made clear recently.
That was bearish for the euro and bullish for the gold price – as more money (in this case euros) would be chasing the same amount of physical gold bars.
The point here is that it might have been the decline in the value of the European currency that caused gold to rally, and it had little to do with what happened in the USD Index.
Don’t get me wrong, most of the time, the gold-USD link is stable and negative. In some cases, gold shows strength or weakness by refusing to move in line (and precisely: again) with the U.S. dollar’s movement. But in this case, it seems that it’s not about the U.S. dollar at all (or mostly), but rather about what happened in the eurozone and euro recently.
I marked the recent decline in the euro and the rally in gold with a golden rectangle.
The usual link between gold and USD would make one assume that lower USD Index values (due to higher EUR/USD values) would trigger a gold rally. However, given how things worked and the fact that we saw/heard the news coming from the Eurozone, it seems like this “temporary” and bearish for the PMs interpretation would actually prevail. It could also be the case that we see some kind of mixed reply from the precious metals sector when the USD Index and the Euro Index correct. The PMs could for example fall only after the situation regarding gold-USD link gets back to normal, that is perhaps after both currencies have corrected.
This is exactly what happened yesterday. The Euro Index moved higher, the USD Index moved lower, and gold – instead of soaring – declined.
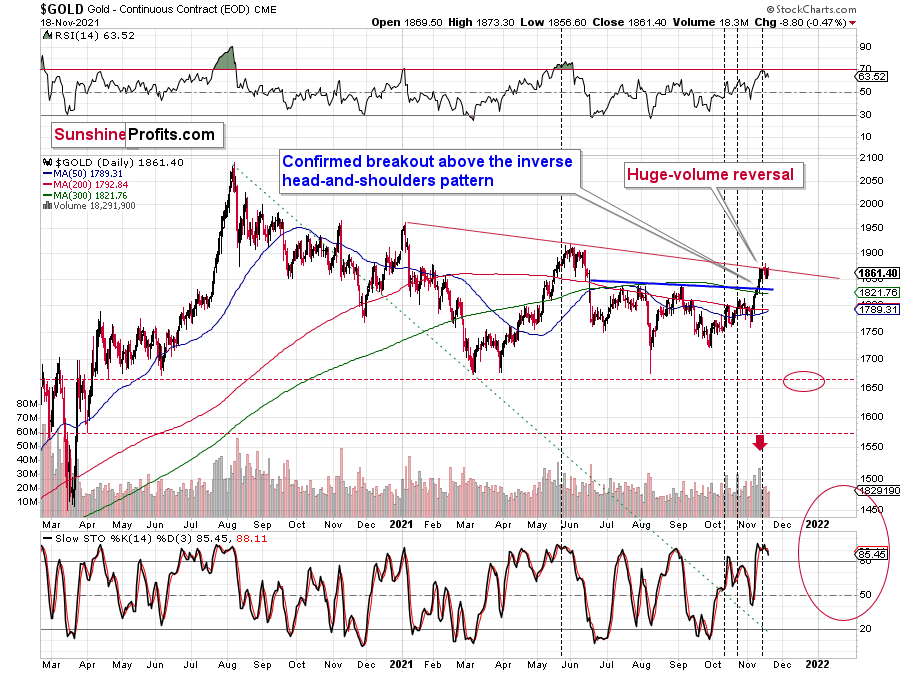
The USD Index ended the day 0.29 lower and gold declined by $8.80. That happened right after gold failed to break above its declining red resistance line. In other words, it seems quite likely that the top is in.
The RSI indicator was just close to 70, which is something that we usually see at the major tops. The sell signal from the Stochastic indicator confirms the bearish outlook as well.
Gold bulls likely expected that based on USD’s decline gold would break above the declining red resistance line, but the opposite happened. The rally in the precious metals market may have already run its course. In fact, it could be the case that the price of gold will soon invalidate the previous breakout above its inverse head and shoulders pattern. And when that happens, a very quick slide could follow.
Also, in today’s pre-market trading (at the moment of writing these words), the USD Index futures are up by 0.49, while gold is down by $0.30 (so it’s basically flat). This shows us that gold is likely transitioning from the stage where its rallies were euro-weakness based to a stage where its rallies would be USD-weakness based. And more precisely, where gold’s declines would be based on the strength of the USD Index.
As far as mining stocks are concerned, the situation remains just as I had described it previously:
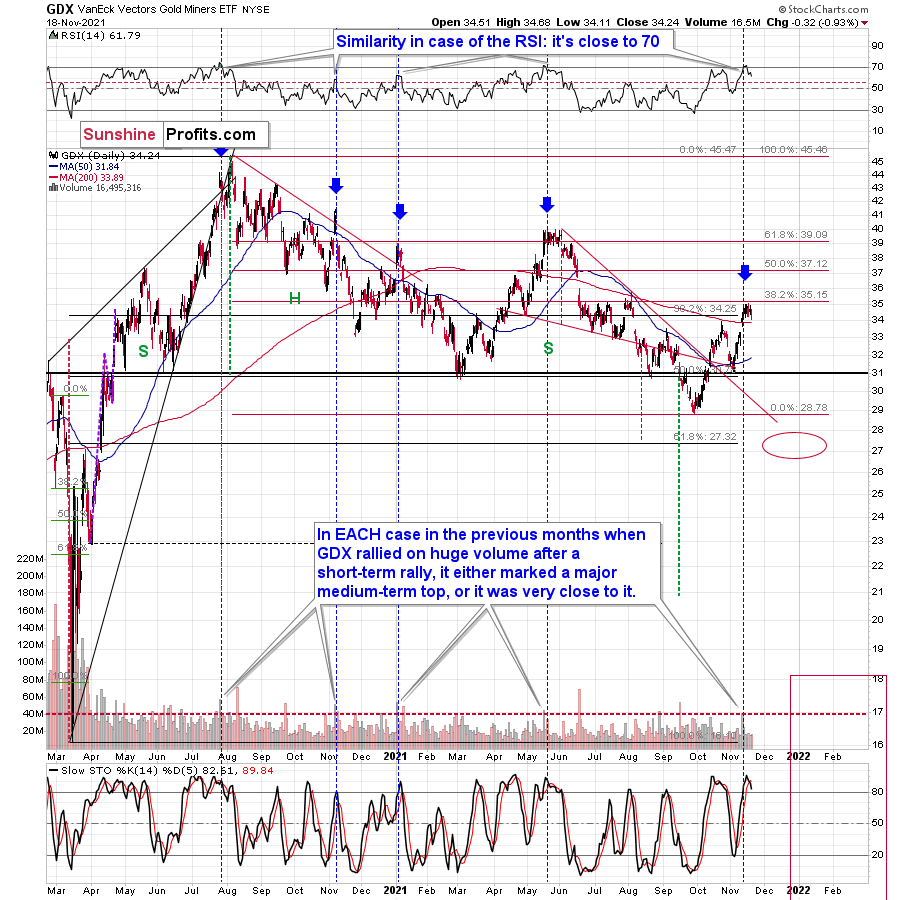
To explain, the GDX ETF rallied on huge volume on Nov. 11 and there were only 4 cases in the recent past when we saw something like that after a visible short-term rally.
In EACH of those 4 cases, the GDX was after a sharp daily rally.
In EACH of those 4 cases, the GDX-based RSI indicator (upper part of the chart above) was trading close to 70.
The rallies that immediately preceded these 4 cases:
- The July 27, 2020 session was immediately preceded by a 29-trading-day rally that took the GDX about 42% higher. It was 7 trading days before the final top (about 24% of the time).
- The November 5, 2020 session was immediately preceded by a 5-trading-day rally that took the GDX about 14%-15% higher (the high-volume day / the top). It was 1 trading day before the final top (20% of the time).
- The January 4, 2021 session was immediately preceded by a 26-trading-day rally that took the GDX about 17%-18% higher (the high-volume day / the top). It was 1 trading day before the final top (about 4% of the time).
- The May 17, 2021 session was immediately preceded by a 52-trading-day rally that took the GDX about 30% higher. It was 7 trading days before the final top (about 13% of the time).
So, as you can see these sessions have even more in common than it seemed at the first sight. The sessions formed soon before the final tops (4% - 24% of the time of the preceding rally before the final top), but the prices didn’t move much higher compared to how much they had already rallied before the high-volume sessions.
Consequently, since history tends to rhyme, we can expect the GDX ETF to move a bit higher here (but not significantly so) and we can expect this extra move higher to take between additional 0 to 7 trading days (based on the Nov. 12 session, so as of Nov. 19, it’s between 0 and 2 trading days). That is, if the final top didn’t form on Nov. 16.
Why 0 – 2 trading days (as of today – Nov. 18)? Because with the 4% timeline now in the rearview, the latter represents the updated 24% timeframe based on the preceding rally (that took 30 trading days).
Since it’s unlikely to take the mining stocks much higher, and the reversal could take place as soon as today, I don’t think that making adjustments to the current short positions in the mining stocks is justified from the risk to reward point of view.
Is there a meaningful resistance level that would be likely to trigger a decline in mining stocks? Yes! The GDX ETF is just below its 38.2% Fibonacci retracement level based on the August 2020 – September 2021 decline. The resistance is slightly above $35, so that’s when the final top could form.
As a result, those historical readings provided us with great shorting opportunities. And while I’m not increasing my short position, if I didn’t already have one in place, I would consider the current setup as offering a great risk-reward proposition.
Also, please note that we saw a fresh sell signal from the GDX-based Stochastic indicator.
Miners moved lower once again yesterday, and the sell signal from the Stochastic indicator is now even clearer.
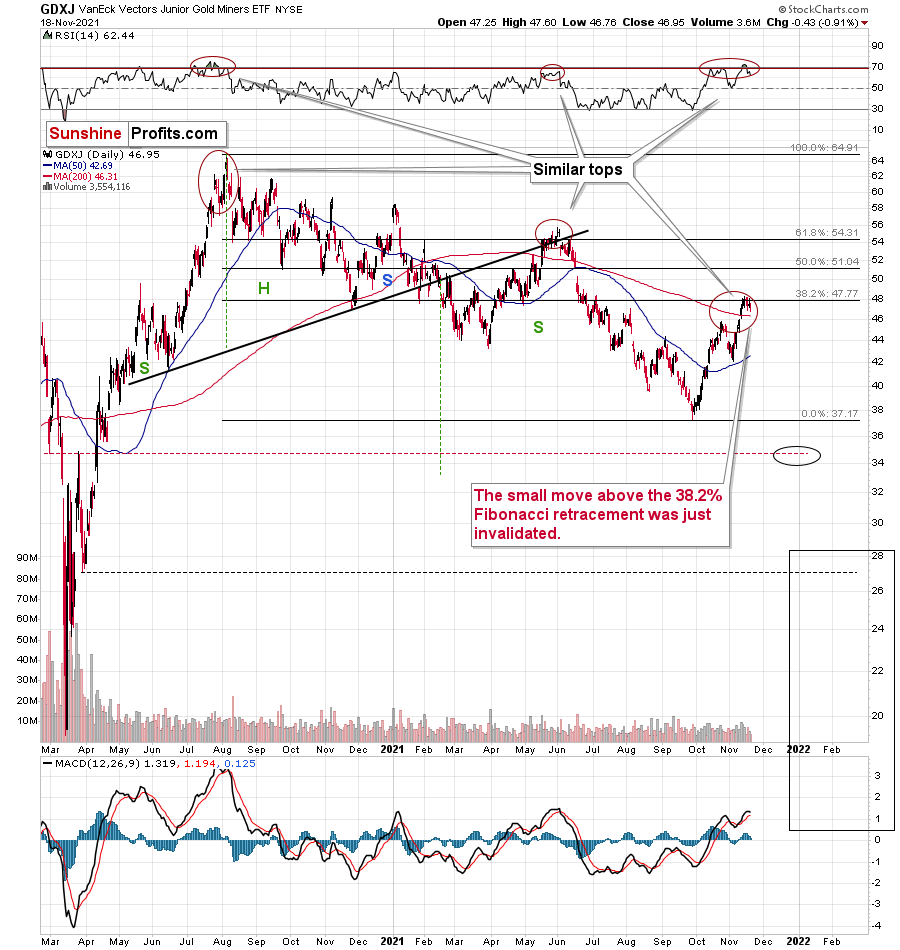
In the case of the GDXJ we see something bearish as well. Just as it is the case with the GDX ETF, the GDXJ ETF is behaving as it did in the case of previous major medium-term tops – the mid-2020 top and the May-June 2021 top. The performance of the RSI indicator confirms it as well.
Please note that the GDXJ ETF recently moved slightly above its 38.2% Fibonacci retracement level, and it then invalidated this small breakout. Invalidations of breakouts are sell signals on their own, and this one perfectly fits other bearish indications that I described earlier today and previously this week.
As it’s usually the case, I will provide you with (much) more context in Monday’s (weekly flagship) Gold & Silver Trading Alert.
And having said that, let’s take a look at the markets from a more fundamental point of view.
Setting the Stage for a Minsky Moment
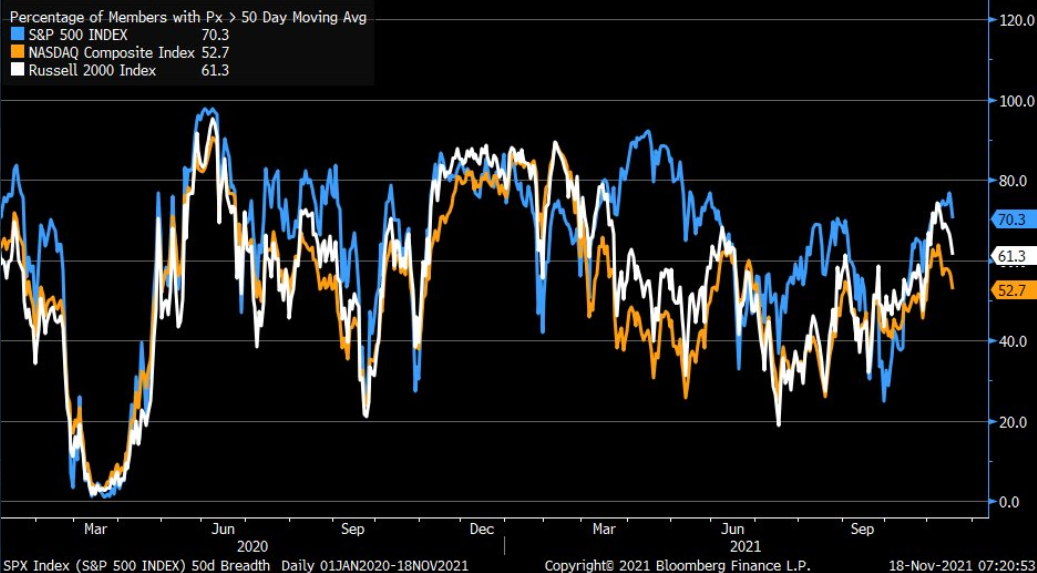
While the USD Index has come off the boil and consolidated in recent days, another upside catalyst could be looming around the corner. To explain, the S&P 500 continues to make a run at new all-time highs. However, while the largest constituents seek higher ground, more and more participants are being left behind.
Please see below:
 Source: Bloomberg/Liz Ann Sonders
To explain, the blue, orange, and white lines above track the number of companies in the S&P 500, the NASDAQ Composite, and the Russell 2000 Index that are trading above their 50-day moving averages. And despite the short-term spike that we witnessed from mid-October, market breadth has declined once again.
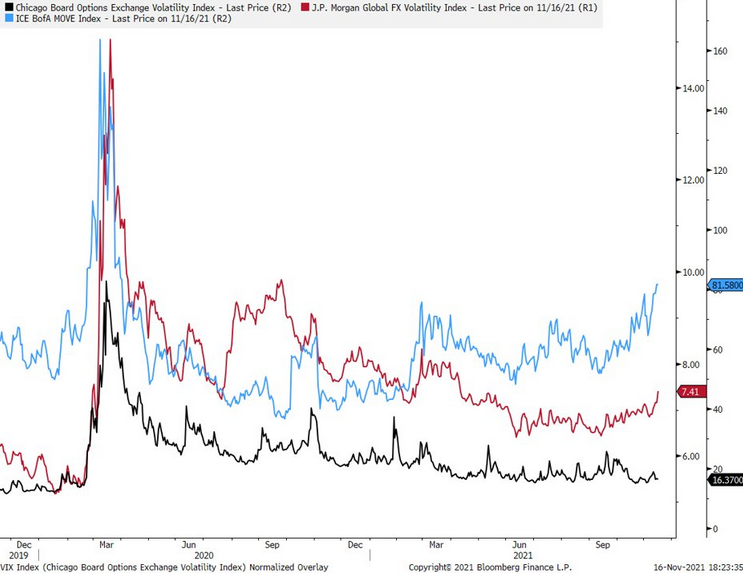
What’s more, while the Cboe Volatility Index (VIX) increased on Nov. 18, stock market volatility pales in comparison to what’s happening in the currency market and the bond market. For context, the VIX is used to quantify the implied volatility of the S&P 500 over the next 30 days.
Please see below:
 Source: Bloomberg/Renaissance Macro
To explain, the light blue line above tracks the Bank of America MOVE Index (bond market volatility), while the red line above tracks the J.P. Morgan Global FX Volatility Index (currency market volatility). If you analyze their movement, you can see that both have risen sharply in recent weeks. However, the black line above tracks the VIX. And with little to no reaction to what’s happening around them, equity investors are setting themselves up for a mini “flash crash”.
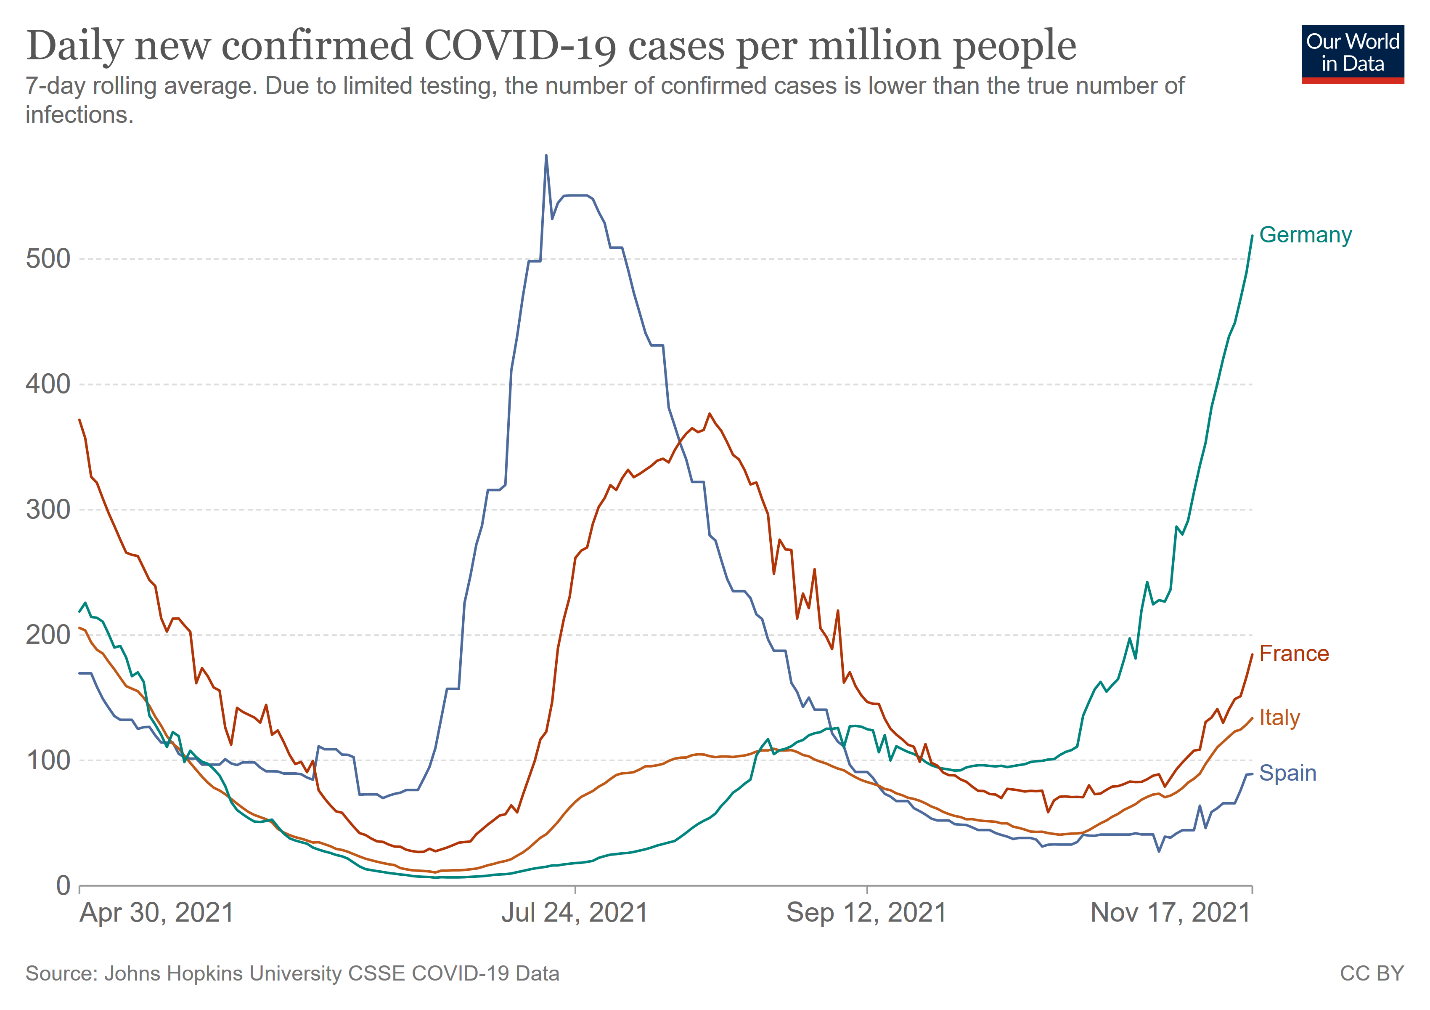
To that point, U.S. coronavirus cases have risen by 20% over the last two weeks. And the important thing to remember is that rising case counts often stifle in-person activities, lower travel demand, and reduce consumer spending. And with the colder weather coming, the stock market has completely ignored these realities.
Please see below:
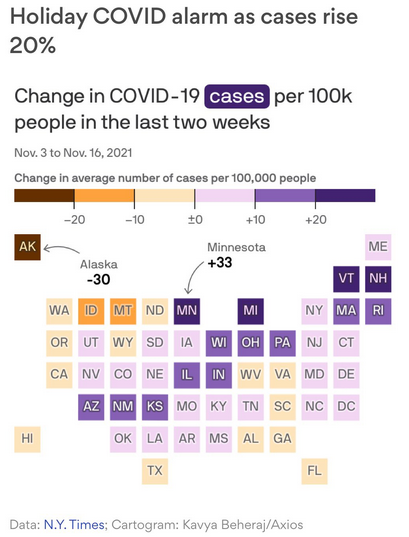
To that point, I wrote on Nov. 17 that COVID-19 cases are on the rise in Germany, France, Italy, and Spain – Europe’s four largest economies. And on Nov. 19, Germany’s daily case count hit a new all-time high and Chancellor Angela Merkel said that a fourth wave is “hitting us with full force.” Likewise, the slope of the rises in France, Italy and Spain have all begun to accelerate.
Please see below:
More importantly, though, while European markets have largely ignored the recent spikes, a sharp sell-off could be the spark that lights the S&P 500’s correction. To explain, the DAX 30 Index (Germany) and the CAC 40 Index (France) both closed slightly lower on Nov. 18. However, prior to Nov. 18, the DAX 30 had closed in the green for 13 of the last 15 trading days, and one-upping its European counterpart, the CAC 40 had closed in the green for 15 of the last 16 trading days.
On top of that, the CAC 40 had an RSI (Relative Strength Index) north of 80, while the DAX 30 had an RSI north of 75. As a result, both indices are materially overbought at a time when Germany is implementing new restrictions. Thus, if a Minsky Moment strikes in Europe, don’t be surprised if the negativity cascades across the Atlantic.
In addition, Bank of America released its latest Global Fund Manager Survey on Nov. 17. And while institutional investors still expect rather pedestrian global growth, they’re piling into equities like there is no tomorrow.
Please see below:
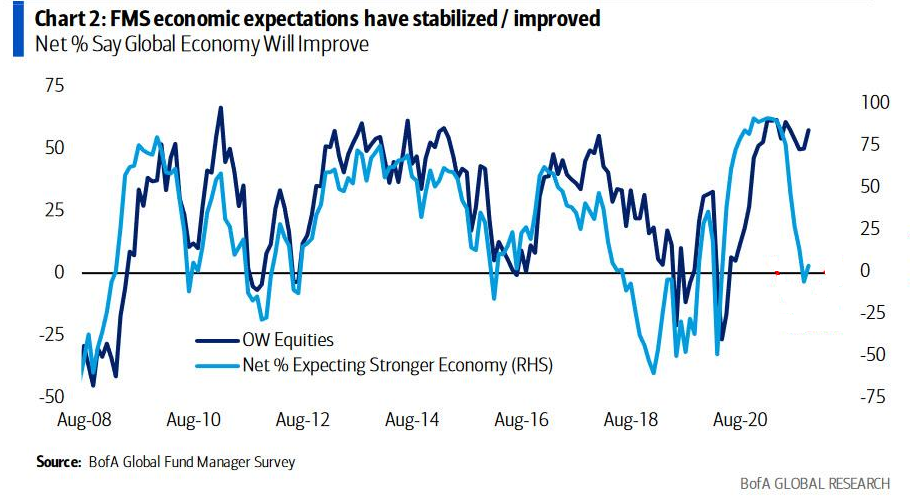
To explain, the dark blue line above tracks the net-percentage of respondents that are overweight equities, while the light blue line above tracks the net-percentage of respondents that expect stronger economic growth. If you analyze the right side of the chart, you can see that intuitional investors’ equity positioning still far exceeds what’s implied from economic growth prospects. As a result, if the dark blue line moves lower and reconnects with the light blue line, plenty of sell orders will hit the market.
Furthermore, while I’ve been warning for months that inflation won’t abate on its own – only the Fed and a stronger U.S. dollar can calm the pricing pressures – institutional investors now expect more rate hikes in 2022.
Please see below:
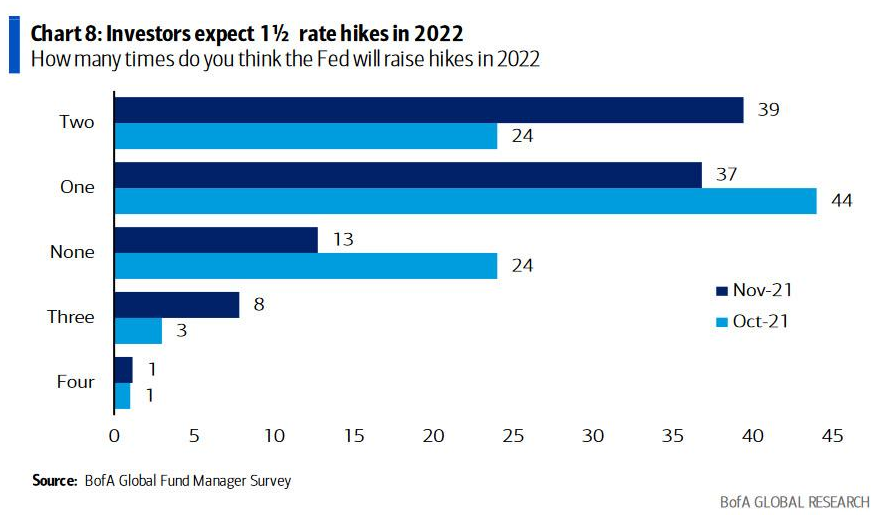
To explain, 24% of respondents in October expected two rate hikes in 2022. However, that number has increased to 39% in November. Likewise, with an average expectation for 1.5 rate hikes in 2022, the chorus is slowly shifting in a hawkish direction.
Despite that, though, institutional investors believe that emerging market (EM) equities will be the best-performing asset class in 2022.
Please see below:
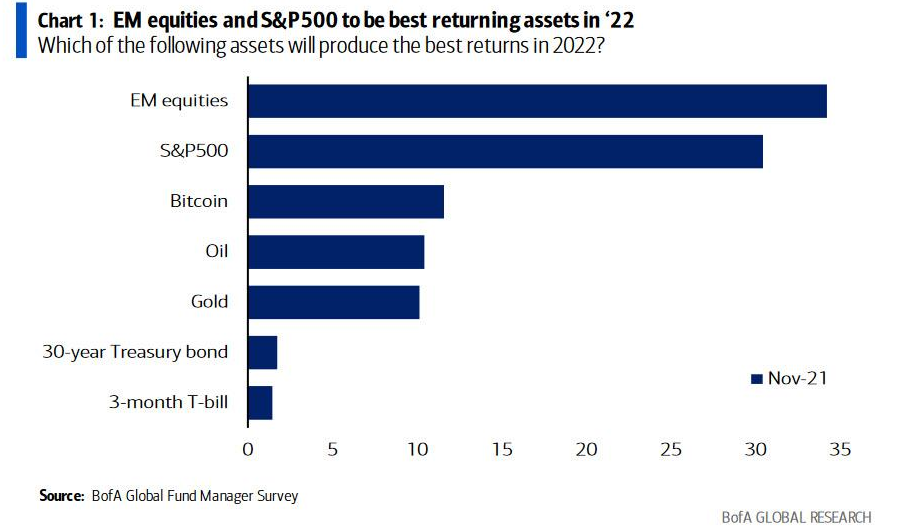
However, if they haven’t gotten the memo, a stronger U.S. dollar is extremely detrimental to EM performance. As such, if (when) the greenback continues its ascent, an unwinding of these EM positions could uplift stock market volatility.
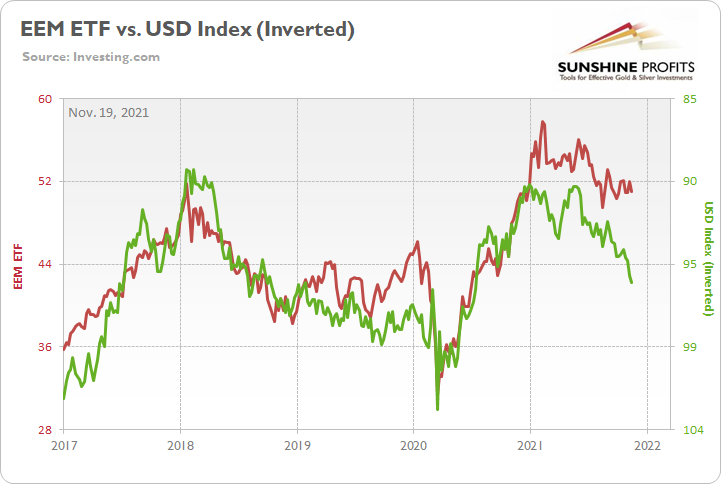
To explain, the red line above tracks the iShares MSCI Emerging Markets ETF (EEM), while the green line above tracks the inverted (scale flipped upside down) USD Index. For context, the EEM ETF has more than $30 billion in net-assets under management as of Nov. 17. If you analyze the relationship, notice how a stronger U.S. dollar (green line falling) often derails EM bull markets? Thus, either the greenback is lying, or disappointment could strike institutional investors in 2022.
Finally, while I’ve been highlighting that a stronger U.S. dollar has the potential to crush commodities, and therefore inflation, the USD Index’s uprising could impact more than just the PMs. And with Bank of America’s Global Fund Manager Survey highlighting just how unprepared institutional investors are for a stronger greenback, a Minsky Moment could strike at any moment.
Please see below:
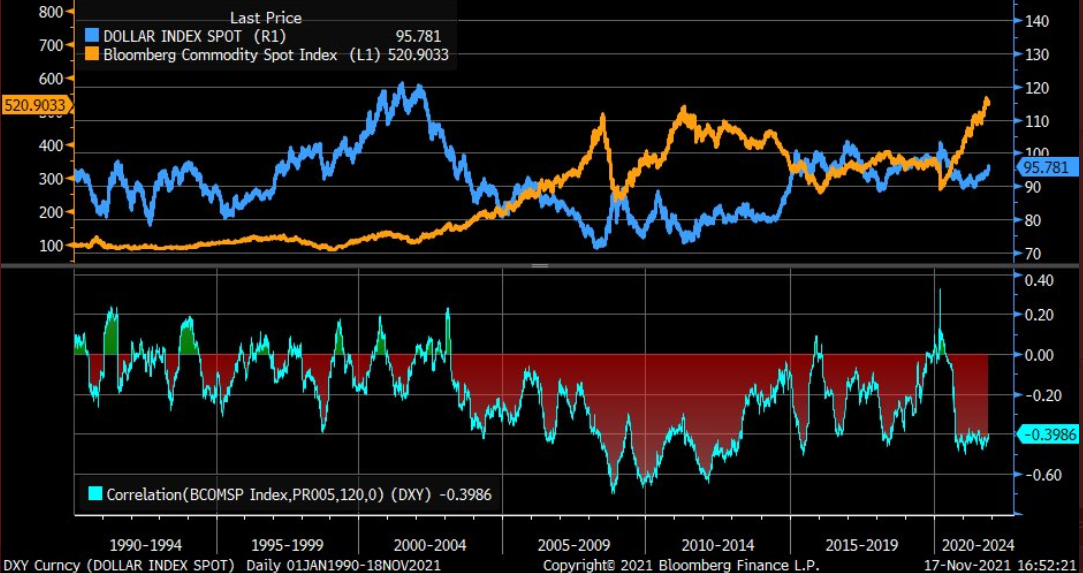 Source: Bloomberg/Liz Ann Sonders
To explain, the blue line above tracks the USD Index, while the orange line above tracks the Bloomberg Commodity Spot Index. If you analyze the bottom half, you can see that the correlation between the pair is roughly -0.40. However, since 2005, when Minsky Moments strike, the correlation often falls below -0.60. As a result, if King Dollar reclaims its currency throne, a sharp re-rating of several assets will likely occur.
The bottom line? Since the U.S. dollar’s technical and fundamental outlooks remain robust, the greenback doesn’t need any help to continue its uptrend. However, after moving too far, too fast, a cooling-off period has been ensured. Similarly, though, with the S&P 500 also moving too far, too fast, a sharp correction could help ignite the U.S. dollar’s next leg higher. And with the PMs often moving inversely to the U.S. dollar, they’ll likely head in the opposite direction.
In conclusion, the PMs declined on Nov. 18, as technical exhaustion has confronted the metals. And despite all of the recent drama, the PMs’ lack of fundamental upside catalysts should hurt their performance over the medium term. Moreover, with gold, silver, and mining stocks also prone to their own Minsky Moments, sharp sell-offs will likely manifest themselves sooner rather than later.
Overview of the Upcoming Part of the Decline
- It seems to me that the current corrective upswing in gold is about to be over soon, and the next short-term move lower is about to begin. Since it seems to be another short-term move more than it seems to be a continuation of the bigger decline, I think that junior miners would be likely to (at least initially) decline more than silver.
- It seems that the first stop for gold will be close to its previous 2021 lows, slightly below $1,700. Then it will likely correct a bit, but it’s unclear if I want to exit or reverse the current short position based on that – it depends on the number and the nature of the bullish indications that we get at that time.
- After the above-mentioned correction, we’re likely to see a powerful slide, perhaps close to the 2020 low ($1,450 - $1,500).
- If we see a situation where miners slide in a meaningful and volatile way while silver doesn’t (it just declines moderately), I plan to – once again – switch from short positions in miners to short positions in silver. At this time, it’s too early to say at what price levels this could take place, and if we get this kind of opportunity at all – perhaps with gold close to $1,600.
- I plan to exit all remaining short positions when gold shows substantial strength relative to the USD Index while the latter is still rallying. This might take place with gold close to $1,350 - $1,400. I expect silver to fall the hardest in the final part of the move. This moment (when gold performs very strongly against the rallying USD and miners are strong relative to gold after its substantial decline) is likely to be the best entry point for long-term investments, in my view. This might also happen with gold close to $1,375, but it’s too early to say with certainty at this time. I expect the final bottom to take place near the end of the year, perhaps in mid-December. It is not set in stone that PMs have to bottom at that time. If not then, then early 2022 would become a likely time target.
- As a confirmation for the above, I will use the (upcoming or perhaps we have already seen it?) top in the general stock market as the starting point for the three-month countdown. The reason is that after the 1929 top, gold miners declined for about three months after the general stock market started to slide. We also saw some confirmations of this theory based on the analogy to 2008. All in all, the precious metals sector is likely to bottom about three months after the general stock market tops. The additional confirmation will come from the tapering schedule, as markets are likely to move on the rumor and reverse on the fact as they tend to do in general.
- The above is based on the information available today, and it might change in the following days/weeks.
You will find my general overview of the outlook for gold on the chart below:
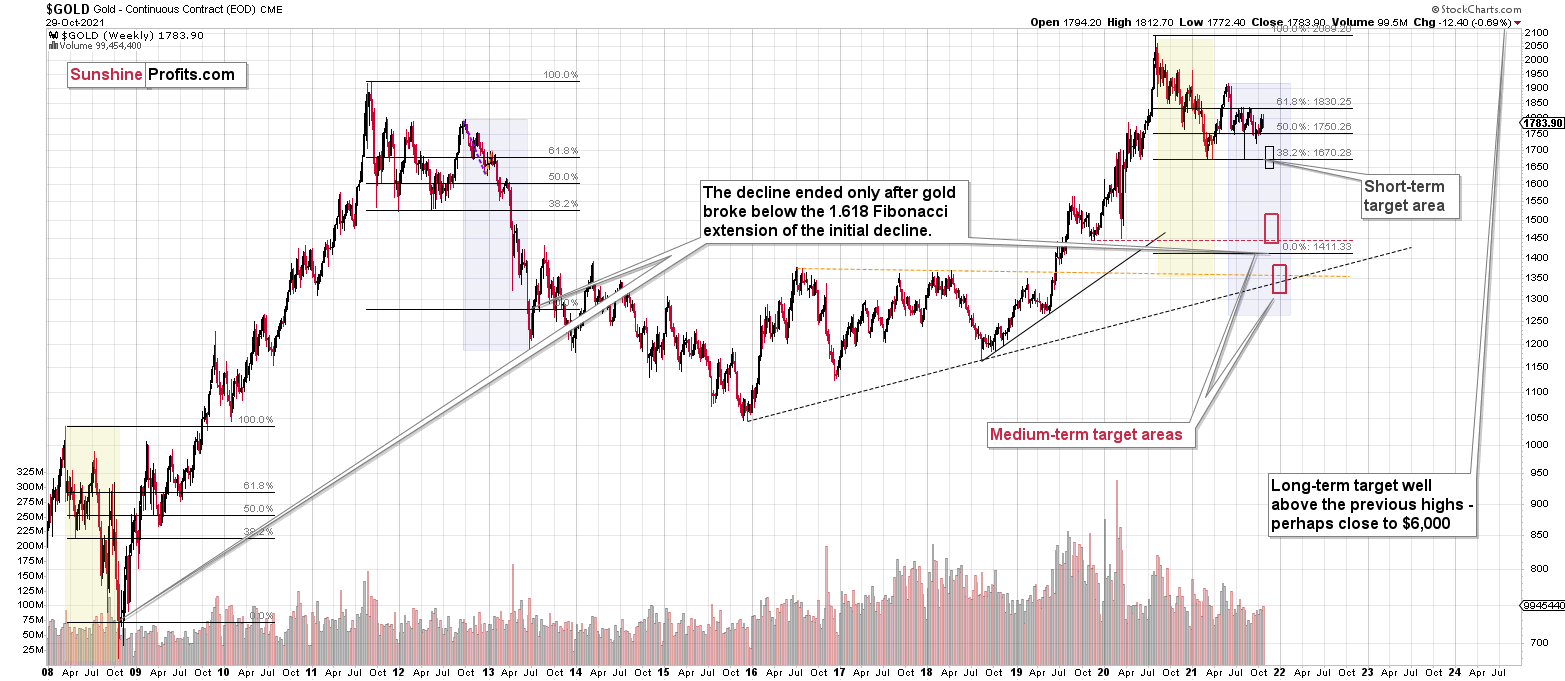
Please note that the above timing details are relatively broad and “for general overview only” – so that you know more or less what I think and how volatile I think the moves are likely to be – on an approximate basis. These time targets are not binding or clear enough for me to think that they should be used for purchasing options, warrants, or similar instruments.
Summary
The PMs rallied last week, and their momentum has teetered on euphoria. However, when prices diverge from fundamentals, sharp sell-offs often occur when sentiment shifts. As a result, caution is warranted, and the PMs’ recent bout of optimism will likely end in disappointment. This disappointment could start within the next few days, based on analogies to very similar cases in mining stocks. The decline in the GDX could start right away or once it moves to or slightly above $35, quite likely in 0 – 2 trading days. That is, if the top didn’t form on Nov. 16, and this seems quite likely.
Since it seems that the PMs are likely about to start another short-term move lower more, I think that junior miners would be likely to (at least initially) decline more than silver.
From the medium-term point of view, the key two long-term factors remain the analogy to 2013 in gold and the broad head and shoulders pattern in the HUI Index. They both suggest much lower prices ahead.
It seems that our profits from the short positions are going to become truly epic in the following months.
After the sell-off (that takes gold to about $1,350 - $1,500), I expect the precious metals to rally significantly. The final part of the decline might take as little as 1-5 weeks, so it's important to stay alert to any changes.
Most importantly, please stay healthy and safe. We made a lot of money last March and this March, and it seems that we’re about to make much more on the upcoming decline, but you have to be healthy to enjoy the results.
As always, we'll keep you - our subscribers - informed.
By the way, we’re currently providing you with the possibility to extend your subscription by a year, two years, or even three years with a special 20% discount. This discount can be applied right away, without the need to wait for your next renewal – if you choose to secure your premium access and complete the payment upfront. The boring time in the PMs is definitely over, and the time to pay close attention to the market is here. Naturally, it’s your capital, and the choice is up to you, but it seems that it might be a good idea to secure more premium access now while saving 20% at the same time. Our support team will be happy to assist you in the above-described upgrade at preferential terms – if you’d like to proceed, please contact us.
To summarize:
Trading capital (supplementary part of the portfolio; our opinion): Full speculative short positions (300% of the full position) in junior mining stocks are justified from the risk to reward point of view with the following binding exit profit-take price levels:
Mining stocks (price levels for the GDXJ ETF): binding profit-take exit price: $35.73; stop-loss: none (the volatility is too big to justify a stop-loss order in case of this particular trade)
Alternatively, if one seeks leverage, we’re providing the binding profit-take levels for the JDST (2x leveraged) and GDXD (3x leveraged – which is not suggested for most traders/investors due to the significant leverage). The binding profit-take level for the JDST: $16.18; stop-loss for the JDST: none (the volatility is too big to justify an SL order in case of this particular trade); binding profit-take level for the GDXD: $32.08; stop-loss for the GDXD: none (the volatility is too big to justify an SL order in case of this particular trade).
For-your-information targets (our opinion; we continue to think that mining stocks are the preferred way of taking advantage of the upcoming price move, but if for whatever reason one wants / has to use silver or gold for this trade, we are providing the details anyway.):
Silver futures downside profit-take exit price: $19.12
SLV profit-take exit price: $17.72
ZSL profit-take exit price: $41.38
Gold futures downside profit-take exit price: $1,683
HGD.TO – alternative (Canadian) inverse 2x leveraged gold stocks ETF – the upside profit-take exit price: $12.48
HZD.TO – alternative (Canadian) inverse 2x leveraged silver ETF – the upside profit-take exit price: $30.48
Long-term capital (core part of the portfolio; our opinion): No positions (in other words: cash
Insurance capital (core part of the portfolio; our opinion): Full position
Whether you already subscribed or not, we encourage you to find out how to make the most of our alerts and read our replies to the most common alert-and-gold-trading-related-questions.
Please note that we describe the situation for the day that the alert is posted in the trading section. In other words, if we are writing about a speculative position, it means that it is up-to-date on the day it was posted. We are also featuring the initial target prices to decide whether keeping a position on a given day is in tune with your approach (some moves are too small for medium-term traders, and some might appear too big for day-traders).
Additionally, you might want to read why our stop-loss orders are usually relatively far from the current price.
Please note that a full position doesn't mean using all of the capital for a given trade. You will find details on our thoughts on gold portfolio structuring in the Key Insights section on our website.
As a reminder - "initial target price" means exactly that - an "initial" one. It's not a price level at which we suggest closing positions. If this becomes the case (like it did in the previous trade), we will refer to these levels as levels of exit orders (exactly as we've done previously). Stop-loss levels, however, are naturally not "initial", but something that, in our opinion, might be entered as an order.
Since it is impossible to synchronize target prices and stop-loss levels for all the ETFs and ETNs with the main markets that we provide these levels for (gold, silver and mining stocks - the GDX ETF), the stop-loss levels and target prices for other ETNs and ETF (among other: UGL, GLL, AGQ, ZSL, NUGT, DUST, JNUG, JDST) are provided as supplementary, and not as "final". This means that if a stop-loss or a target level is reached for any of the "additional instruments" (GLL for instance), but not for the "main instrument" (gold in this case), we will view positions in both gold and GLL as still open and the stop-loss for GLL would have to be moved lower. On the other hand, if gold moves to a stop-loss level but GLL doesn't, then we will view both positions (in gold and GLL) as closed. In other words, since it's not possible to be 100% certain that each related instrument moves to a given level when the underlying instrument does, we can't provide levels that would be binding. The levels that we do provide are our best estimate of the levels that will correspond to the levels in the underlying assets, but it will be the underlying assets that one will need to focus on regarding the signs pointing to closing a given position or keeping it open. We might adjust the levels in the "additional instruments" without adjusting the levels in the "main instruments", which will simply mean that we have improved our estimation of these levels, not that we changed our outlook on the markets. We are already working on a tool that would update these levels daily for the most popular ETFs, ETNs and individual mining stocks.
Our preferred ways to invest in and to trade gold along with the reasoning can be found in the how to buy gold section. Furthermore, our preferred ETFs and ETNs can be found in our Gold & Silver ETF Ranking.
As a reminder, Gold & Silver Trading Alerts are posted before or on each trading day (we usually post them before the opening bell, but we don't promise doing that each day). If there's anything urgent, we will send you an additional small alert before posting the main one.
Thank you.
Przemyslaw Radomski, CFA
Founder, Editor-in-chief

