

Briefly: in our opinion, full (300% of the regular position size) speculative short positions in mining stocks are justified from the risk/reward point of view at the moment of publishing this Alert.
Yesterday’s (Jul. 27) supposedly big news was the breakdown below the neck level of the inverse head-and-shoulders pattern in the USD Index. Invalidations of breakouts are bearish, and what’s bearish for the USDX is usually bullish for gold, silver, and mining stocks. So, what happened? And what didn’t happen?
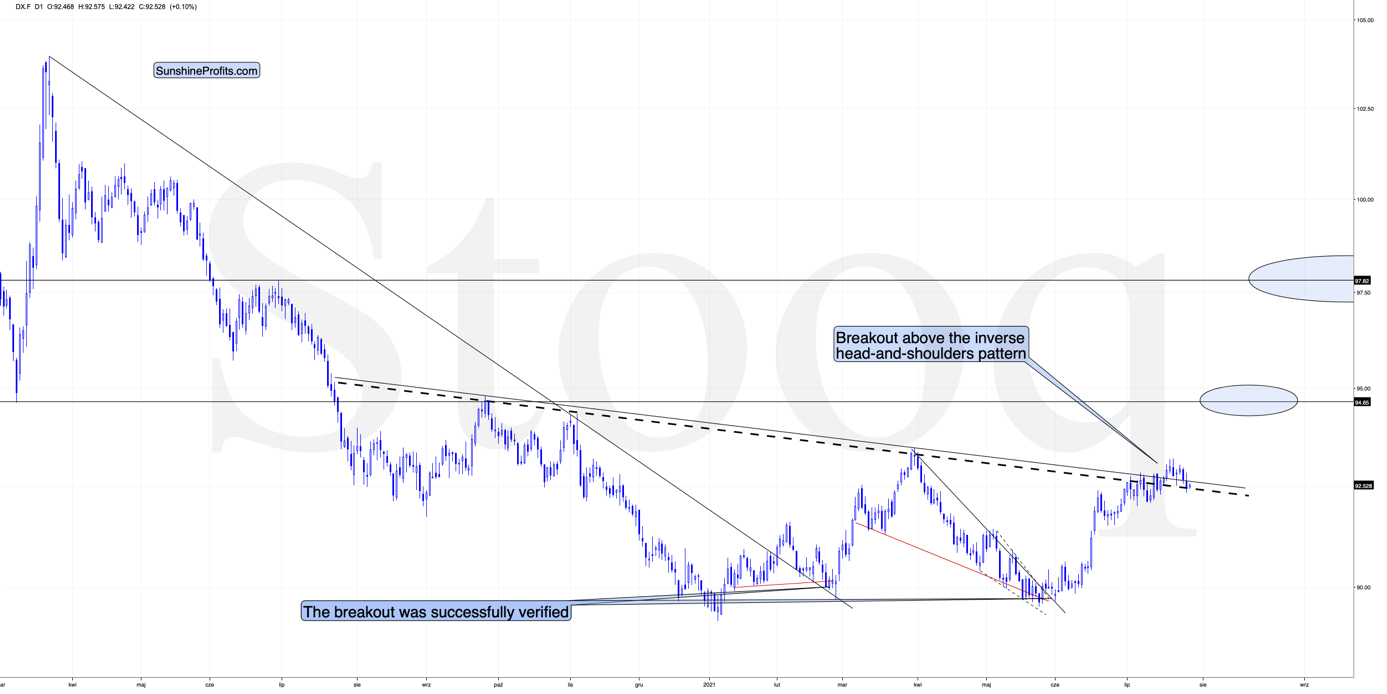
What happened was that the USD Index moved a bit below the declining neckline based on the previous intraday highs.
What didn’t happen was the move below the declining neckline based on the previous highs in terms of daily closing prices (dashed line).
So, was the breakout really invalidated? Not necessarily, especially that the USDX is moving back up in today’s pre-market trading (at least at the moment of writing these words).
Moreover, while the USD Index moved lower yesterday, gold refused to rally.
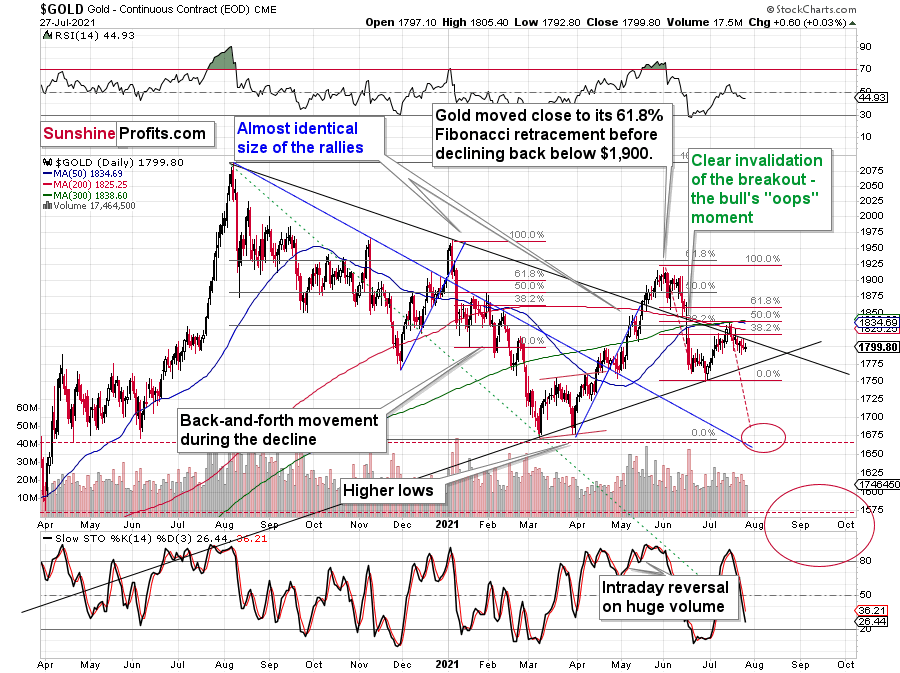
To be precise, it did move higher, but only by $0.60, so it generally ignored the USD’s movement.
Consequently, yesterday’s session might have seemed to be a game-changer at first sight, but it seems much more likely that it wasn’t one. In my view, yesterday’s price movement was the continuation of the back-and-forth trading that’s analogous to what we saw in the first half of June. Gold was moving back and forth in a boring manner then too. The boredom was over quite quickly and a big short-term slide followed – I think the same is likely to happen shortly.
Gold Miners’ Aid
Mining stocks’ performance also supports this scenario.
If it was the beginning of another sizable move higher in the PMs and miners, the latter would be likely to show strength before gold. And that’s not taking place.
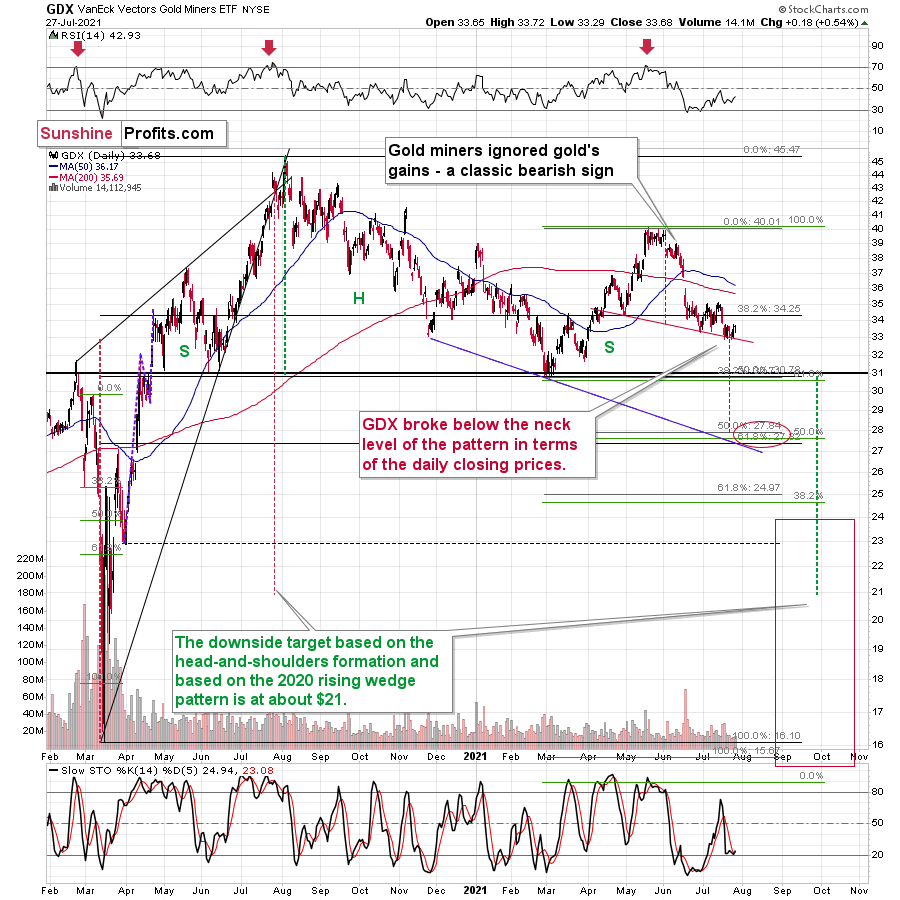
Senior gold miners were practically flat yesterday, just as gold was – that is, only slightly higher. On the other hand, junior gold miners ended the session slightly lower – very close to their previous 2021 lows.
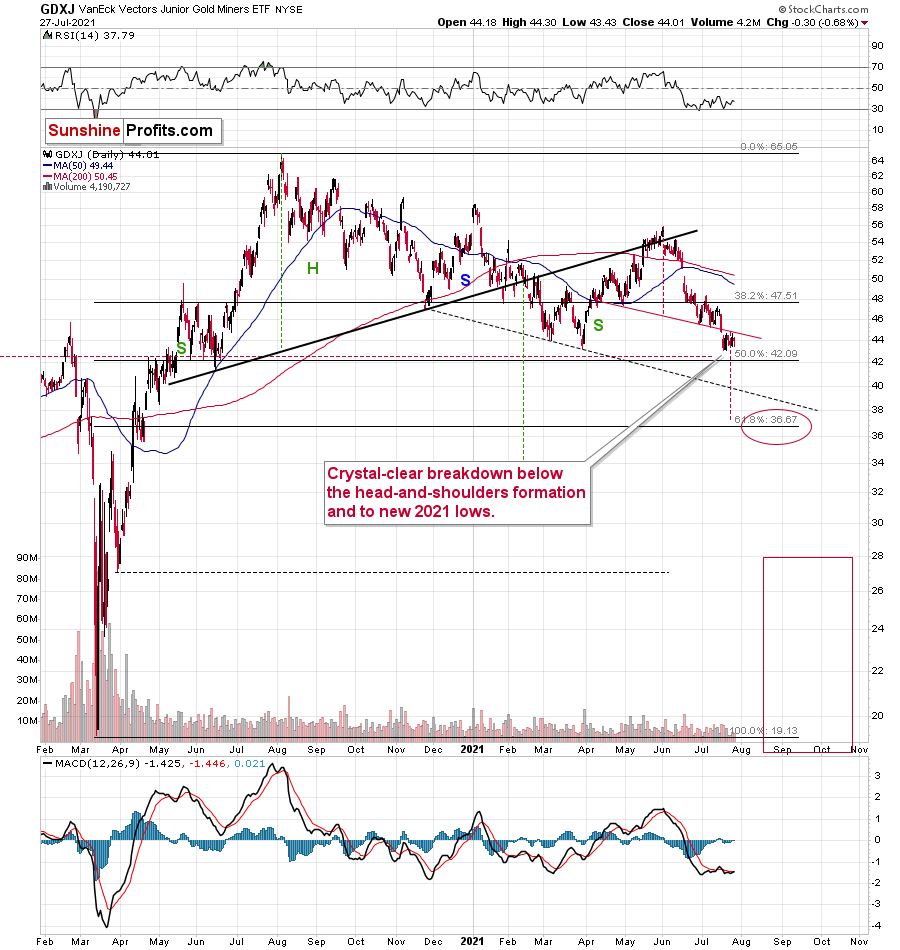
Junior miners (the GDXJ ETF) haven’t invalidated the breakdown below the neck level of the bearish head and shoulders formation. Consequently, the very bearish implications of the breakdown remain intact.
All in all, the precious metals sector seems poised for another move lower, quite likely to the previous yearly lows in the case of gold and well below the previous 2021 lows in the case of the mining stocks. Yesterday’s decline in the USD index doesn’t change that. To clarify, the above-mentioned targets will most likely be just interim stops within an even bigger decline that will get us to the ultimate buying opportunity for the PMs and miners later this year.
Having said that, let’s take a look at the markets from a more fundamental angle.
Volatile Spirits
With the S&P 500 suffering another bout of volatility on Jul. 27, the once calm seas have transformed into choppy waters. And with the S&P 500 incurring a 10% correction at least once per year (on average) since 1950, is the general stock market running on borrowed time? For context, equity market weakness often casts a shadow over the PMs, and with the GDXJ ETF (our short position) declining by 0.68% amid the chaos on Jul. 27, a sharp re-rating of U.S. equities could increase the ferocity of the PMs’ likely decline.
Please see below:
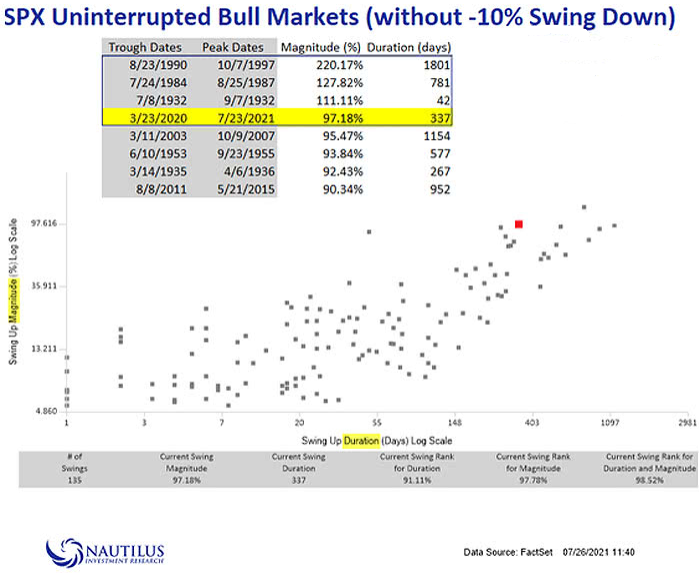
To explain, the scatter plot above depicts the number of days that the S&P 500 has risen before suffering a 10% correction. If you analyze the table at the top, you can see that it’s been 337 days since real fear has gripped the markets (the area shaded yellow). More importantly, though, it’s the twelfth-longest streak (time-wise) and the fourth-largest streak (magnitude-wise) since 1932. Thus, while equity investors continue to throw caution to the wind, if a Minsky Moment occurs, it could inflict plenty of pain on the PMs.
On top of that, not only are valuations extremely stretched, but we’re approaching periods of seasonal S&P 500 weakness.
Please see below:
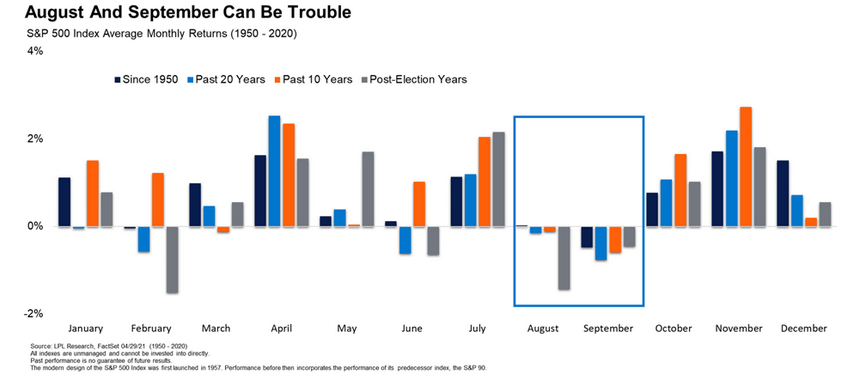
To explain, over the last 10 years, 20 years, following presidential elections and since 1950, the S&P 500 often suffers negative monthly returns during August and September. And with the Delta variant adding to the anxiety and the U.S. Federal Reserve’s (FED) taper timeline another source of uncertainty, panic on Wall Street could expedite the pace of the PMs’ likely decline.
Also concerning, the S&P 500 has completely decoupled from the U.S. truck tonnage index. For context, data on the latter is gathered by The U.S. Bureau of Transportation Statistics (BTS), and it tallies the freight that’s transported by the U.S. motor carrier industry.
Please see below:
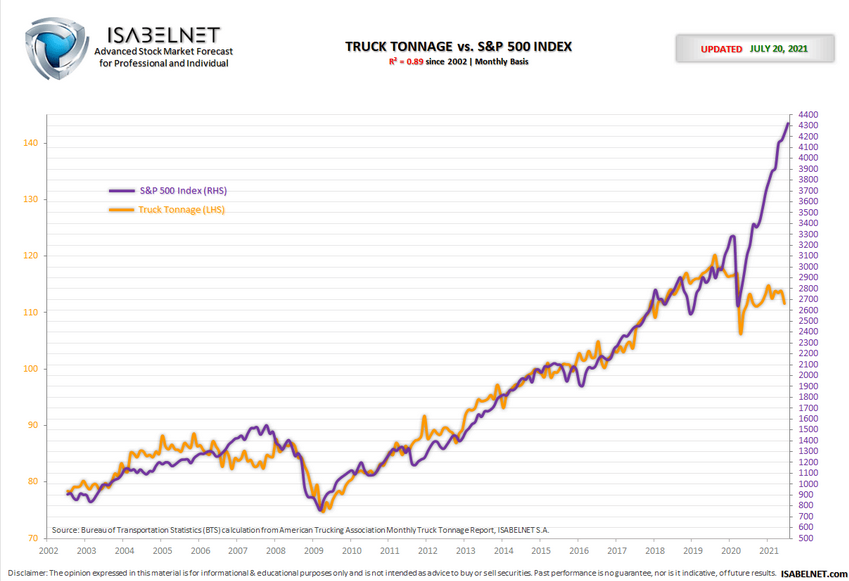
To explain, the purple line above tracks the S&P 500, while the orange line above tracks the U.S. truck tonnage index. If you analyze the right side of the chart, you can see the epic divergence. To that point, while small gaps have often closed quickly since 2002, a reversion of this magnitude could send shockwaves across the precious metals market.
If that wasn’t enough, with the U.S. Financial Industry Regulatory Authority (FINRA) releasing its margin debt figures for June, it was another month and another record high.
Please see below:
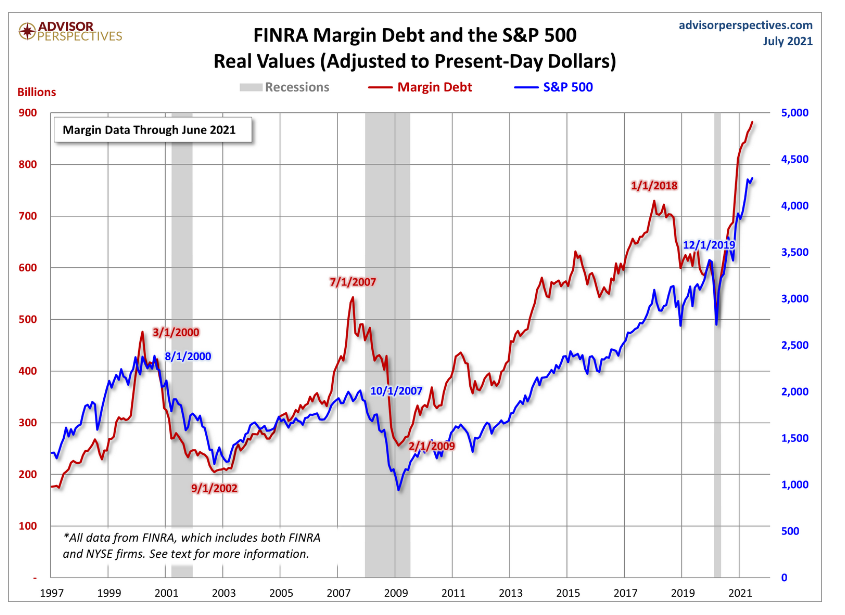
To explain, the blue line above tracks the S&P 500, while the red line above tracks U.S. margin debt. If you focus your attention on the peaks and valleys, you can see that excessive margin debt preceded the dot-com bubble and the global financial crisis (GFC). Moreover, if you analyze the right side of the chart, you can see that investors’ appetite for debt has gone where no man has gone before. And while purchasing securities with borrowed funds may seem wise on the upside, when the tide turns, the drawdowns are often fast and furious.
Support for the US Dollar!
But as the drama unfolds, the U.S. dollar is gaining more and more supporters. With non-commercial (speculative) futures traders, asset managers and leveraged funds all increasing their exposure to the greenback last week, we’ve now hit 2021 highs on two of the three.
Please see below:
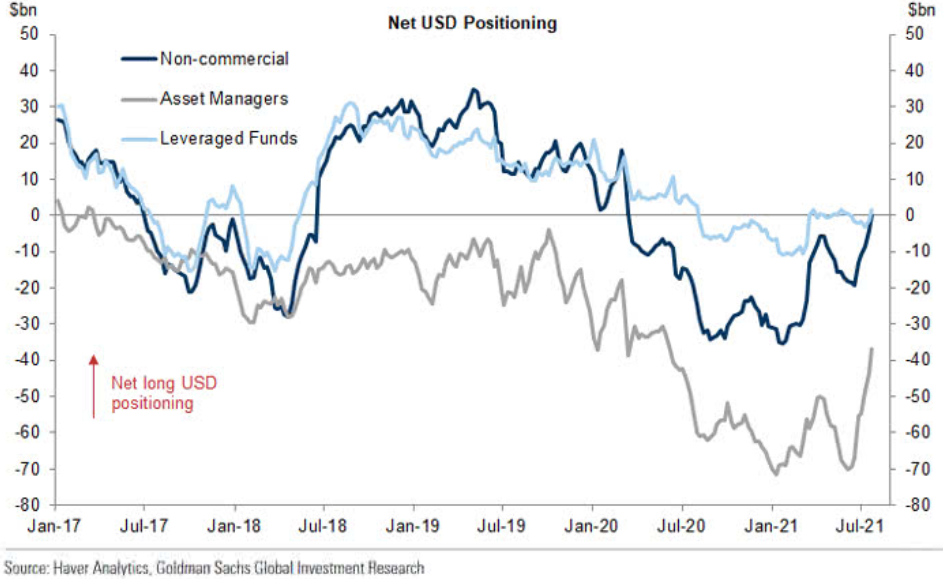
To explain, the dark blue, gray and light blue lines above represent net-long positions of non-commercial (speculative) futures traders, asset managers and leveraged funds. When the lines are falling, it means that the trio have reduced their net-long positions and are expecting a weaker U.S. dollar. Conversely, when the lines are rising, it means that the trio have increased their net-long positions and are expecting a stronger U.S. dollar. And if you analyze the right side of the chart, you can see that the positioning of non-commercial futures traders and asset managers has risen sharply in recent weeks. As a result, with U.S. dollar sentiment shifting before our eyes, the greenback’s list of staunch supporters is growing by the day.
As further evidence, if we dissect the data on a granular level, support for the euro, the British pound and the Canadian dollar has already come undone.
Please see below:
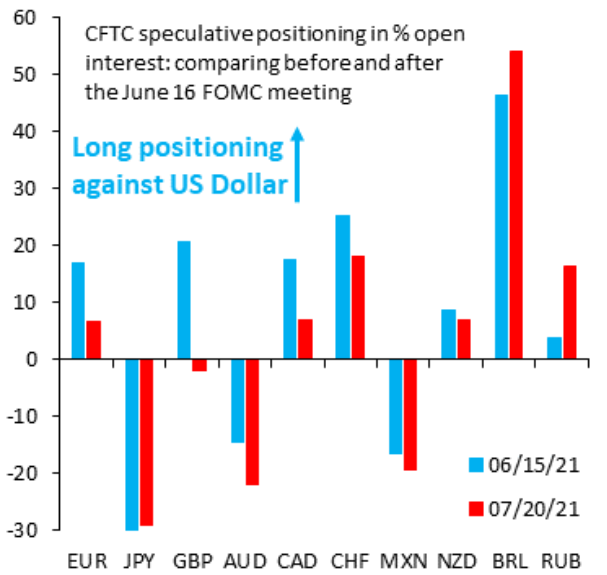 Source: Robin Brooks/The Institute of International Finance (IIF)
To explain, the blue bars above depict non-commercial futures traders’ positioning on Jun. 15, while the red bars above depict their positioning on Jul. 20. If you analyze the columns marked “EUR” and “CAD,” you can see that net positions as a percentage of open interest have declined by more than 50%. Likewise, if you turn to the column labeled “GBP,” net-positions as a percentage of open interest have now turned negative.
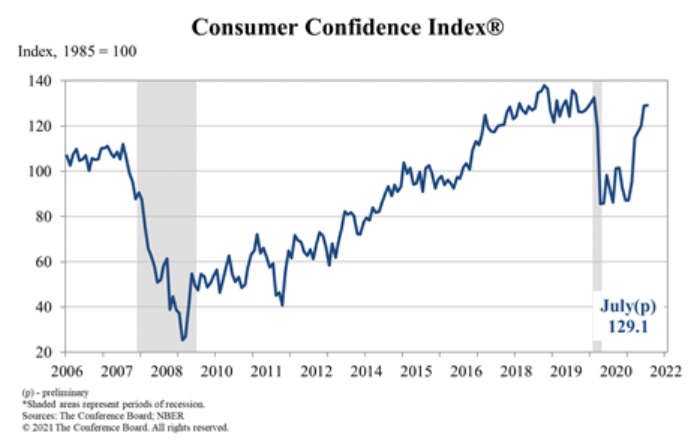
If that wasn’t enough, the U.S. economy also remains on track to outperform the Eurozone. For context, the EUR/USD accounts for nearly 58% of the movement of the USD Index and that’s why it’s the most important currency pair. To that point, with The Confidence Board’s Consumer Confidence Index (released on Jul. 27) rising from 128.9 in June to 129.1 in July – and coming in ahead of the consensus estimate of 123.9 – the metric is now at its highest level since February 2020 (pre-pandemic).
Please see below:
An excerpt from the report read:
“Consumers’ appraisal of present-day conditions held steady, suggesting economic growth in Q3 is off to a strong start. Consumers’ optimism about the short-term outlook didn’t waver, and they continued to expect that business conditions, jobs, and personal financial prospects will improve. Short-term inflation expectations eased slightly but remained elevated. Spending intentions picked up in July, with a larger percentage of consumers saying they planned to purchase homes, automobiles, and major appliances in the coming months. Thus, consumer spending should continue to support robust economic growth in the second half of 2021.”
In addition, The Confidence Board’s other indicators are also trending higher:
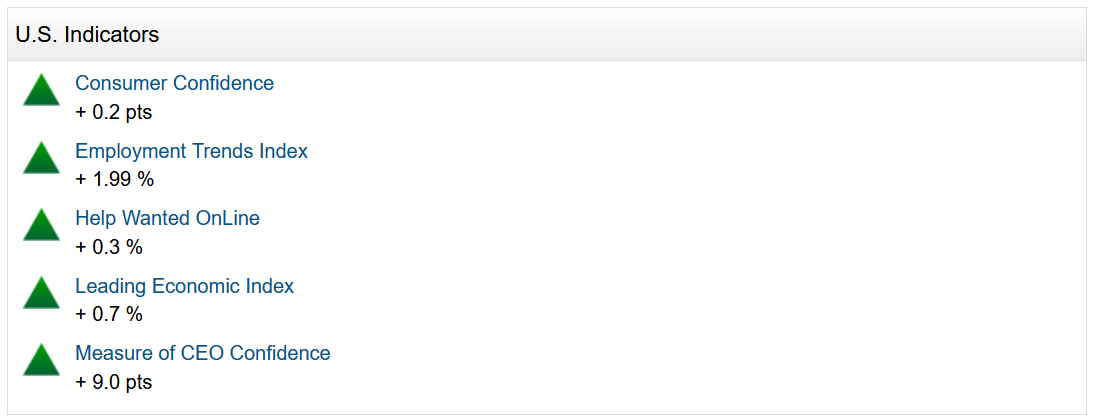 Source: The Confidence Board
The FED’s Reverse Repos
Finally, with the FED’s daily reverse repurchase agreements gunning for their all-time high of $992 billion, the central bank sold another $927 billion on Jul. 27. And with reverse repos the fundamental equivalent of a taper, the higher they go, the more bullish it is for the USD Index (due to the supply of U.S. dollars being siphoned out of the system). For context, a reverse repurchase agreement (repo) occurs when an institution offloads cash to the FED in exchange for a Treasury security (on an overnight or short-term basis). And with U.S. financial institutions currently flooded with excess liquidity, they’re shipping cash to the FED at an alarming rate.
Please see below:
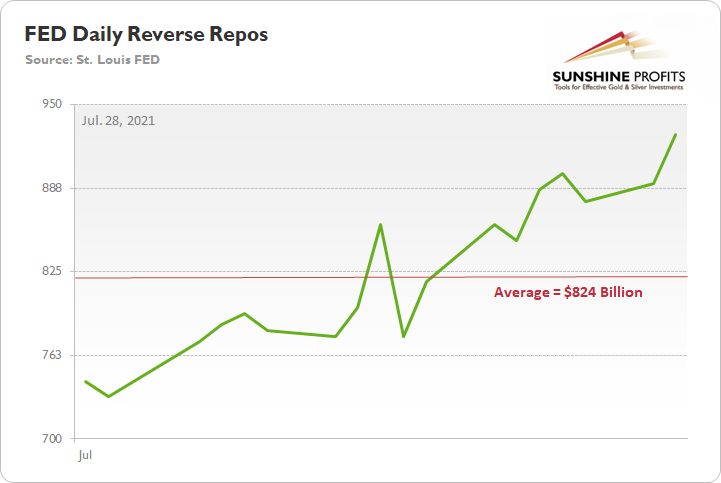
To explain, the green line above tracks the FED’s daily reverse repos during the month of July. And while daily transactions averaged $642 billion in June, that figure has jumped to $824 billion in July. As a result, while FED Chairman Jerome Powell may remain hush-hush about the taper timeline today, the supply of U.S. dollars is already dwindling.
In conclusion, the PMs were a mixed bag on Jul. 27, though the GDXJ ETF and silver (the most volatile constituents) were visible underperformers. And while Powell may use the Delta variant as an excuse to remain dovish today, it’s unlikely to have a medium-term impact. With inflation surging and daily reverse repos more than offsetting the FED’s QE program, the writing is largely on the wall. As a result, while the PMs may record a short-term bounce – which often occurs following Powell’s pressers – lower lows are still likely to materialize in the coming months.
Overview of the Upcoming Part of the Decline
- The corrective upswing in gold might already be over, and another huge decline is likely just around the corner. In fact, it seems to be well underway in the case of mining stocks, especially junior miners.
- After miners slide in a meaningful and volatile way, but silver doesn’t (and it just declines moderately), I plan to switch from short positions in miners to short positions in silver. At this time, it’s too early to say at what price levels this would take place – perhaps with gold close to $1,600. I plan to exit those short positions when gold shows substantial strength relative to the USD Index, while the latter is still rallying. This might take place with gold close to $1,350 - $1,500 and the entire decline (from above $1,900 to about $1,475) would be likely to take place within 6-20 weeks, and I would expect silver to fall the hardest in the final part of the move. This moment (when gold performs very strongly against the rallying USD and miners are strong relative to gold – after gold has already declined substantially) is likely to be the best entry point for long-term investments, in my view. This might also happen with gold close to $1,475, but it’s too early to say with certainty at this time.
- As a confirmation for the above, I will use the (upcoming or perhaps we have already seen it?) top in the general stock market as the starting point for the three-month countdown. The reason is that after the 1929 top, gold miners declined for about three months after the general stock market started to slide. We also saw some confirmations of this theory based on the analogy to 2008. All in all, the precious metals sector would be likely to bottom about three months after the general stock market tops.
- The above is based on the information available today, and it might change in the following days/weeks.
Please note that the above timing details are relatively broad and “for general overview only” – so that you know more or less what I think and how volatile I think the moves are likely to be – on an approximate basis. These time targets are not binding or clear enough for me to think that they should be used for purchasing options, warrants or similar instruments.
Letters to the Editor
Q: Can you discuss the real interest rates and their recent plunge almost back to the levels of last year's (August) high in gold? Gold is completely disconnected and is plummeting, shouldn’t it be rocketing upwards? This inverse relationship between gold and the real rates is usually rock-solid. Does the USD trump the real rates? Does no one believe that the real rates will continue to stay down and the plunge is over? Or is the tapering talk messing up the usually solid relationships with the data? Moreover, is the divergence predictive? Or does the divergence simply highlight how weak gold really is and there is no need to read any more into it? That kind of thing.
A: It seems to me that all that you wrote is somewhat true, but I’d put the biggest emphasis on what you wrote last. The gold market is now very weak compared to what’s happening in the world, and it takes various forms. One of these forms is focusing on what could take gold lower while ignoring what could take it higher.
This, plus the fact that gold miners are very weak relative to gold, makes the next weeks / months exceptionally bearish for the mining stocks.
Q: Trading position for silver is not clear: whether we should have a short position in silver or not. You have written that we will move to short silver when gold is around $1600, whereas at present it is $1800 – I am unable to understand this. Also, you are quite confident about the decline in the precious metals, but you are not shorting it. Please justify both queries. I’m a new member, maybe there is something I don’t know. I am not a speculator or a day trader. I am a manufacturer and retailer of silver articles in Delhi, India.
A: Thanks for joining us and welcome aboard! To clarify, in my analyses I’m quite often describing many markets, stocks, currencies, bonds (interest rates), gold, silver, senior mining stocks, junior mining stocks, and occasionally even other assets like copper, bitcoin, dogecoin, Gamestop stocks, and others. I also mentioned that, in the very long run, AI-based, psychedelic stocks (for mental health treatment), and perhaps Ethereum might be great investment opportunities.
However, just because I’m presenting my views and opinions on multiple markets, it doesn’t mean that I’m holding positions in all of them, or that I think that holding them is justified from the risk to reward point of view.
In general, I’m taking positions in gold, silver and/or mining stocks, and I’m dividing the capital into three categories: insurance, investment, and trading. You can read more about that in this report. I’m keeping the insurance positions intact (physical), I’m in cash in the case of the long-term investment capital, and I’m shorting mining stocks with the trading capital.
Now, as far as trading positions are concerned, there are times when I take positions in all three: gold, silver, and mining stocks at the same time. That’s when I don’t have a clear preference toward any of them, and I want to diversify between them. This is not the case right now. Right now, I have this kind of preference, as it seems to me that the mining stocks – especially junior mining stocks – are going to decline the most relatively soon.
The above is based on how the price moves usually take place in the precious metals sector – mining stocks are usually the first to move, and silver catches up later.
I plan to take advantage of the above-mentioned phenomenon by moving from the short positions in the mining stocks to short positions in silver at some point – after mining stocks decline a lot, and silver declines only somewhat. If you check what happened in the GDXJ and in silver on March 13 and March 16, 2020, you’ll see what I mean.
Next, I plan to hold the short positions in silver for a relatively brief time – perhaps just a few days.
IF, at that time, gold miners show some strength relative to gold, while gold shows strength relative to the USD Index, it might (depending on the price levels) serve as a major buying opportunity, but that goes beyond the scope of the reply to your question.
So, to summarize, I do think that silver will move lower from the current price levels, but I think that mining stocks will move lower more, so I’m using them to profit on this upcoming decline instead of using silver or gold.
If one can’t trade mining stocks but has to use (or prefers to do so) other assets / instruments, then other parts of my analyses might also be useful. In fact, that’s why I’m adding the “for your information targets” below the summary so that you know my thoughts about them as well.
Summary
To summarize, it seems that gold has already formed its short-term top and – based i.a. on the completed inverse head-and-shoulders pattern in the USD Index – gold is likely to fall substantially in the following weeks. Gold stocks’ exceptionally weak performance has been indicating that for many weeks, and given juniors’ recent breakdown to new yearly lows, it seems that the storm has already begun.
It seems that our profits on the short position in the junior mining stocks are going to grow substantially in the following weeks.
After the sell-off (that takes gold to about $1,350 - $1,500), I expect the precious metals to rally significantly. The final part of the decline might take as little as 1-5 weeks, so it's important to stay alert to any changes.
Most importantly, please stay healthy and safe. We made a lot of money last March and this March, and it seems that we’re about to make much more on the upcoming decline, but you have to be healthy to enjoy the results.
As always, we'll keep you - our subscribers - informed.
By the way, we’re currently providing you with the possibility to extend your subscription by a year, two years or even three years with a special 20% discount. This discount can be applied right away, without the need to wait for your next renewal – if you choose to secure your premium access and complete the payment upfront. The boring time in the PMs is definitely over, and the time to pay close attention to the market is here. Naturally, it’s your capital, and the choice is up to you, but it seems that it might be a good idea to secure more premium access now while saving 20% at the same time. Our support team will be happy to assist you in the above-described upgrade at preferential terms – if you’d like to proceed, please contact us.
To summarize:
Trading capital (supplementary part of the portfolio; our opinion): Full speculative short positions (300% of the full position) in mining stocks are justified from the risk to reward point of view with the following binding exit profit-take price levels:
Mining stocks (price levels for the GDXJ ETF): binding profit-take exit price: $37.12; stop-loss: none (the volatility is too big to justify a stop-loss order in case of this particular trade)
Alternatively, if one seeks leverage, we’re providing the binding profit-take levels for the JDST (2x leveraged) and GDXD (3x leveraged – which is not suggested for most traders/investors due to the significant leverage). The binding profit-take level for the JDST: $15.96; stop-loss for the JDST: none (the volatility is too big to justify a SL order in case of this particular trade); binding profit-take level for the GDXD: $37.02; stop-loss for the GDXD: none (the volatility is too big to justify a SL order in case of this particular trade).
For-your-information targets (our opinion; we continue to think that mining stocks are the preferred way of taking advantage of the upcoming price move, but if for whatever reason one wants / has to use silver or gold for this trade, we are providing the details anyway.):
Silver futures upside profit-take exit price: unclear at this time - initially, it might be a good idea to exit, when gold moves to $1,683
Gold futures upside profit-take exit price: $1,683
HGD.TO – alternative (Canadian) inverse 2x leveraged gold stocks ETF – the upside profit-take exit price: $12.88
Long-term capital (core part of the portfolio; our opinion): No positions (in other words: cash
Insurance capital (core part of the portfolio; our opinion): Full position
Whether you already subscribed or not, we encourage you to find out how to make the most of our alerts and read our replies to the most common alert-and-gold-trading-related-questions.
Please note that we describe the situation for the day that the alert is posted in the trading section. In other words, if we are writing about a speculative position, it means that it is up-to-date on the day it was posted. We are also featuring the initial target prices to decide whether keeping a position on a given day is in tune with your approach (some moves are too small for medium-term traders, and some might appear too big for day-traders).
Additionally, you might want to read why our stop-loss orders are usually relatively far from the current price.
Please note that a full position doesn't mean using all of the capital for a given trade. You will find details on our thoughts on gold portfolio structuring in the Key Insights section on our website.
As a reminder - "initial target price" means exactly that - an "initial" one. It's not a price level at which we suggest closing positions. If this becomes the case (like it did in the previous trade), we will refer to these levels as levels of exit orders (exactly as we've done previously). Stop-loss levels, however, are naturally not "initial", but something that, in our opinion, might be entered as an order.
Since it is impossible to synchronize target prices and stop-loss levels for all the ETFs and ETNs with the main markets that we provide these levels for (gold, silver and mining stocks - the GDX ETF), the stop-loss levels and target prices for other ETNs and ETF (among other: UGL, GLL, AGQ, ZSL, NUGT, DUST, JNUG, JDST) are provided as supplementary, and not as "final". This means that if a stop-loss or a target level is reached for any of the "additional instruments" (GLL for instance), but not for the "main instrument" (gold in this case), we will view positions in both gold and GLL as still open and the stop-loss for GLL would have to be moved lower. On the other hand, if gold moves to a stop-loss level but GLL doesn't, then we will view both positions (in gold and GLL) as closed. In other words, since it's not possible to be 100% certain that each related instrument moves to a given level when the underlying instrument does, we can't provide levels that would be binding. The levels that we do provide are our best estimate of the levels that will correspond to the levels in the underlying assets, but it will be the underlying assets that one will need to focus on regarding the signs pointing to closing a given position or keeping it open. We might adjust the levels in the "additional instruments" without adjusting the levels in the "main instruments", which will simply mean that we have improved our estimation of these levels, not that we changed our outlook on the markets. We are already working on a tool that would update these levels daily for the most popular ETFs, ETNs and individual mining stocks.
Our preferred ways to invest in and to trade gold along with the reasoning can be found in the how to buy gold section. Furthermore, our preferred ETFs and ETNs can be found in our Gold & Silver ETF Ranking.
As a reminder, Gold & Silver Trading Alerts are posted before or on each trading day (we usually post them before the opening bell, but we don't promise doing that each day). If there's anything urgent, we will send you an additional small alert before posting the main one.
Thank you.
Przemyslaw Radomski, CFA
Founder, Editor-in-chief

