

-
Natural Gas Hits Its Final Target. The Luck of St. Patrick’s Day?
March 18, 2022, 11:43 AMSt. Patrick’s Day is historically considered one of the best trading days. Apparently, it brought some luck to natural gas this time.
If you are interested in looking at the stats, an article by Market Watch summed them up.

The second target hit – BOOM! Yesterday, on St. Patrick's Day, the opportunity to bank the extra profits from my recent Nat-Gas trade projections (provided on March 2) finally arrived. That trade plan has provided traders with multiple bounces to trade the NYMEX Natural Gas Futures (April contract) in various ways, always depending on each one’s personal risk profile.
To get some more explanatory details on understanding the different trading ways this fly map (trading plan) could offer, I invite you to read my previous article (from March 11).
To quickly sum it up, the various trade opportunities that could be played were as follows (with the following captures taken on March 11):
The first possibility is swing trading, with the trailing stop method explained in my famous risk management article.
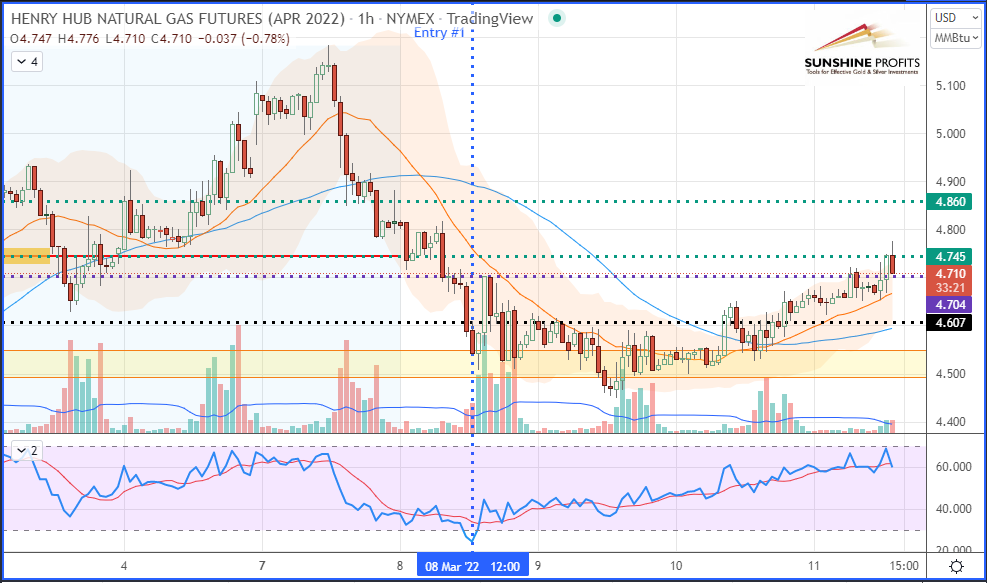 Henry Hub Natural Gas (NGJ22) Futures (April contract, hourly chart)
The second option consisted of scalping the rebounds with fixed targets (active or experienced traders). I named this method “riding the tails” (or the shadows).
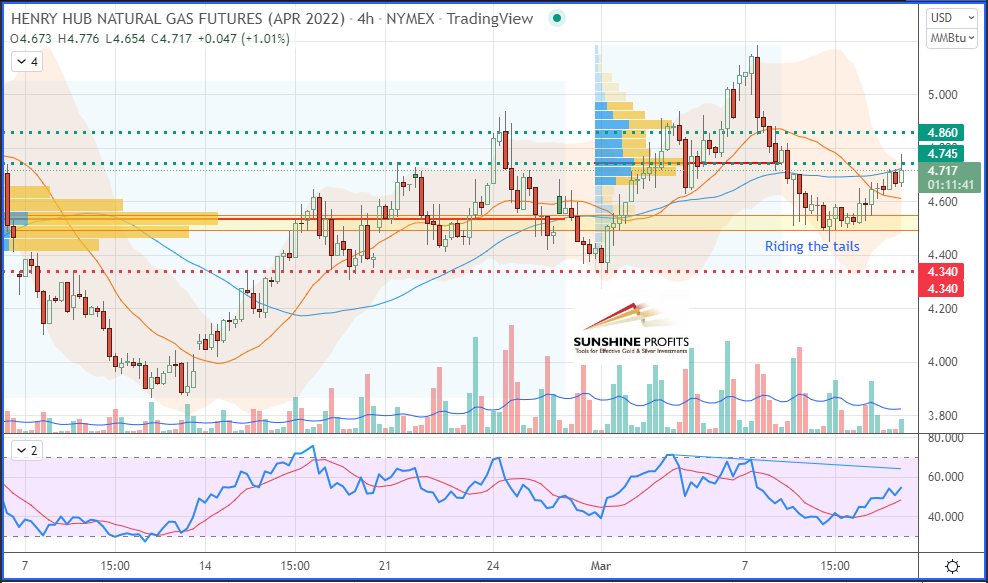 Henry Hub Natural Gas (NGJ22) Futures (April contract, 4H chart)
The third way is position trading – a more passive trading style (and usually more rewarding).
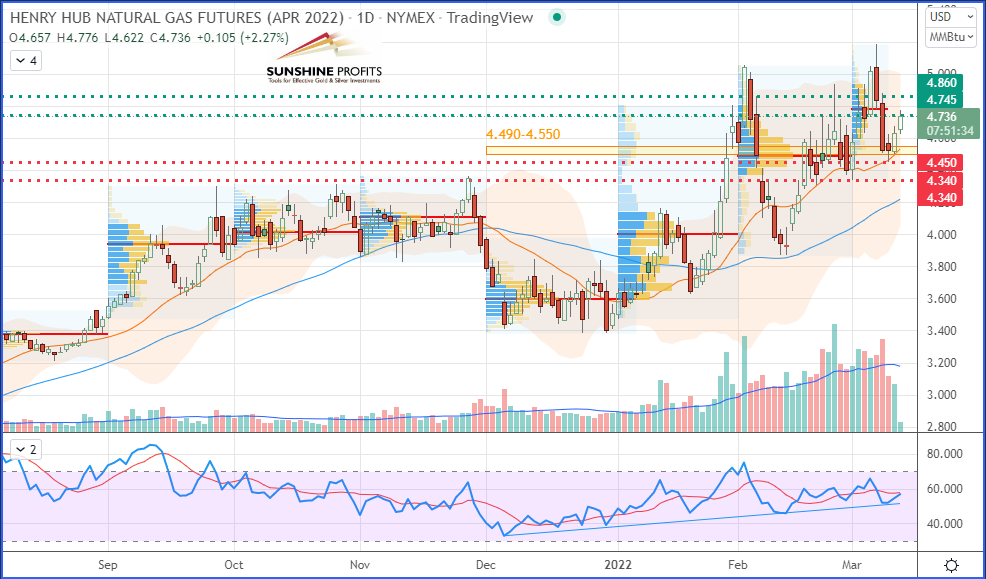
Henry Hub Natural Gas (NGJ22) Futures (April contract, daily chart)
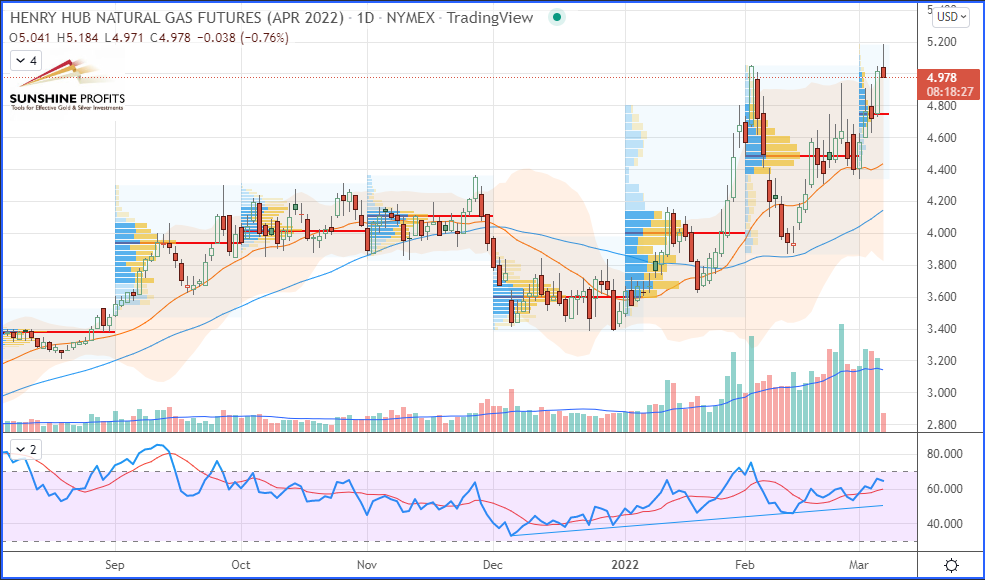
The chart below shows a good overall view of NYMEX Natural Gas hitting our final target, $4.860:
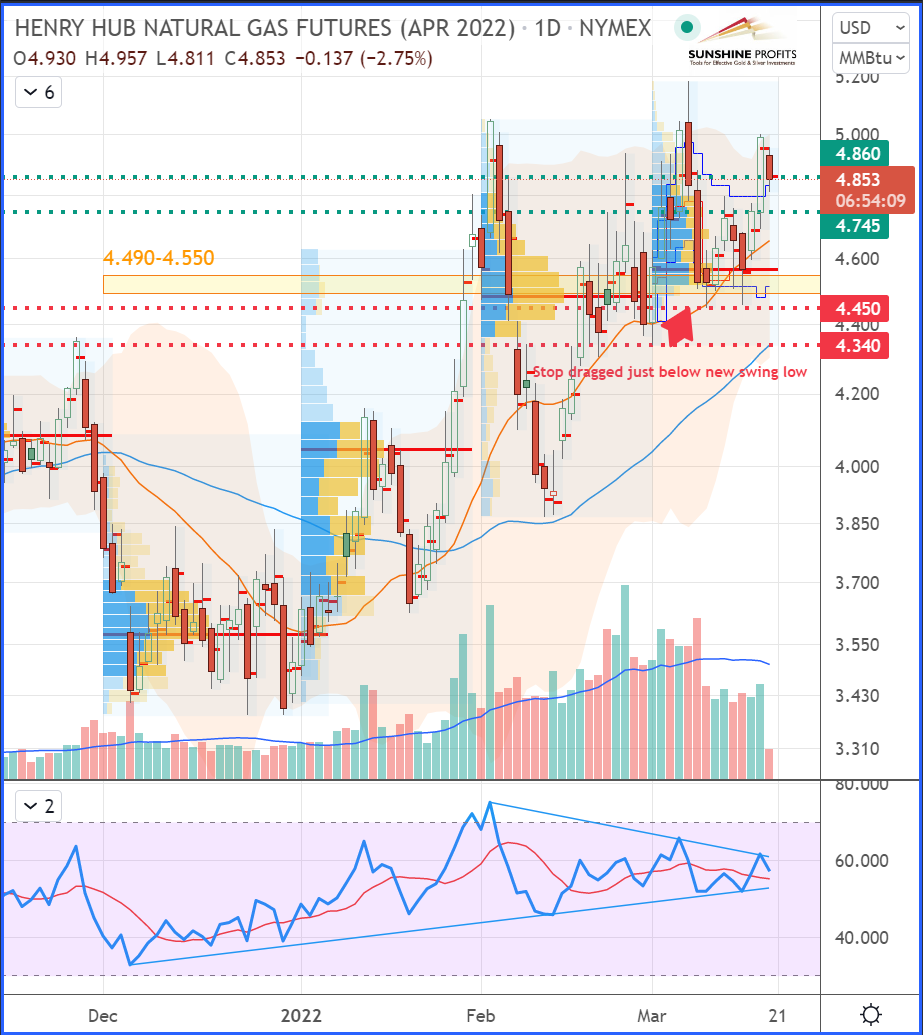 Henry Hub Natural Gas (NGJ22) Futures (April contract, daily chart)
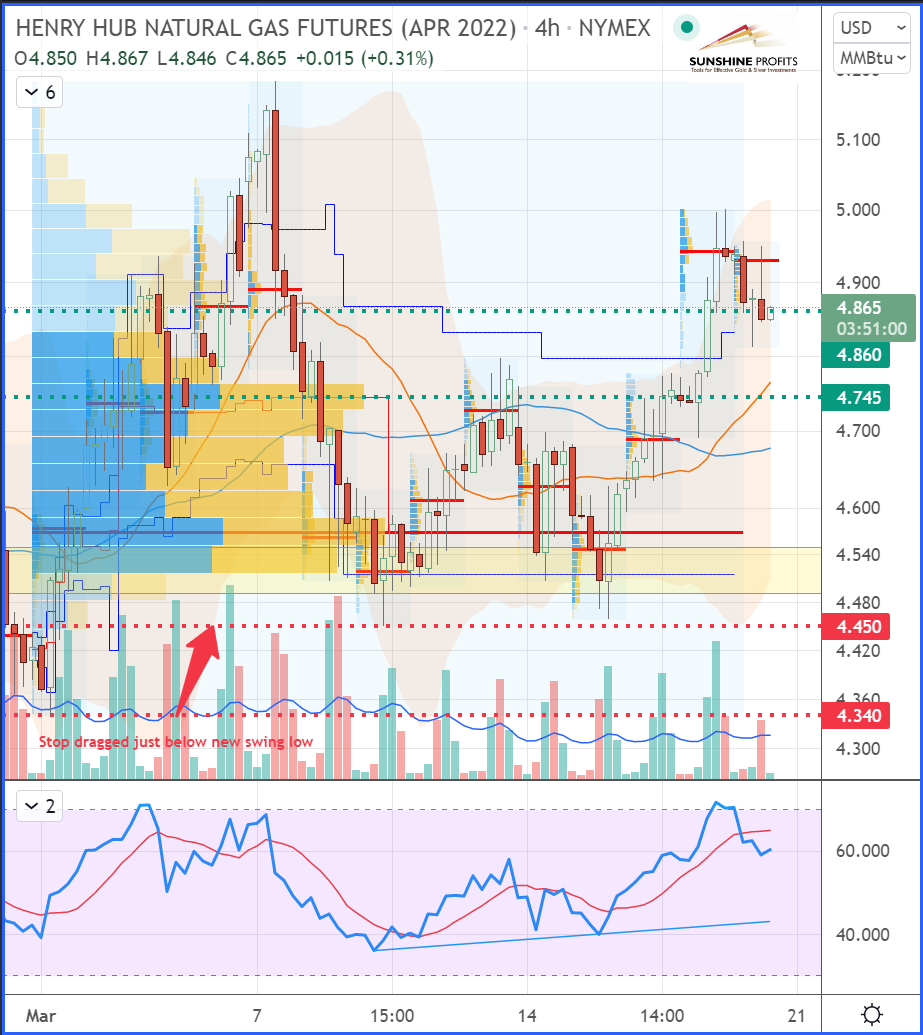
Henry Hub Natural Gas (NGJ22) Futures (April contract, 4H chart)
As you can see, the market has provided us with multiple entries into the same support zone (highlighted by the yellow band) – even after hitting the first target, you may have noticed that I maintained the entry conditions in place – after the suggestion to drag the stop up just below the new swing low ($4.450). The market, still in a bull run, got very close to that point on March 15 by making a new swing low at $4.459 (just about 10 ticks above it). Before that, it firmly rebounded once more (allowing a new/additional entry) and then extended its gains further away while consecutively hitting target 1 ($4.745) again. After that, it finally hit target 2 ($4.860)!
That’s all folks for today. It is time to succesfully close this trade. Have a great weekend!
Today's premium Oil Trading Alert includes details of our new trading position. Interested in more exclusive updates? Join our premium Oil Trading Alerts newsletter and read all the details today.
Thank you.
Sebastien Bischeri,
Oil & Gas Trading Strategist -
Oil Prices Keep Falling. Is It Time to Get Long on Black Gold?
March 16, 2022, 11:14 AMCrude oil continues to decline due to lowered demand, and the petrodollar seems threatened, losing interest. What is the best strategy to take now?
Oil prices kept falling this week, driven by potential progress in Ukraine-Russia talks and a potential slowdown in the Giant Panda’s (China) economic growth due to epidemic lockdowns in some regions where a surge of Omicron was observed.
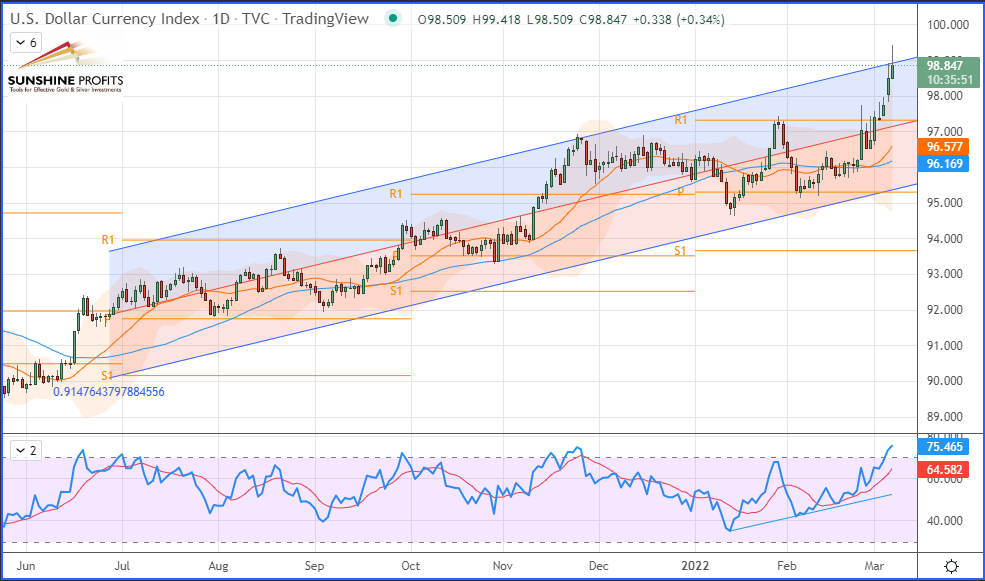
As I mentioned in my previous article, India considers getting Russian crude oil supplies and other commodities at a reduced price by settling transactions through a rupee/rouble payment system. Meanwhile, we keep getting rumors – notably reported by The Wall Street Journal – that Saudi Arabia and China are also currently discussing pricing some Saudi oil exports directly in yuan. The Chinese are actively seeking to dethrone the dollar as the world’s reserve currency, and this latest development suggests that the petrodollar is now under threat.
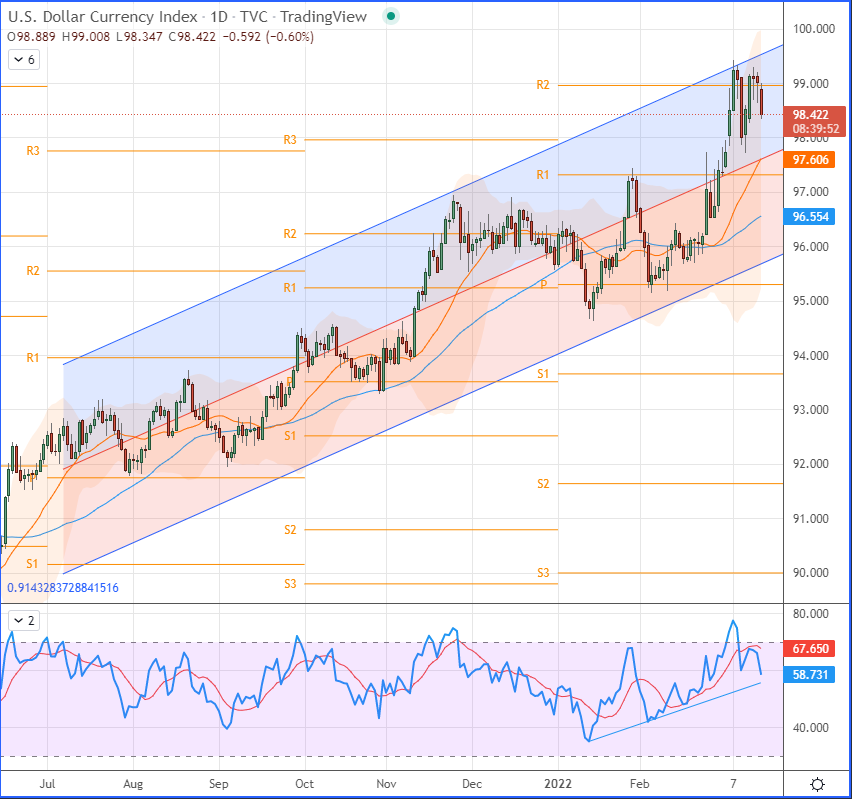
US Dollar Currency Index (DXY) CFD (daily chart)
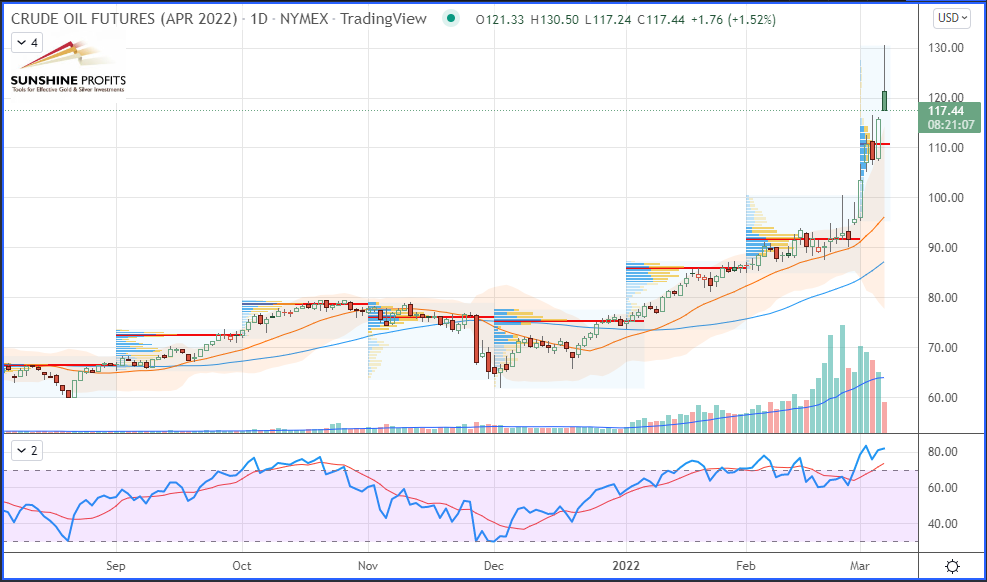
The recent correction in crude oil, happening just seven days after reaching its 14-year highs, might show some signs that the conflict in Ukraine will slow down consumption. On the other hand, if Iranian and Venezuelan barrels flooded the market, we could see crude oil, petroleum products, and distillates turning into new bear markets.
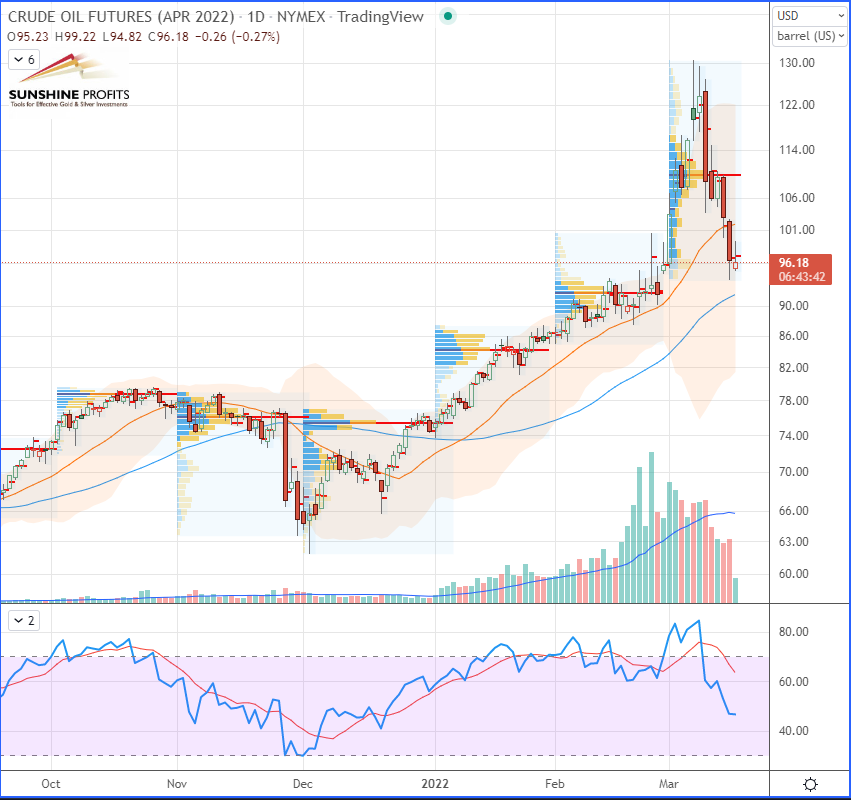
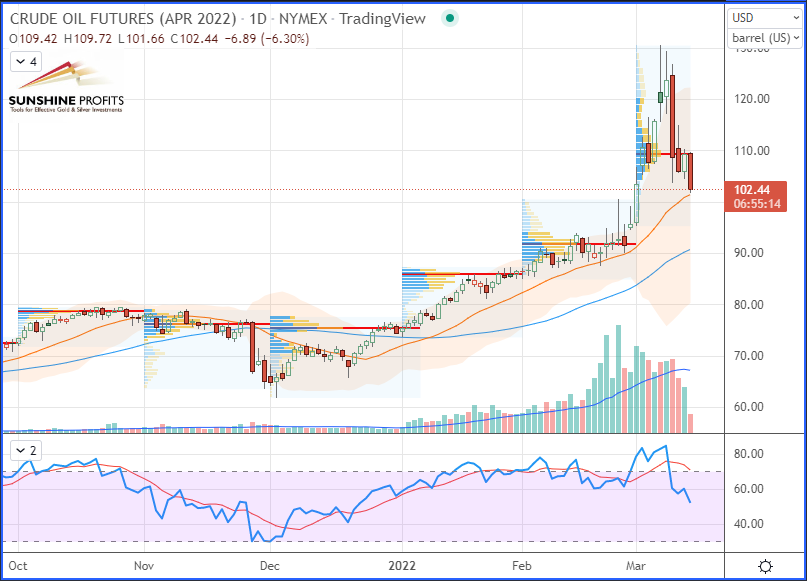
WTI Crude Oil (CLJ22) Futures (April contract, daily chart)
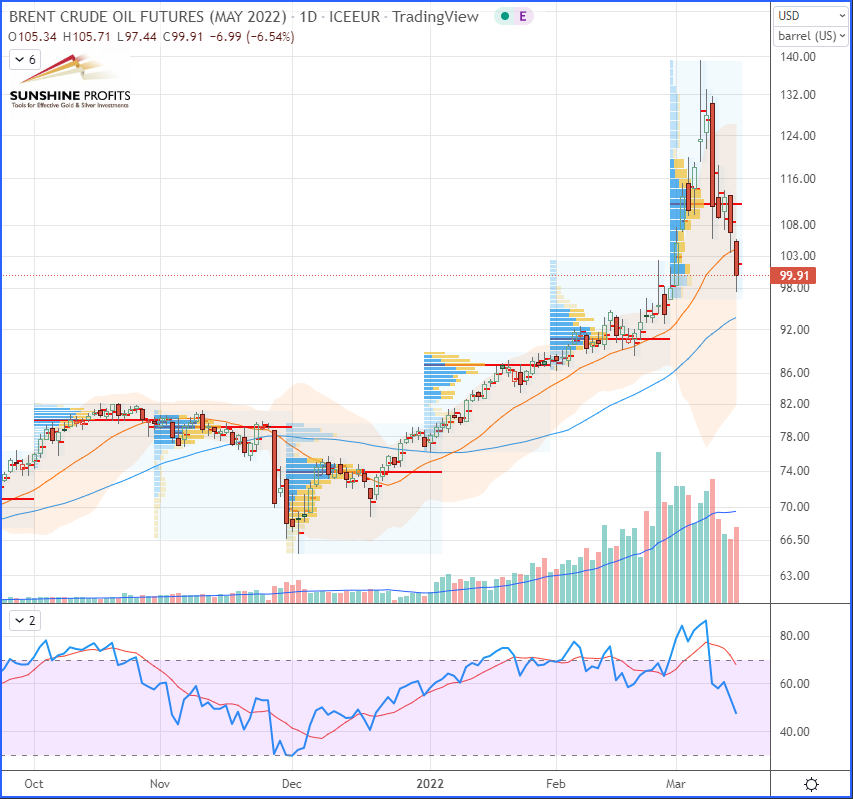
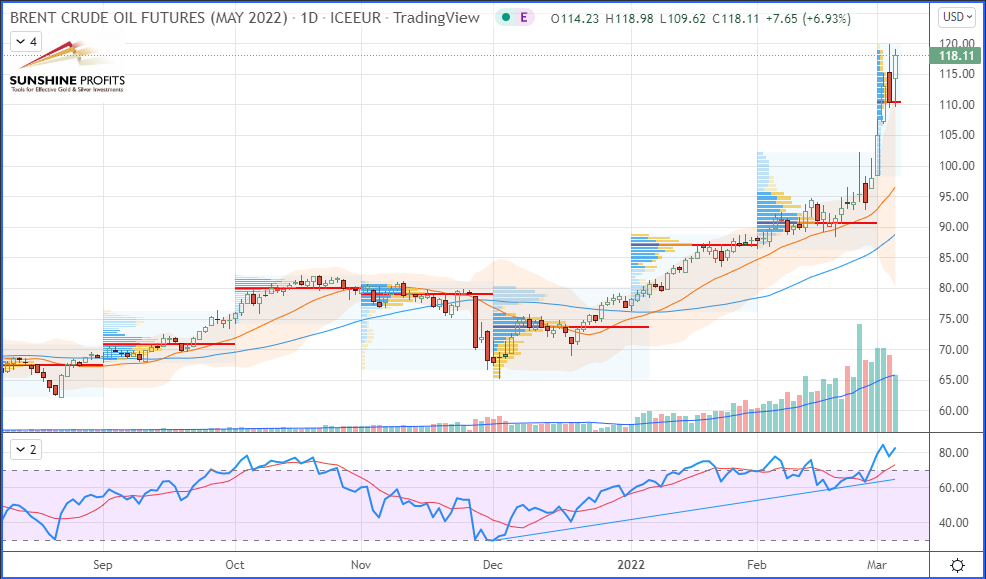
Brent Crude Oil (BRNK22) Futures (May contract, daily chart)
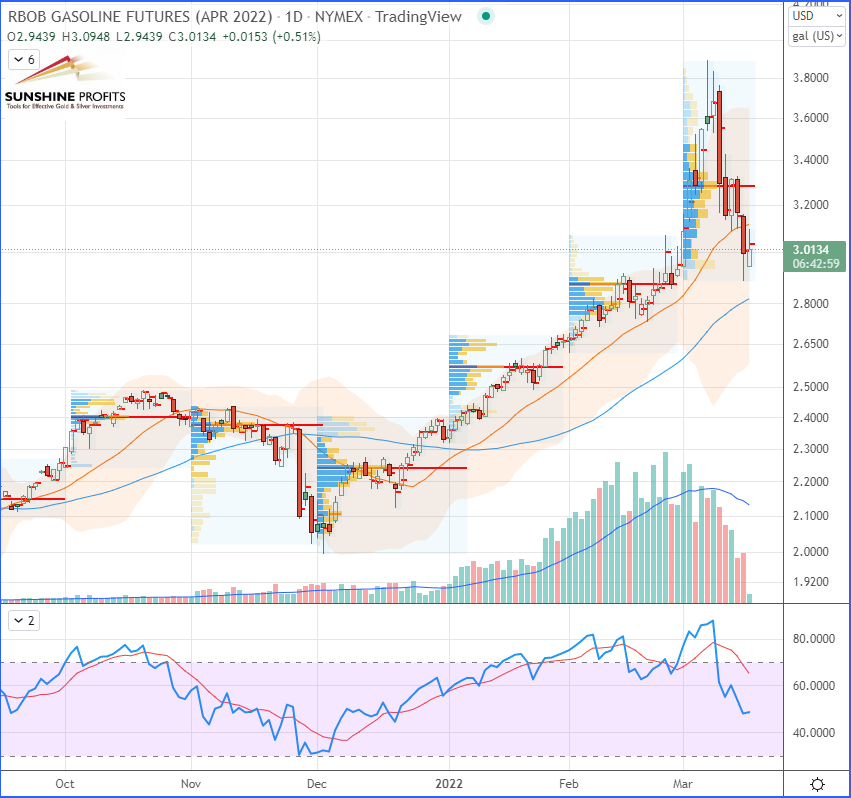
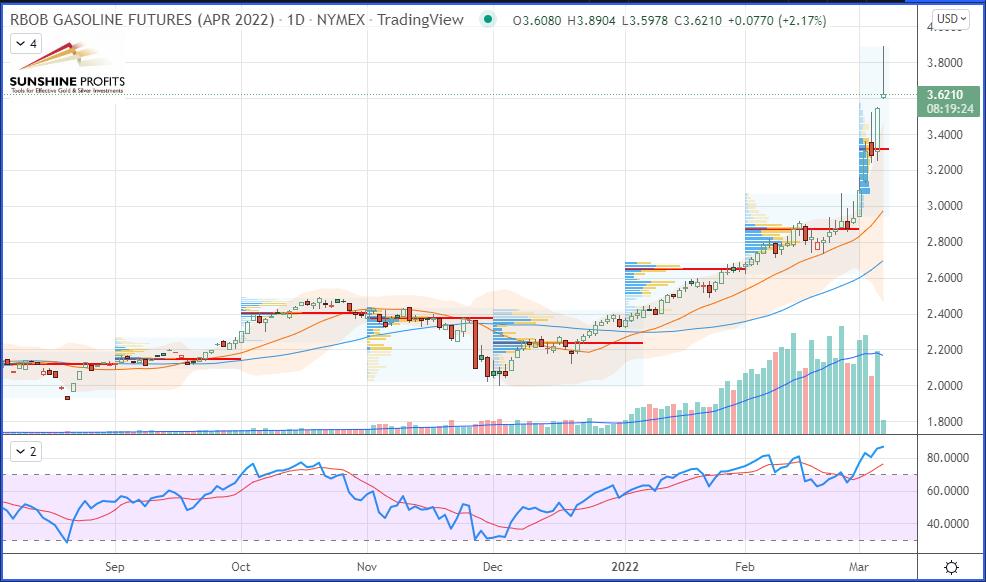
RBOB Gasoline (RBJ22) Futures (April contract, daily chart)
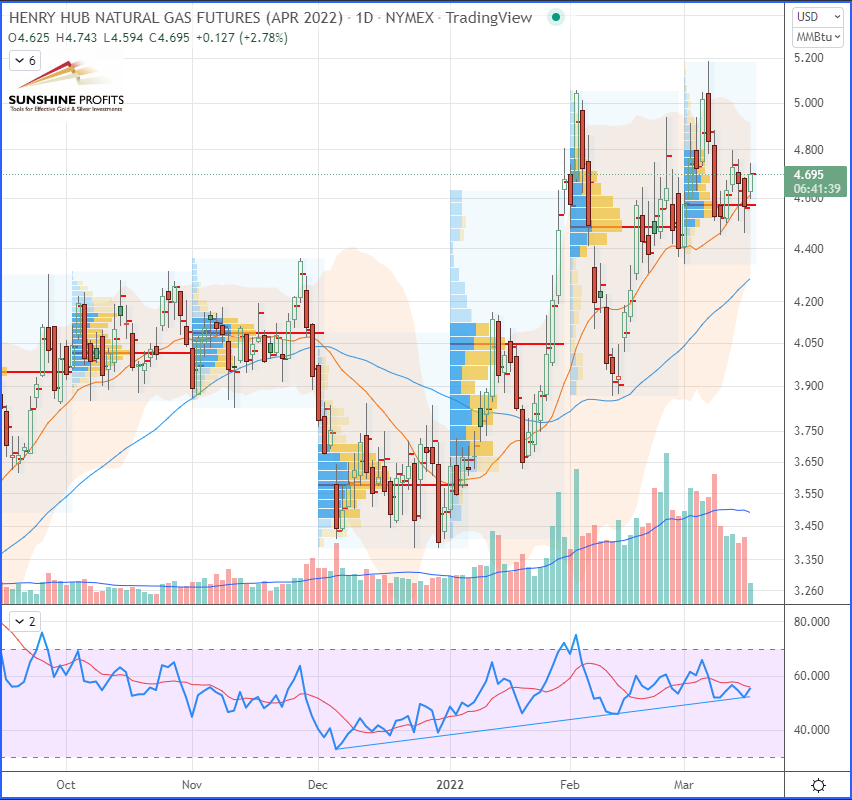
Henry Hub Natural Gas (NGJ22) Futures (April contract, daily chart)
That’s all folks for today – happy trading!
Today's premium Oil Trading Alert includes details of our new trading position. Interested in more exclusive updates? Join our premium Oil Trading Alerts newsletter and read all the details today.
Thank you.
Sebastien Bischeri,
Oil & Gas Trading Strategist -
Is It Time for Brent and WTI Crude Oil Futures to Correct Lower?
March 14, 2022, 11:34 AMCrude oil prices are slipping from their recent highest levels. Where could we see the next support located?
Oil prices fell sharply on Monday – extending last week’s decline – driven by potential progress in Ukraine-Russia talks.
India is considering taking advantage of Russia's discounted crude oil and other commodities offers by settling transactions through the rupee/ruble payment system. Meanwhile, on the eastern side, there is a rush to replace the Russian barrels in the west, but immediate availability is limited.
In addition, some fears that OPEC+ countries might not be able to easily increase supply remain, even though the UAE said last week that OPEC+ could double the output to the market (about 800,000 bpd) very quickly. However, this sounds very challenging since OPEC+ countries have already struggled to bring in 400,000 bbd.
On the Asian side, a slowdown in demand could have been seen as 17 million residents in Shenzhen, the technological centre of southern China, were locked down on Sunday after reports of epidemic outbreaks linked to the neighbouring territory of Hong Kong, where the Omicron strain seems to have spread. There are growing fears that other cities could follow suit to comply with the country's strict zero-COVID policy, adopted by the government of the People's Republic of China.
 WTI Crude Oil (CLJ22) Futures (April contract, daily chart)
Today's premium Oil Trading Alert includes details of our new trading position. Interested in more exclusive updates? Join our premium Oil Trading Alerts newsletter and read all the details today.
Thank you.
Sebastien Bischeri,
Oil & Gas Trading Strategist -
Natural Gas: When A Trade Plan Provides Consecutive Wins
March 11, 2022, 9:57 AMFrom time to time, we may want to consider volatility as an ally. After all, why would highly volatile markets necessarily mean more losing trades?
The first target was hit – BOOM! Today – just before the weekend – it is time to bank some profits from my recent trade projections (provided on March 2). Since then, the trade plan has provided our dear subscribers with multiple bounces to trade the NYMEX Natural Gas Futures (April contract) in various ways, always depending on each one’s personal risk profile.
The first possibility is the swing trading with trailing stop method explained in my famous risk management article.
Trade entry triggered on Tuesday, March 8 (firm rebound on yellow band), stop lifted once price extends beyond mid-point (median) price between first target and entry, thus ending at $4.607 (black dotted line), given the market closed at its daily high of $4.704 (purple dotted line) that same day and assuming you entered that long trade at $4.550 (top of the yellow band). That was a quick one that lasted only a couple hours for the day traders who closed their trades at the regular market close (two candles later, see below chart). For the swing traders, the win-stop was triggered the next day (Wednesday) on the following pull-back.
Henry Hub Natural Gas (NGJ22) Futures (April contract, hourly chart)The second option is to scalp the rebounds with fixed targets (active or experienced traders).This method consists of “riding the tails” (or the shadows). To get a better grasp of this concept, let’s zoom out on a 4H-chart so you can see the multiple rebounds of the price characterized by the shadows (or tails) of candlesticks, where a crowd of bulls are placing buy orders around that yellow support zone, therefore squeezing bears by pushing prices towards the upside (like some sort of rope pulling game). This trading style often requires stops to be tighter with some profit-to-risk ratio greater than 1.5 (with usually fixed targets).
Henry Hub Natural Gas (NGJ22) Futures (April contract, 4H chart)
Third possibility: position trading. This is probably the most passive trading style, as it would suit everyone’s busy timetable (and be the most rewarding). This is usually the one we privilege at Sunshine Profits since it allows us to provide trade projections some time in advance for our patient sniper traders to lock in their trading targets and take sufficient time to assess the associated risk with each projection as part of a full trade plan (or flying map).

Let’s zoom out again to spot our first target getting hit today on a daily chart so we can have an overall view of the next target to be locked in while lifting our stop to breakeven (entry), previous swing low ($4.450) or using an Average True Range (ATR) ratio as some of you may like to use:
Henry Hub Natural Gas (NGJ22) Futures (April contract, daily chart)
That’s all folks for today. Have a great weekend!
Today's premium Oil Trading Alert includes details of our new trading position. Interested in more exclusive updates? Join our premium Oil Trading Alerts newsletter and read all the details today.
Thank you.
Sebastien Bischeri,
Oil & Gas Trading Strategist -
Crude Oil Climbs High. Is It Enough to Enjoy a Better View?
March 7, 2022, 10:19 AMThe threat of sanctions caused a stir in the markets: WTI spiked above $130 and Brent is nearing the $140 mark. Where is crude oil going next?
A possible Western embargo on Russian oil caused oil prices to soar again on Monday, as stock markets feared persistent inflation and a consequent economic slowdown.
On the US dollar side, the continued rally of the greenback has propelled the dollar index (DXY) towards higher levels, as it is now approaching the three-figure mark ($100), even though it has not had a huge impact on crude oil, other petroleum products, or any other commodities in general. What we rather witness here is the greenback’s safe haven effect attracting investors, much like gold would tend to act in a “store of value” role.
US Dollar Index (DXY) CFD (daily chart)
On the geopolitical scene, Russia-Ukraine peace talks will be resumed today in Brest (Belarus) at 14:00 GMT, while another meeting is already scheduled at the Antalya Diplomacy Forum on Thursday in Turkey. Russian Foreign Minister Sergei Lavrov and his Ukrainian counterpart Dmytro Kuleba will talk there in the presence of the Turkish foreign minister. We might therefore expect some de-escalation in the Black Sea basin this week if the two parties involved were able to reach an agreement after further negotiations.
WTI Crude Oil (CLJ22) Futures (April contract, daily chart)
Brent Crude Oil (BRNK22) Futures (May contract, daily chart)
RBOB Gasoline (RBJ22) Futures (April contract, daily chart)
Henry Hub Natural Gas (NGJ22) Futures (April contract, daily chart)
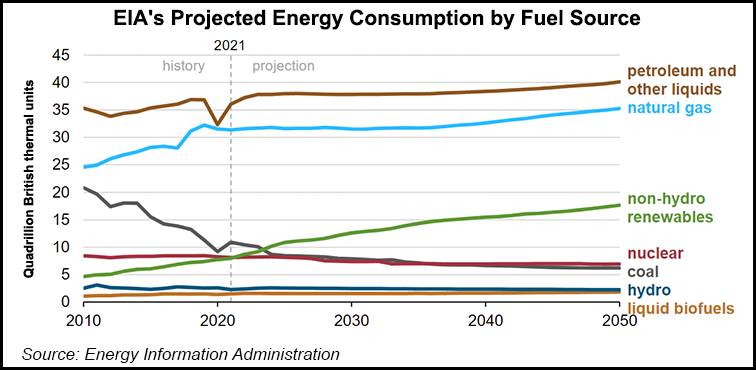
Regarding natural gas, the U.S. Energy Information Administration (EIA) published its Annual Energy Outlook (AEO) 2022 report, suggesting that even with non-hydro renewable sources set to rapidly grow through 2050, oil and gas-derived sources should still remain the top energy sources to fuel most of the United States. The agency is forecasting a rise in the production of Liquefied Natural Gas (LNG) – which mainly comes from shale gas – by at least 35%!
In summary, the threat of sanctions has already wiped out almost all Russian oil – at least 7% of global supply – from the world oil market. In the weeks or months to come, we can see sanctions on Russian oil exports create a boomerang effect on European economies, decreasing world market supply, increasing prices for industry, as well as even more rising expenses, and thus cost of living through a ripple effect.
Today's premium Oil Trading Alert includes details of our new trading position. Interested in more exclusive updates? Join our premium Oil Trading Alerts newsletter and read all the details today.
Thank you.
Sebastien Bischeri,
Oil & Gas Trading Strategist


Free Gold & Oil Newsletter
with details not available
to 99% investors
+ 7 days of Gold Alerts
+ Mining Stock Rankings
Gold Alerts
More-
Status
New 2024 Lows in Miners, New Highs in The USD Index
January 17, 2024, 12:19 PM -
Status
Soaring USD is SO Unsurprising – And SO Full of Implications
January 16, 2024, 8:40 AM -
Status
Rare Opportunity in Rare Earth Minerals?
January 15, 2024, 2:06 PM
Metals charts


