

Please note that due to market volatility, some of the key levels may have already been reached and scenarios played out.
Trading positions
- Natural Gas [NGJ22]
Long around the $4.490-4.550 support area (yellow band) with a stop at $4.340 and targets at $4.745 & $4.860 – More details in previous Oil Trading Alert. - RBOB Gasoline [RBJ22]
No new position justified on a risk/reward point of view. - WTI Crude Oil [CLJ22]
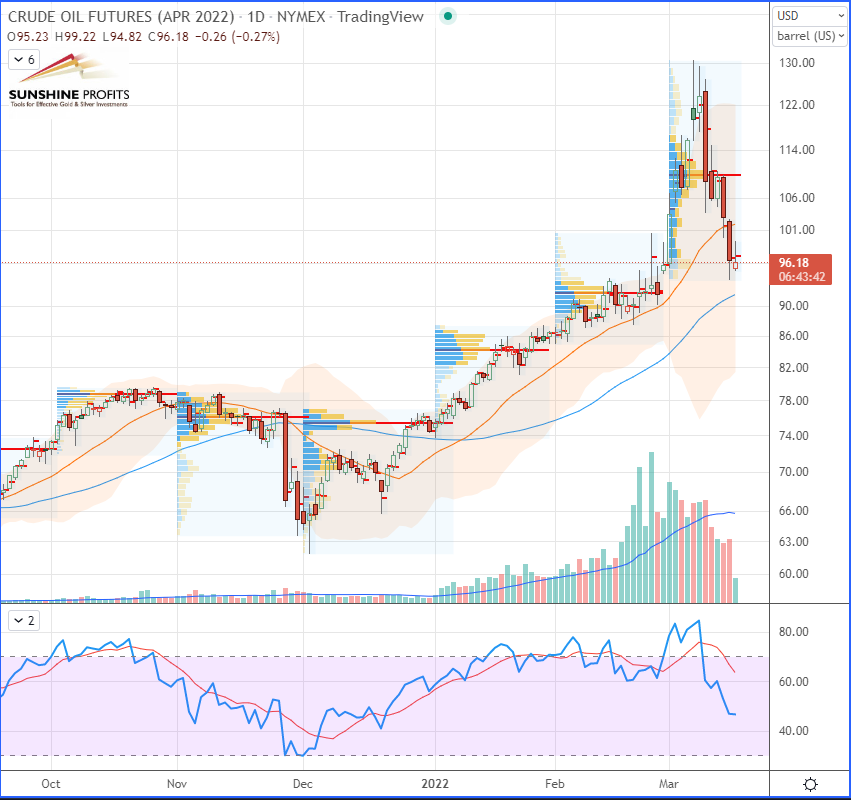
Long around the $89.64-92.40 support area (yellow band) with a stop at $87.06 and targets at $99.10 & $109.20. - Brent Crude Oil [BRNK22]
Long around the $92.81-95.26 support area (yellow band) with a stop at $88.24 and targets at $102.26 & $113.15.
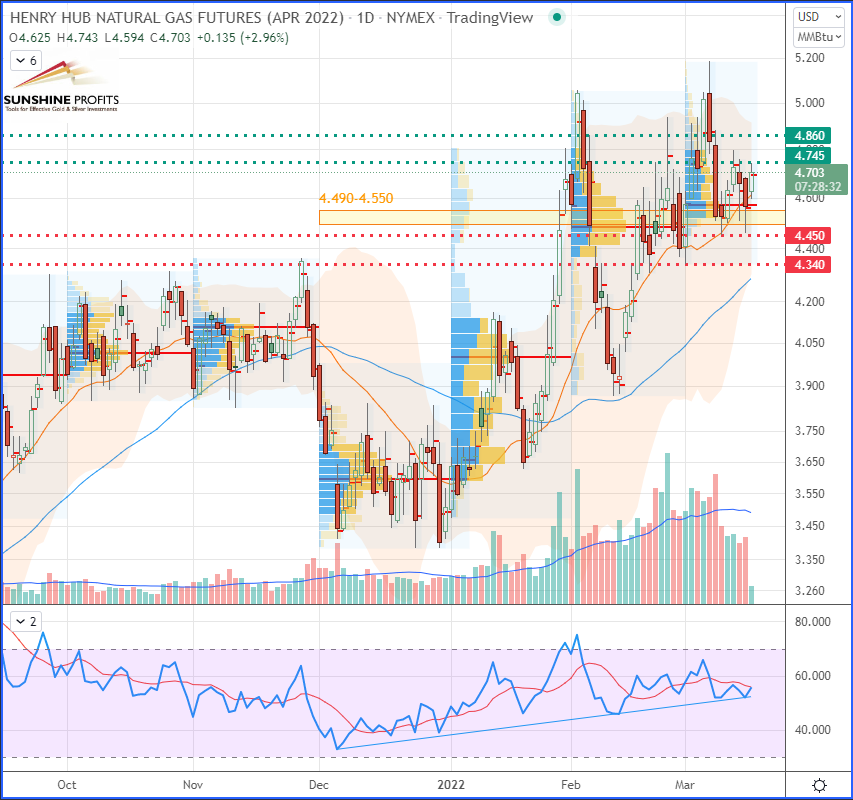
Henry Hub Natural Gas (NGJ22) Futures (April contract, daily chart)
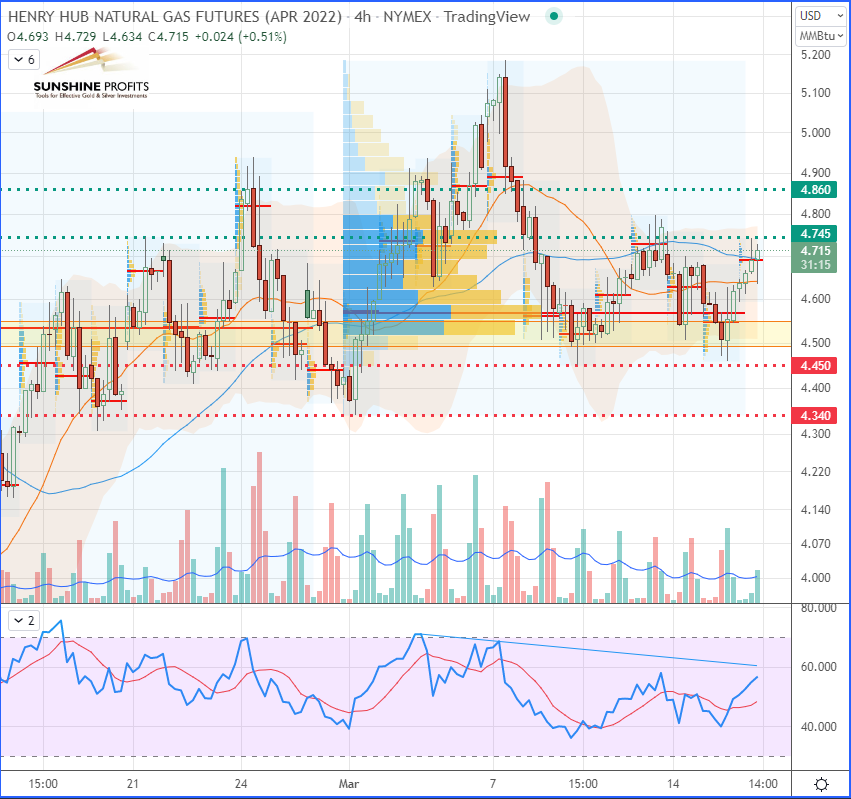
Henry Hub Natural Gas (NGJ22) Futures (April contract, 4H chart)
As it was detailed in last Friday’s Oil Trading Alert, NYMEX natural gas offered several entry options for various profiles of traders. The support provided even served to trigger a new rebound on Monday and Tuesday, as you can see on the above chart.
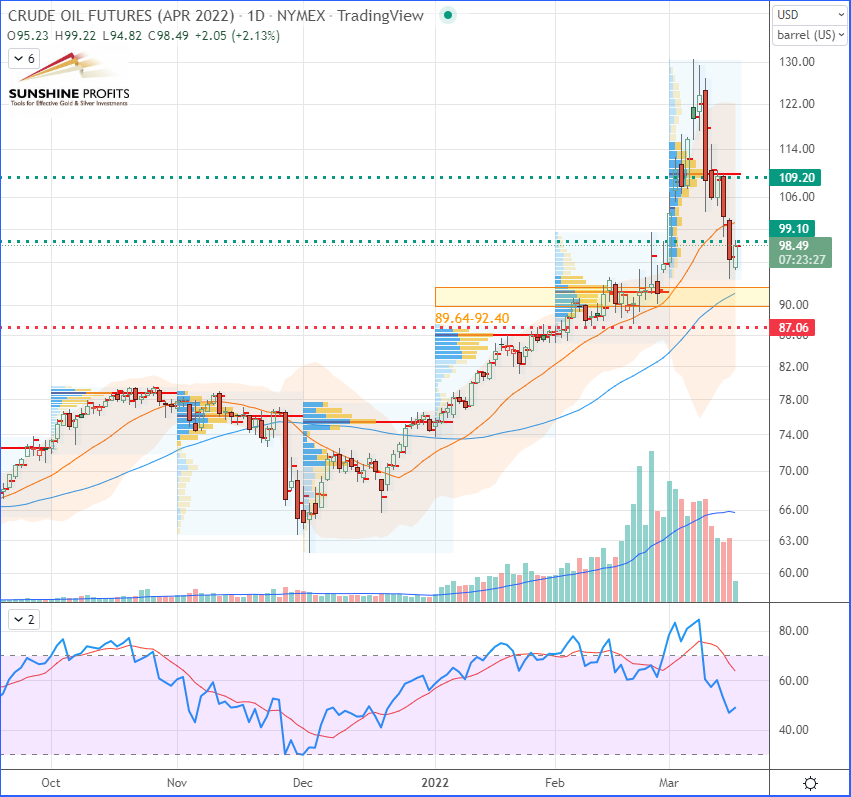 WTI Crude Oil (CLJ22) Futures (April contract, daily chart)
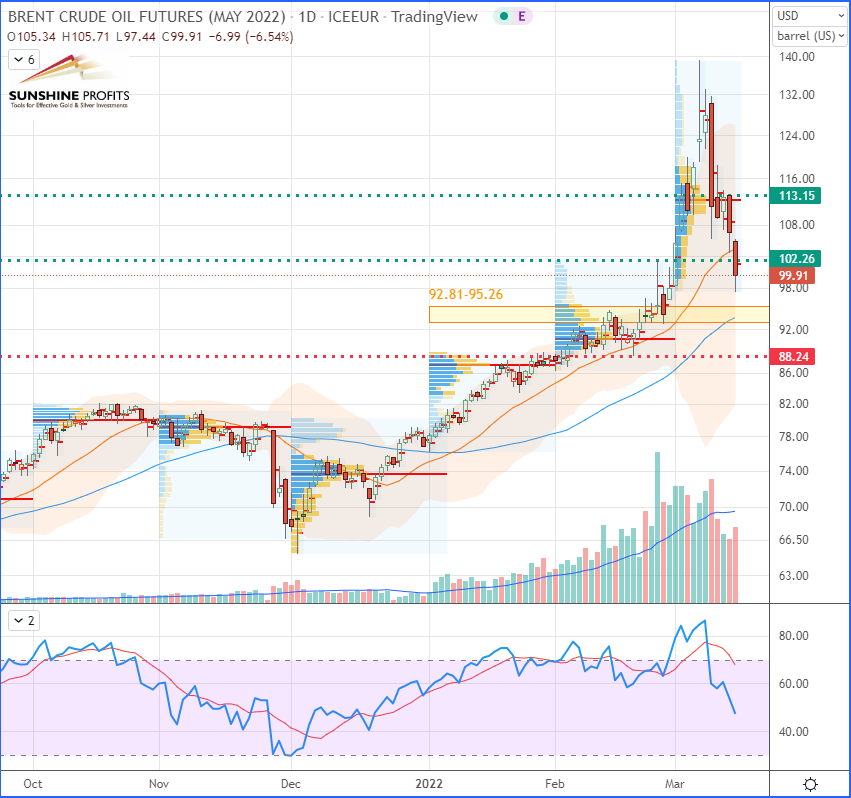
Brent Crude Oil (BRNK22) Futures (May contract, daily chart)
Regarding risk management, it is always best to define your strategy according to your own risk profile. For some guidance on trade management, read one of my articles on that topic.
Oil prices kept falling this week, driven by potential progress in Ukraine-Russia talks and a potential slowdown in the Giant Panda’s (China) economic growth due to epidemic lockdowns in some regions where a surge of Omicron was observed.
As I mentioned in my previous article, India considers getting Russian crude oil supplies and other commodities at a reduced price by settling transactions through a rupee/rouble payment system. Meanwhile, we keep getting rumors – notably reported by The Wall Street Journal – that Saudi Arabia and China are also currently discussing pricing some Saudi oil exports directly in yuan. The Chinese are actively seeking to dethrone the dollar as the world’s reserve currency, and this latest development suggests that the petrodollar is now under threat.
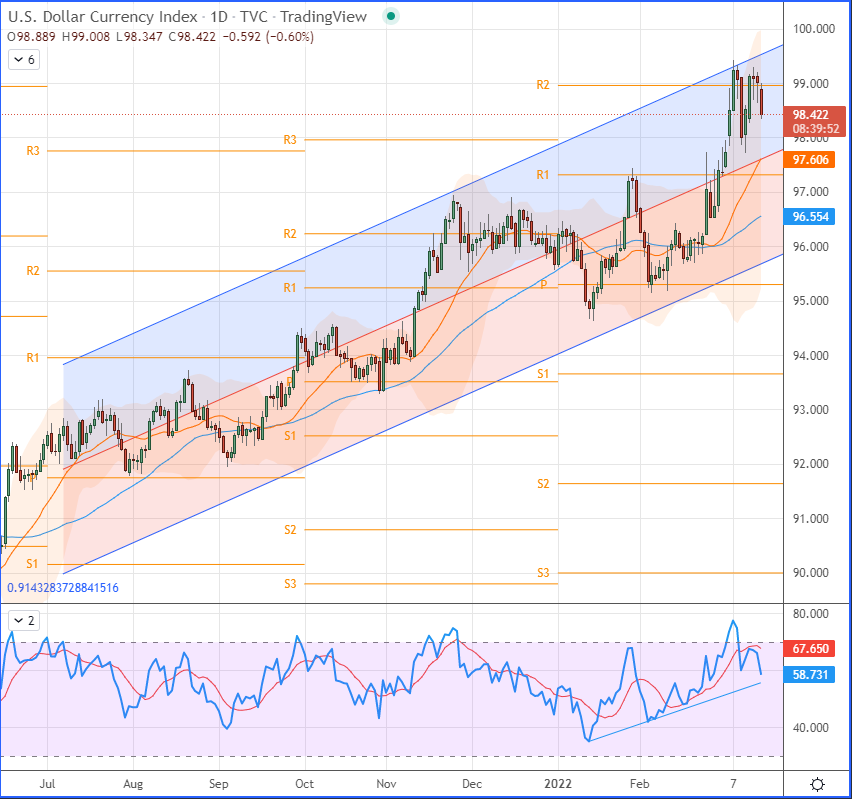
US Dollar Currency Index (DXY) CFD (daily chart)
The recent correction in crude oil, happening just seven days after reaching its 14-year highs, might show some signs that the conflict in Ukraine will slow down consumption. On the other hand, if Iranian and Venezuelan barrels flooded the market, we could see crude oil, petroleum products, and distillates turning into new bear markets.
WTI Crude Oil (CLJ22) Futures (April contract, daily chart)
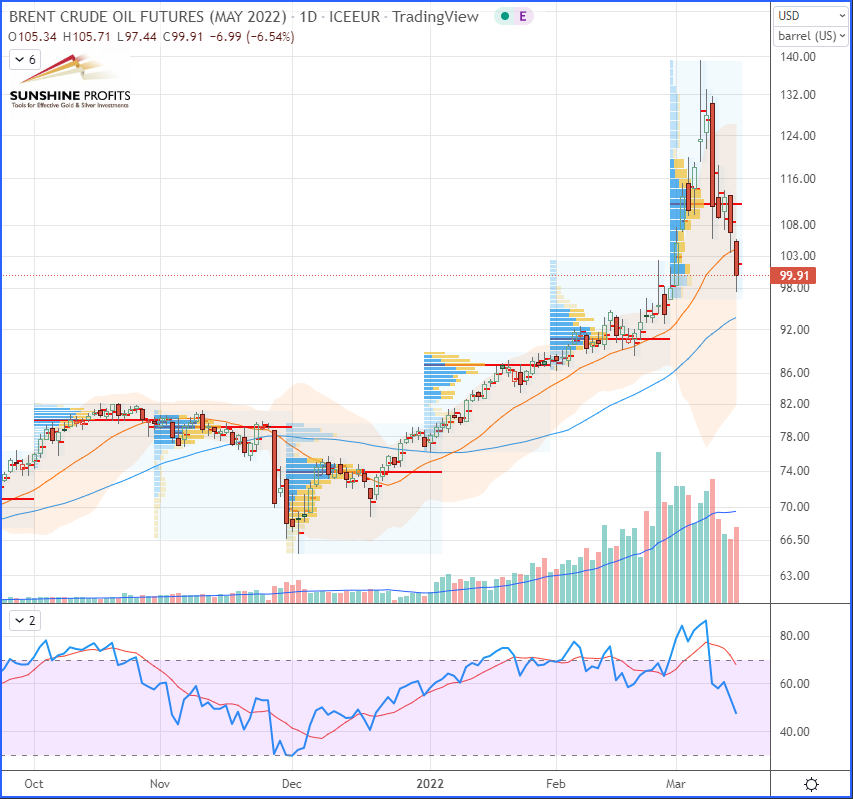
Brent Crude Oil (BRNK22) Futures (May contract, daily chart)
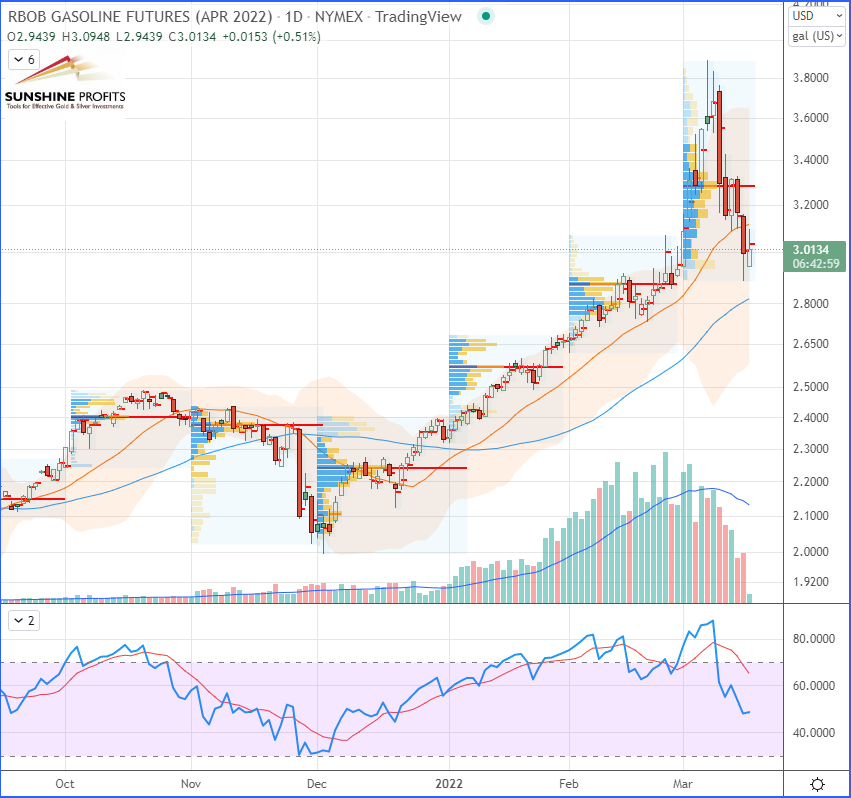
RBOB Gasoline (RBJ22) Futures (April contract, daily chart)
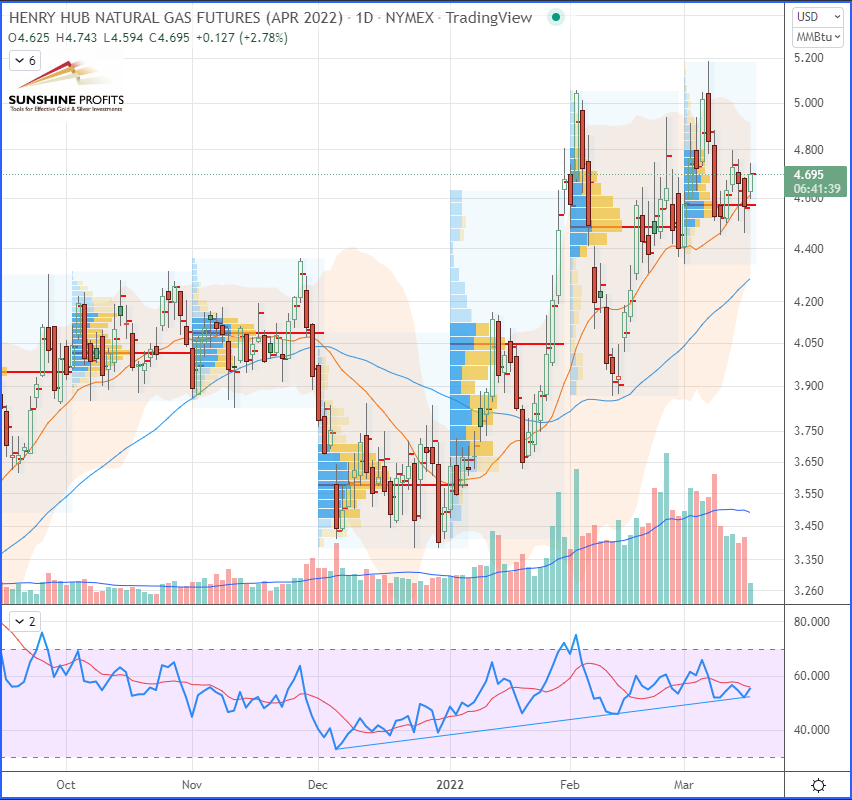
Henry Hub Natural Gas (NGJ22) Futures (April contract, daily chart)
That’s all folks for today – happy trading!
As always, we’ll keep you, our subscribers well informed.
Thank you.
Sebastien Bischeri
Oil & Gas Trading Strategist

