
tools spotlight

-
A Golden Shot of Opportunity from this Mining ETF?
March 9, 2021, 6:23 AMDo you want to get your fix before the precious metals slide again? Recent moves in gold and the USD have made miners an attractive short-term bet.
The liqueur known as Danziger Goldwasser is well known for the fact that it contains small flakes of 23 karat gold in it, and its tradition dates back to the XVI century. You can drink it neat or mix it into a concoction, and it will make for a great way to celebrate gold’s eventual rise. But we’re not quite there yet and cocktails are meant to be drunk slowly. The GDX miner’s ETF shot will be best when downed quickly.
Gold moved to new yearly lows yesterday (Mar. 8) and mining stocks didn’t. That’s a very good indication that a short-term bottom in the precious metals sector is likely in.
One of the key indicators that was constantly pointing to lower precious metals values over the past several months was mining stocks’ weak performance relative to gold. This trend has now – at least temporarily – reversed, so it’s very important that one pays attention to it.
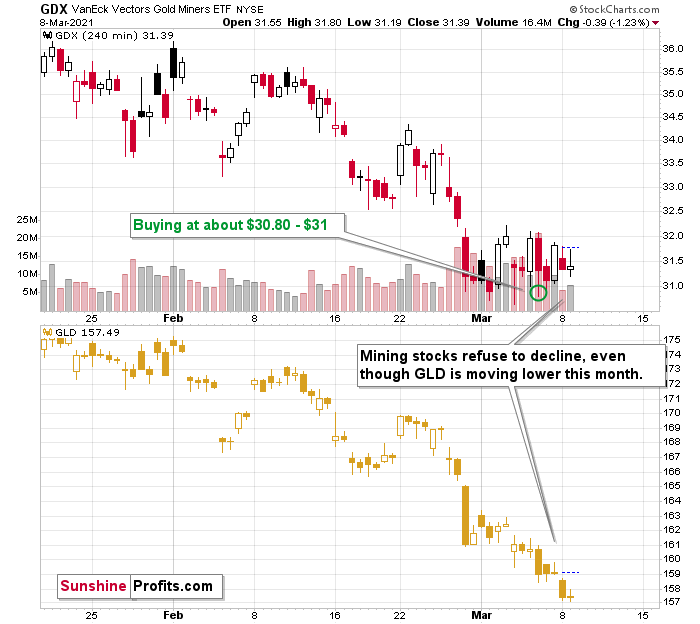
Figure 1 – VanEck Vectors Gold Miners ETF (GDX) and GLD ETF Comparison
The above 4-hour chart (each candlestick represents 4 hours of trading) makes it crystal-clear that the late-February bottom was the moment after which miners stopped declining and started to trade sideways. Gold (here: the GLD ETF, which I’m using to have an apples-to-apples comparison – both ETFs trade on the same exchange) continued to decline in March. Well, to be precise, miners did form new yearly lows in March, and we went long almost right at one of those intraday lows, but the moves were not significant enough to really change anything.
So, since miners no longer want to decline, there are only two other things left for them to do: either nothing or rally.
They’ve been doing nothing for the past several days, due to the lack of bullish leadership in gold. And it seems that they are going to get this bullish ignition any day, or hour now.
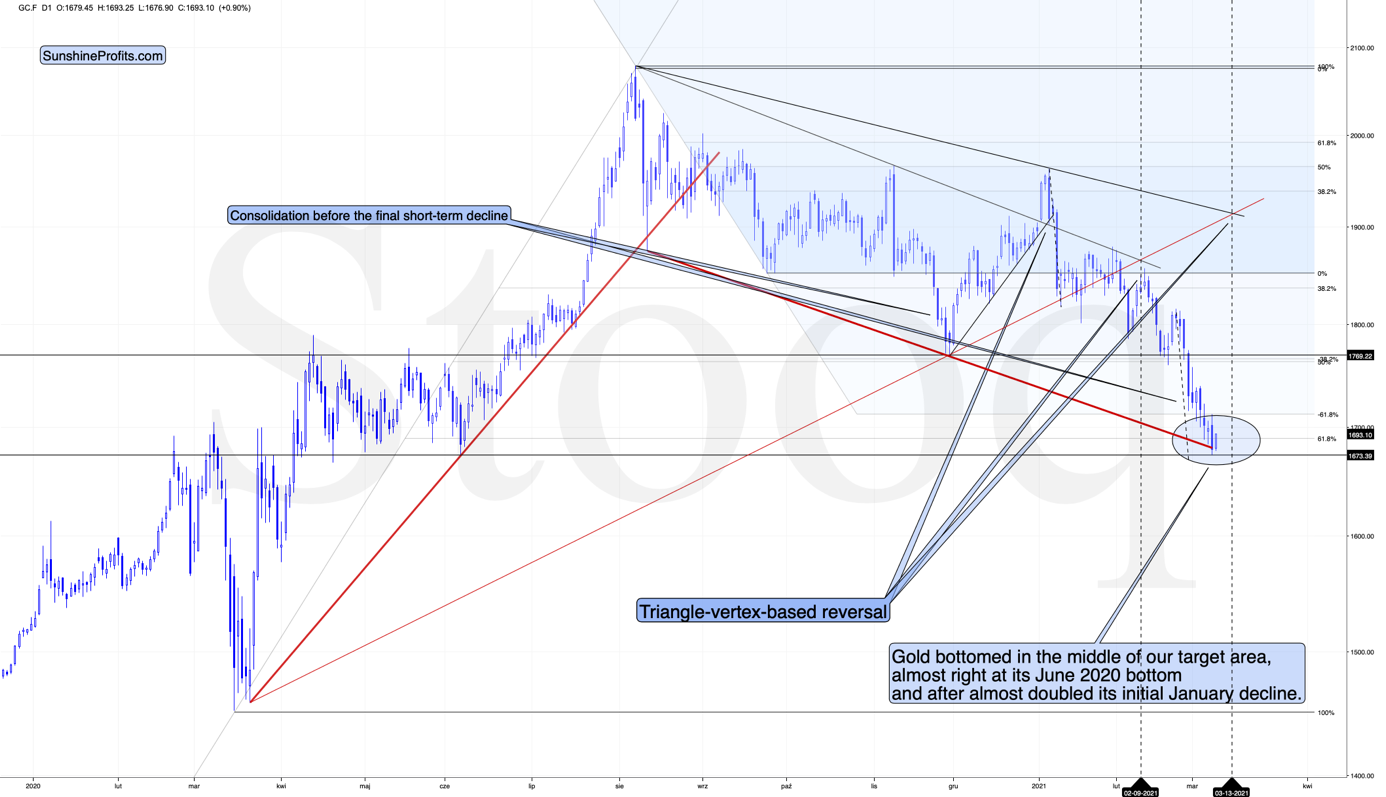
Figure 2 - COMEX Gold Futures (GC.F)
Gold is moving back up in today’s pre-market trading and since miners were able to shrug off yesterday’s decline, then today’s comeback would likely trigger their upswing.
Please keep in mind that the upswing mind be relatively short-lived – perhaps lasting only one week or so. There’s a triangle-vertex-based reversal point on Monday, so it wouldn’t be surprising to see an interim top at that time, especially considering that:
- The triangle-vertex-based turning points have been working particularly well in the recent past – they marked the January and February tops.
- The corrective upswings during this medium-term decline (especially in mining stocks) often took about a week to complete – at least the easy part of the upswing took a week.
The USD Index has been rallying relentlessly – just like in 2018 – in the last couple of days, but a quick pullback would not be surprising. In fact, the USD Index is already lower in today’s pre-market trading.
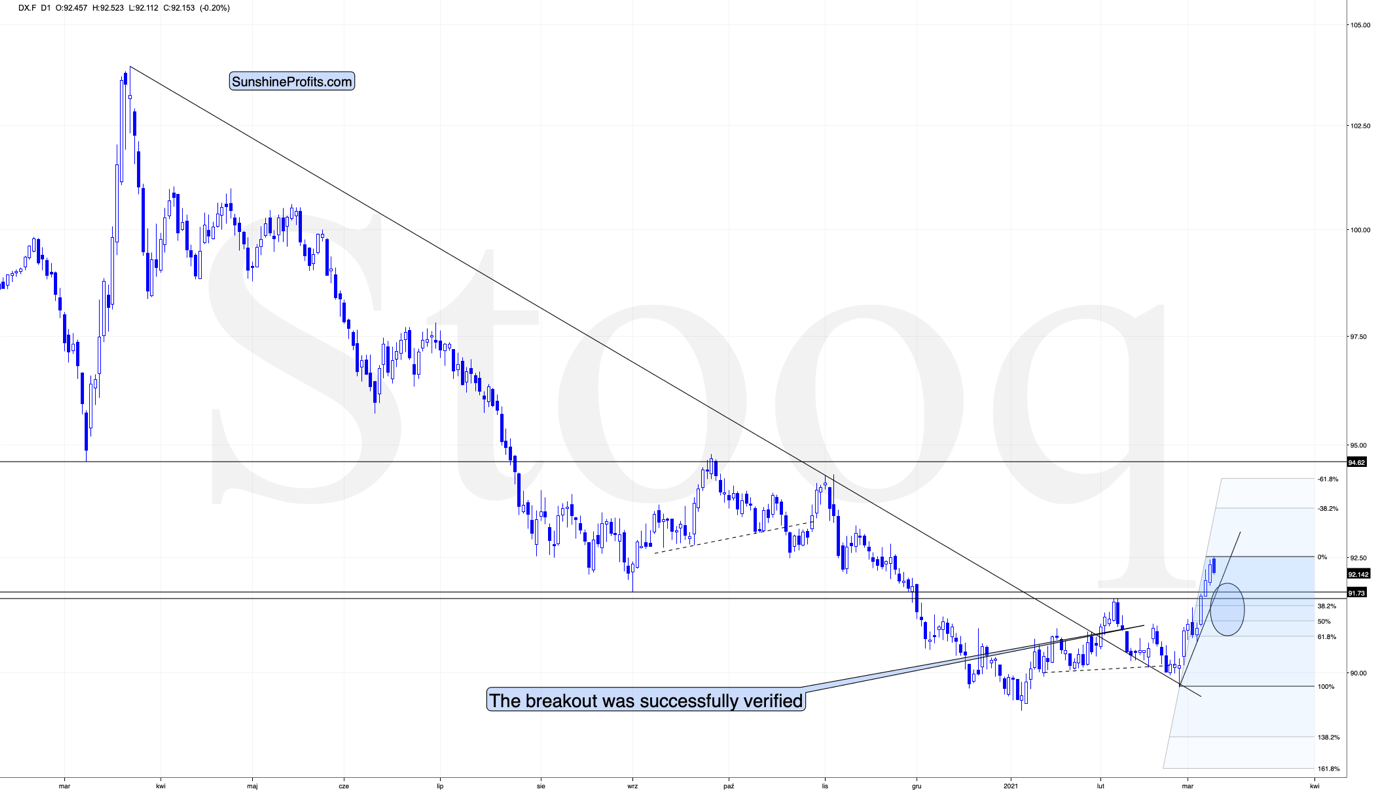
Figure 3 - USD Index (DX.F)
Yesterday, the USD Index closed above its lowest daily closing price of August 2020 (92.13), but at the moment of writing these words, it’s already after a move back below it. If the USDX closes the day below it, we’ll have an invalidation of a breakout with bearish implications for the very short term.
How low could the USD Index move during this pullback? Not particularly low, as the similarity to 2018 implies a rather unbroken rally. The February 2021 high of 91.6 seems to be a quite likely target, but we might see the USDX move a bit lower as well – perhaps to one of the classic Fibonacci retracements based on the recent upswing – lowest of them (the 61.8% one) being at about 90.8.
Ultimately, it seems that the above corrections will result in the GDX ETF moving to about $34 or so.

Figure 4 - VanEck Vectors Gold Miners ETF (GDX)
The resistance levels in the $34 - $35 area are provided by:
- The late-February 2020 high
- The rising neck level of the previously completed head and shoulders pattern
- The analogy to how big miners’ correction was in April (assuming that the mirror similarity continues)
- The declining blue resistance line
- The 50-day moving average
Consequently, the GDX is likely to form a top in the above-described area.
After breaking below the head-and-shoulders pattern, gold miners would then be likely to verify this breakdown by moving back up to the neck level of the pattern. Then, we would likely see another powerful slide – perhaps to at least $24.
This is especially the case, since silver and mining stocks tend to decline particularly strongly if the stock market is declining as well. And while the exact timing of the market’s slide is not 100% clear, the day of reckoning for stocks is coming, and it might be very, very close.
As I explained previously, based on the similarities to the 1929 and 2008 declines, it could be the case that the precious metals sector declines for about three months after the general stock market tops. And it seems that we won’t have to wait long for the latter. In fact, the next big move lower in stocks might already be underway, as the mid-Feb. 2021 top could have been the final medium-term top.
In conclusion, the gold miners should continue to glisten as oversold conditions buoy them back to the $33-$35 range. Due to the GDX ETF’s recent strength, combined with gold rallying off of the lows on Mar. 5, the PMs could enjoy a profitable one-week (or so) party. However, with the celebration likely to be short-lived, it’s important to keep things in perspective. While this week’s performance may elicit superficial confidence, medium-term clouds have already formed. As a result, positioning for an extended rally offers more risk than reward.
Thank you for reading our free analysis today. Please note that the above is just a small fraction of the full analyses that our subscribers enjoy on a regular basis. They include multiple premium details such as the interim targets for gold and mining stocks that could be reached in the next few weeks. We invite you to subscribe now and read today’s issue right away.
Sincerely,
Przemyslaw Radomski, CFA
Founder, Editor-in-chief -
How to Join the Mining Party… Before it Ends
March 8, 2021, 11:42 AMForget gold and silver for a moment. Do you hear the music? Yes, it’s coming from the mining ETFs club. But how long will the party last?
And more importantly, why miners, you may ask? Because miners tend to outperform in the early days of a major rally.
After closing only $0.10 below my initial downside target of $31 on Mar. 1, the GDX ETF could be ripe for an upward revision. Able to ignore much of last week’s chaos, the GDX ETF’s outperformance of gold and silver signals that the tide has likely turned.
Please see below:
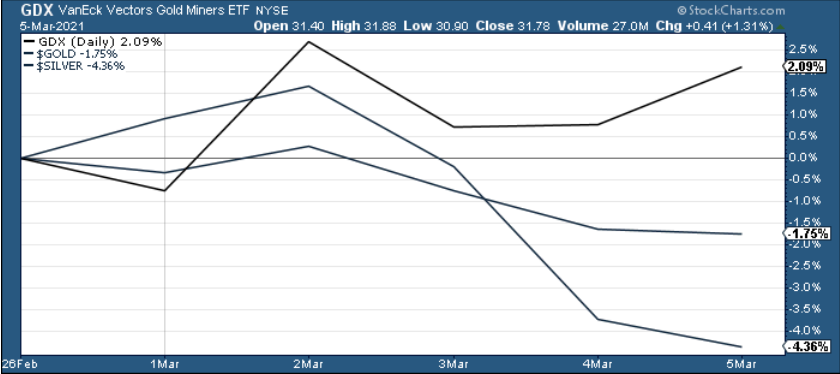
Figure 1
To that point, I warned on Mar. 1 that help was on the way:
The GDX ETF has garnered historical support at roughly $29.52. The level also coincides with the early-March high, the mid-April low and the 61.8% Fibonacci retracement level. As a result, a corrective upswing to ~$33/$34 could be the miners’ next move.
Furthermore, after alerting subscribers on Mar. 4 – writing that when gold moves to $1,692, we’ll automatically open long positions in the miners – the GDX ETF ended Friday’s (Mar. 5) session up by 3.2% from my initial entry of ~$30.80 - $31. Thus, from here, the GDX ETF has roughly 3.8% to 7.0% upside (as of Friday’s close) before the $33/$34 levels signals that the momentum has run its course.
For now, though, positioning for more upside offers a solid risk-reward proposition. Prior to the initial decline, miners were weak relative to gold. However, after outperforming on Mar. 5, their steady hand was a sign of short-term strength. If you analyze the chart below, you can see that the size and shape of the current price action actually mirrors what we witnessed back in April.
Please see below:
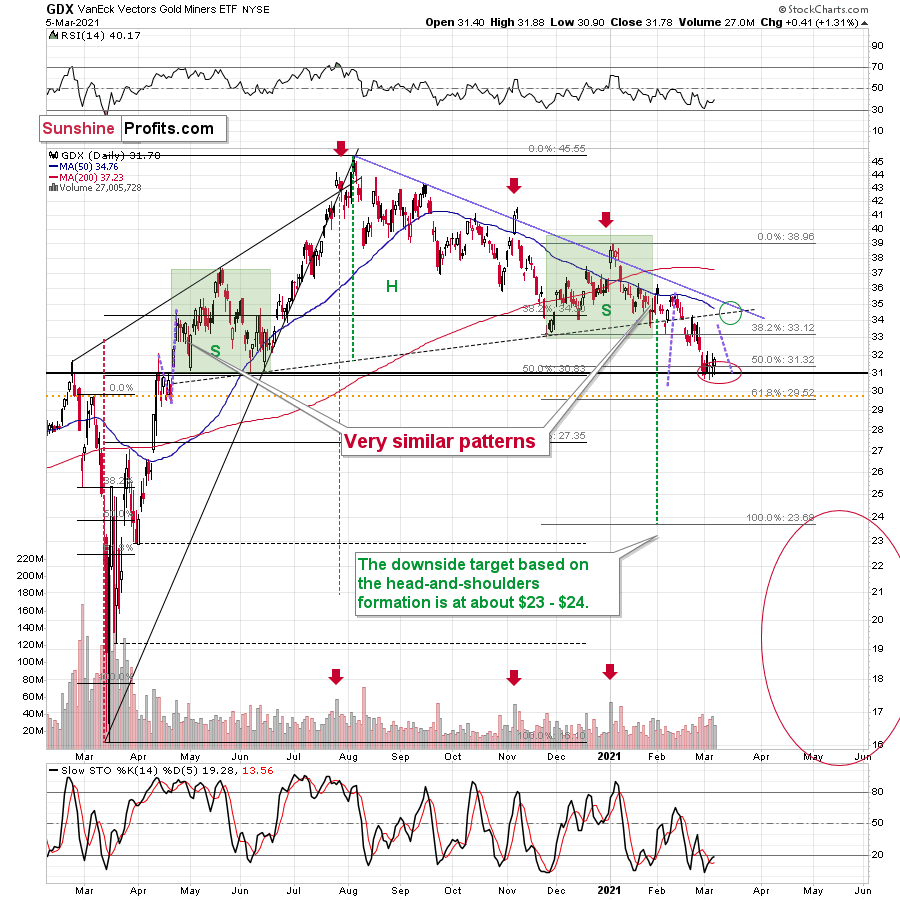
Figure 2 - VanEck Vectors Gold Miners ETF (GDX), GDX and Slow Stochastic Oscillator Chart Comparison – 2020
For context, I wrote on Mar. 5:
Miners stopped their decline practically right in my target area, which I based on the 50% Fibonacci retracement and the 2020 highs and lows. Moreover, the proximity of the $31 level corresponds to the 2019 high and the 2016 high. Since so many support levels coincide at the same price (approximately), the latter is likely to be a very strong support. Moreover, the RSI was just close to 30, which corresponded to short-term buying opportunities quite a few times in the past.
In addition, a short-term upswing could provide a potential pathway to $35 – as this level also corresponds with the GDX ETF’s late-February high, its monthly declining resistance line and its 50-day moving average. The abundance of resistance levels – combined with the fact that an upswing would further verify the GDX ETF’s breakdown below the neckline of its potential head and shoulders pattern – should keep the upward momentum in check.
Over the medium-term, the potential head and shoulders pattern – marked by the shaded green boxes above – also deserves plenty of attention.
For context, I wrote previously:
Ever since the mid-September breakdown below the 50-day moving average, the GDX ETF was unable to trigger a substantial and lasting move above this MA. The times when the GDX was able to move above it were also the times when the biggest short-term declines started.
(…)
The most recent move higher only made the similarity of this shoulder portion of the bearish head-and-shoulders pattern to the left shoulder (figure 2 - both marked with green) bigger. This means that when the GDX breaks below the neck level of the pattern in a decisive way, the implications are likely to be extremely bearish for the next several weeks or months.
Due to the uncanny similarity between the two green rectangles, I decided to check what happens if this mirror-similarity continues. I used purple, dashed lines for that. There were two important short-term price swings in April 2020 – one shows the size of the correction and one is a near-vertical move higher.
Copying these price moves (purple lines) to the current situation, we get a scenario in which GDX (mining stocks) moves to about $31 and then comes back up to about $34. This would be in perfect tune with what I wrote previously. After breaking below the head-and-shoulders pattern, gold miners would then be likely to verify this breakdown by moving back up to the neck level of the pattern. Then, we would likely see another powerful slide – perhaps to at least $24.
This is especially the case, since silver and mining stocks tend to decline particularly strongly if the stock market is declining as well. And while the exact timing of the market’s slide is not 100% clear, stocks’ day of reckoning is coming. And it might be very, very close.
As I explained previously, based on the similarities to the 1929 and 2008 declines, it could be the case that the precious metals sector declines for about 3 months after the general stock market tops. And it seems that we won’t have to wait long for the latter. In fact, the next big move lower in stocks might already be underway, as the mid-Feb. 2021 top could have been the final medium-term top.
In conclusion, the gold miners should continue to glisten as oversold conditions buoy them back to the $33-$35 range. Due to the GDX ETF’s recent strength, combined with gold rallying off of the lows on Mar. 5, the PMs could enjoy a profitable one-week (or so) party. However, with the celebration likely to be short-lived, it’s important to keep things in perspective. While this week’s performance may elicit superficial confidence, medium-term clouds have already formed. As a result, positioning for an extended rally offers more risk than reward.
(We normally include the "Letters to the Editor" section in the full version of Gold & Silver Trading Alerts only, but today I decided to include it also in this free version of the full (about 10x bigger than what you just read) analysis, so that you get the idea of how this part of the analysis looks like. It might be quite informative too. Enjoy:)
Letters to the Editor
Q: Could you update your thoughts regarding physical [gold and silver] for those looking to acquire additional positions - specifically, what do you think premiums and availability are going to look like when/if spot goes a $100 or $200 down from here? By way of example, I bought some U.S. gold buffaloes at $1854 spot at $1954. Those same coins at $1710 spot are still around $1930, if there are any to be found.
A: It’s a tough call, because the premium values don’t follow the technical patterns. Still, based on the analogy to situations that seem similar to what we saw recently, it seems that we can indeed say something about the likely physical values close to the likely $1,450 bottom.
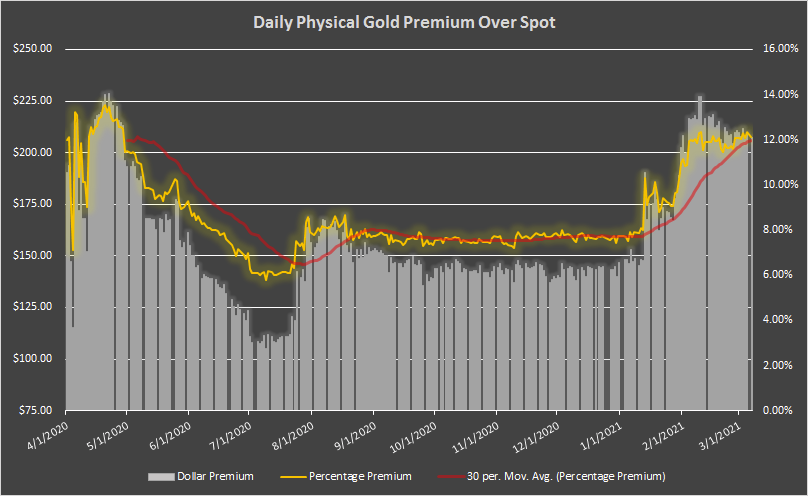
Figure 43 - Source: didthesystemcollapse.org
The above chart shows the eBay premium for 1 oz Gold American Eagle coins over the spot gold price.
In April 2020, the premium spiked at about 14%. It was likely even higher in March (we don’t have the direct data), but the volatility back then was bigger than it is right now, so it seems that the current premium and the April 2020 premium values are a better proxy for the future bottoming premiums than the March 2020 bottom premium would be. If the volatility increases, one could see the premium at about 15% or so.
With gold at about $1,450, the above-mentioned information means Gold American Eagle coins can cost about $1,670.
Still, since gold futures prices seem more predictable than the prices of bullion coins, I’d focus on the former even while timing the purchase of the latter.
Moreover, please note that I’m planning to focus on buying mining stocks close to the bottom and move to metals only later. The reason is that miners tend to outperform in the early days of a major rally (just like they did in the first quarter of 2016). The fact that the premium is likely to be high when gold bottoms in a volatile manner is yet another reason for the above. When switching from mining stocks to physical holdings several weeks or months later, one might be buying at a smaller premium over the spot, and also after having gained more on miners than on the metals. Of course, the above is just my opinion, and you can purchase whatever you want – after all, it’s your capital and your investment decisions.
Q: Please note that I am glad to see gold moving downwards but I am a little confused – the trading report I just received recommends selling at 1690ish but the mailing previously said 1450ish - please see attached.
Could you please investigate and advise.
A: If anything in the Gold & Silver Trading Alerts seems confusing, please refer to the “Summary”, the trading/investment positions, and the “Overview of the Upcoming Part of the Decline” sections for clarification. In this case, we exited the remaining short positions when gold hit $1,693 and almost immediately entered long ones (when gold hit $1,692). We now have long positions in the mining stocks with the plan to exit them in a week or so, and re-enter short positions then, because the next big move is likely to be to the downside (perhaps as low as $1,450 or so). Also, the above is just my opinion, not a recommendation or investment advice.
Q: Hi P.R., thanks for the advice on this trend, it’s been an amazing trade.
As I’m trading on XAUUSD, are you also able to advise the targets for a gold long entry,
or should I wait for the final bottom before opening any longs?
A: I’m very happy that you’re making profits thanks to my analyses. While I think that the very short-term (for the next 5 trading days or so) outlook for gold, silver and mining stocks is bullish, I think the targets are more predictable for mining stocks than they are for gold and – especially – silver. Still, this time, the short-term upside target for gold is also relatively clear – at about $1,770. That’s why I put the $1,758 in the “For-your-information target” for gold in the “Summary” section below.
Q: Are we looking for the short-term upside move to be 1-5 weeks before the final decline into the 1350-1500 zone? I'm a little unsure of the timing you're laying out.
A: I’m looking for the short-term upswing to take place between 1 and 3 weeks – that’s the part of the “Overview of the Upcoming Part of the Decline” section about it:
- It seems to me that the initial bottom has either just formed or is about to form with gold falling to roughly $1,670 - $1,680, likely this week.
- I expect the rebound to take place during the next 1-3 weeks.
- After the rebound (perhaps to $33 - $34 in the GDX), I plan to get back in with the short position in the mining stocks.
In my opinion it’s most likely that this counter-trend rally will take about 1 – 1.5 weeks. Then, I think that the decline to about $1,450 in gold will start.
Q: Thank you for sending out the Alert # 2 with the new changes in the Gold and Silver trades today. This is necessary, so please send out the alert once you enter back to the short positions, please.
A: I’m happy that you enjoyed this intraday Alert. I will indeed send you – my subscribers – an intraday confirmation that the long positions were closed and when we enter new short positions. Still, please note that we already have binding profit-take exit prices in place, which means that when prices move to the target levels (e.g., GDX to $33.92), the long positions should be automatically closed, and profits should be taken off the table – even without an additional confirmation from me (it takes time for me to write and send the message and then some time usually passes before one is able to act on my message).
Q: You have informed us to make the move when the Gold price “REACHES” $1693.00. My question is; Does the word “Reach” mean when the price touches that point, if only for a moment, or does “Reach” mean when it closes the day at or below $1693.00?
Thank you for your response to this question.
A: “Reaching” a price means the same thing as “touching” the price or “moving to” the price. This means moving to this price level on an intraday basis – even for just one tick. If I mean closing prices, I will specifically describe them as such.
For instance, I currently have binding exit positions for the current long position in the mining stocks – and these are exactly the price levels that I have put in my brokerage account as a limit sell order.
Q: Please comment on the Hindenburg Omen for stocks:
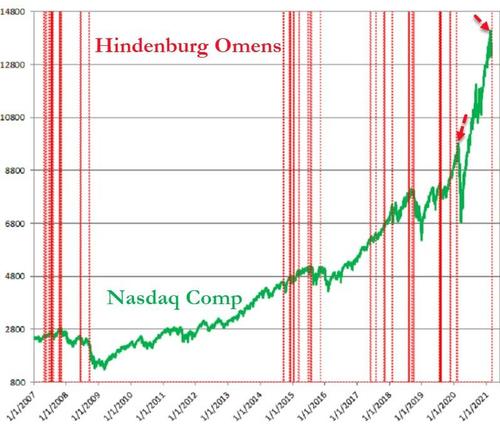
Figure 44 - Source: Refinitiv
A: Thanks. The Hindenburg omen is not one of the most reliable indicators - even on the above chart, it’s clear that most of the signals were not followed by declines. Please note how many fake initial signals there were before stocks finally declined in 2019 or 2020. There are many other reasons to think that stocks are going to move much lower, though. In the very short-term they could still move higher, but this move could be fake and could turn out to be the right shoulder of the head-and-shoulders top formation.
Q: 1) for shorter-term trades such as the potential 10% pop in the GDX, is NUGT better?
2) the plan after we re-enter a short trade when the GDX gets to $33/$34 might mean a longer haul before we hit rock bottom. You have mentioned time-scales up to 20 weeks (ish). Due to a longer holding period, would the CFD route be a cheaper route when compared to NUGT? I’m asking in general terms because each provider imposes different fees and I don’t expect you to comment on the fees charged by IG, which is the service I use.
I also recognize that NUGT only offers 2 X leverage, whereas CFD’s offer up to five times leverage.
Finally, the manner in which you detail the rich tapestry of the economic forces that impact PMs is revealing and educational. I find this all fascinating.
I have my own views which can be summed up like this: How many inflationary false-dawns and panics has the bond market had? Ever since 2008, when the FED launched QE, there have been numerous bouts and hissy fits of inflationary expectations that have subsequently sunk like a dodgy soufflé. I think this time is no different and it’s entirely possible the 30-year bond could drop to ZERO. I am in the deflationary camp.
How might the 10 year at zero or possibly sub-zero and longer, out on the duration curve to (TLT ETF) dropping to 0.5%, affect the price of gold?
Your thoughts as ever, are much appreciated
A: 1) That depends on whether one seeks leverage or not, and how much thereof. Please note that some short-term trades could sometimes become medium-term trades if the market decides to consolidate or move in the other direction before continuing the predicted trend. In this case, non-leveraged instruments are at an advantage over the leveraged ones, because they don’t suffer from the back-and-forth trading as much as the leveraged ones do.
If one’s desired exposure to the GDX ETF wouldn’t exceed the cash that one dedicated to trading, then in order to have the same exposure one would simply have half of the capital employed in NUGT (which is 2x leveraged). This way, the exposure would be identical, but the NUGT would imply additional risk of losing more capital if the trade takes much longer than planned and/or if the price moves adversely first.
Please note that there is also an additional way to gain leverage (it’s not available for everyone, though) and that is through the use of margin on one’s brokerage account. I’d prefer to use margin for the GDX before aiming to gain leverage through NUGT.
In other words, I’d first use more cash for GDX before I’d go into NUGT. If I wanted to have even bigger exposure than the one achieved by employing more capital to GDX, I would then consider using margin, and then I would consider using NUGT if I still wanted to get more leverage.
There might be some traders who would seek to combine both for even bigger leverage (buying NUGT on margin), but this is definitely not something that I’d recommend to most people. In fact, it seems that in many cases, sticking to the GDX would be a good way to go.
2) I think I already replied to the first part of your question (NUGT vs. CFD) above. Also, for other people reading this reply – please note that CFDs (contracts for difference) are not available in many areas, including the USA and Canada.
I’m glad to read that you enjoy reading my explanations of the current situation in the markets (precisely, my opinions on it).
Real interest rates are one of the most important drivers for gold (along with the USD Index), so a drop in the 10-year rates to zero or sub-zero levels would likely be very beneficial for the gold prices.
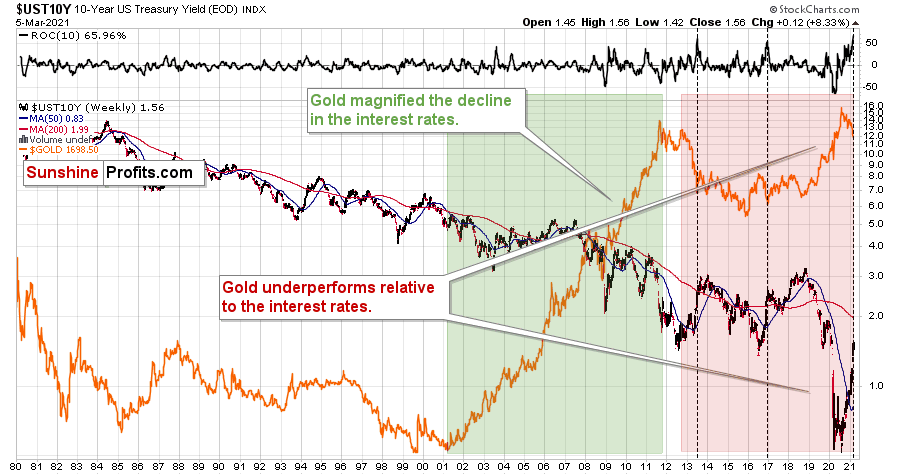
Figure 45
Also, based on the pace at which the rates have rallied recently, they might be topping here, but… There was no decline in the previous 40 years that was as big as what we saw between 2018 and 2020. Consequently, the corrective upswing might be bigger as well. Also, the above chart is not necessarily the scale that is big enough to make very long-term conclusions.
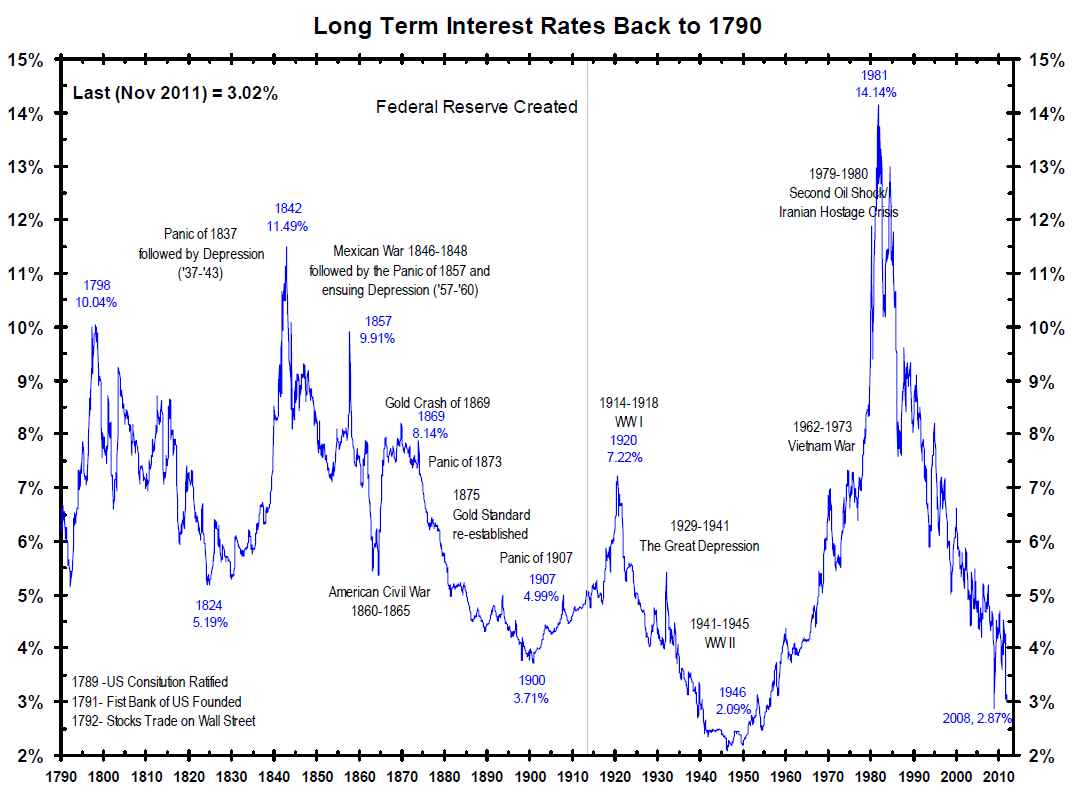
Figure 46
Over the past centuries, whenever the rates fell very low, they then rallied back up with vengeance. After WW2, it theoretically would have been a “good idea” to keep stimulating the economy with low rates – and yet, they soared. Right now, the monetary authorities strive to be very dovish and keep pumping liquidity into the system, and yet the rates are rallying anyway.
So, while the analogy to the previous years – or the past few decades – suggests that the rally in the rates might be over or close to being over, the very long-term chart suggests otherwise.
To make the situation even more complicated, if the stock market has already topped in February, and we have already entered the Kondratiev winter cycle, it means that we can theoretically expect the rates to fall, then rise in a credit crunch, and then fall much lower.
All in all, the outlook for the interest rates is anything but simple and clear. Perhaps what we see right now already IS the credit crunch and the 10-year rates are on their way to above 2% - after all, they used to return above their 200-day moving average after the previous medium-term declines. It seems to me that the move above 2% in the 10-year rates could correspond with gold’s decline below $1,500.
Thank you for reading our free analysis today. Please note that the above is just a small fraction of the full analyses that our subscribers enjoy on a regular basis. They include multiple premium details such as the interim targets for gold and mining stocks that could be reached in the next few weeks.We invite you to subscribe now and read today’s issue right away.
Sincerely,
Przemyslaw Radomski, CFA
Founder, Editor-in-chief -
Gold & Silver Trading Alert – Heads-up
March 8, 2021, 11:31 AMAvailable to premium subscribers only.
-
3… 2… 1… Let the Corrective Rally Begin
March 5, 2021, 10:05 AMFolks, it seems that gold has formed an interim bottom, and a short-term corrective upswing is now likely, before the medium-term downtrend resumes.
Any further declines from this point are not likely to be significant for the short-term. The same applies to silver and the miners.
In yesterday’s (Mar. 4) intraday Gold & Silver Trading Alert, I described briefly why I think that the very short-term bottom is already in (or is at hand), and in today’s analysis, I’ll illustrate my points with charts. Let’s start with gold.
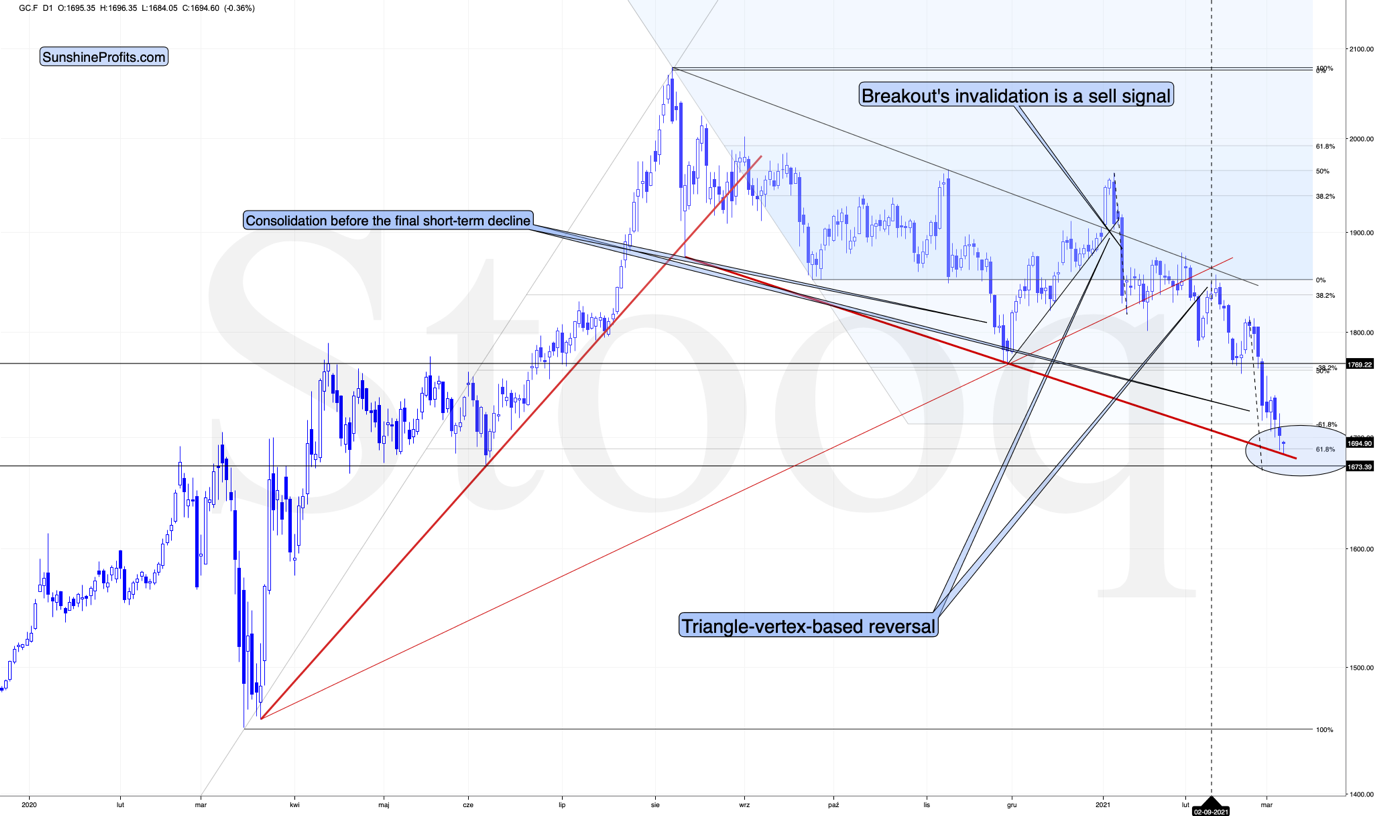
Figure 1 – COMEX Gold Futures (GC.F)
Gold just reached its 61.8% Fibonacci retracement level (based on the entire 2020 rally), and it just bounced off the declining red support line based on the August and November 2020 bottoms.
Gold didn’t reach the previous 2020 lows just yet, but it moved very close to them and the two strong above-mentioned support levels could be enough to trigger a corrective upswing. After all, no market can move up or down in a straight line without periodic corrections.
I previously wrote that when gold moves $1,693 we’ll be closing any remaining short positions, and when gold moves to $1,692, we’ll automatically open long positions in the miners. Since gold moved below $1,690, that’s exactly what happened.
Yesterday (Mar. 4), gold futures were trading below $1,692 for about 10 minutes, so if you acted as I had outlined it in the Gold & Silver Trading Alerts, you made your purchases then. The GDX ETF was trading approximately between $30.80 and $31 (NUGT was approximately between $49.30 and $50) at that time – this seems to have been the exact daily bottom.
One of the bullish confirmations came from the silver market.
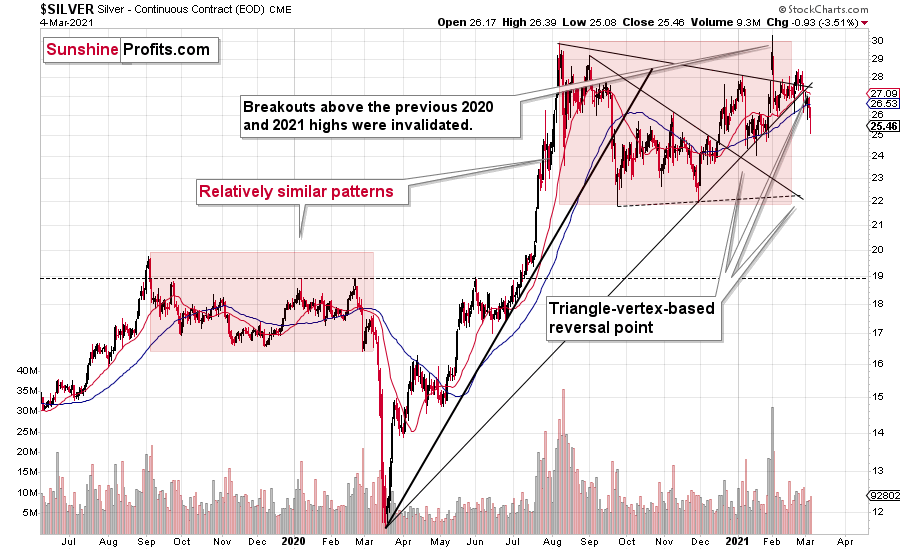
Figure 2 – COMEX Silver Futures
I previously wrote that silver is likely to catch up with the decline at its later stage, while miners are likely to lead the way.
While gold miners showed strength yesterday, silver plunged over 4% before correcting part of the move. Yesterday’s relative action showed that this was most likely the final part of a short-term decline in the precious metals sector, and that we should now expect a corrective rebound, before the medium-term decline resumes. If not, it seems that the short-term bottom is at hand and while silver might still decline somewhat in the very short term, any declines are not likely to be significant in case of the mining stocks. At least not until they correct the recent decline by rallying back up.
Speaking of mining stocks, let’s take a look at the GDX ETF chart.
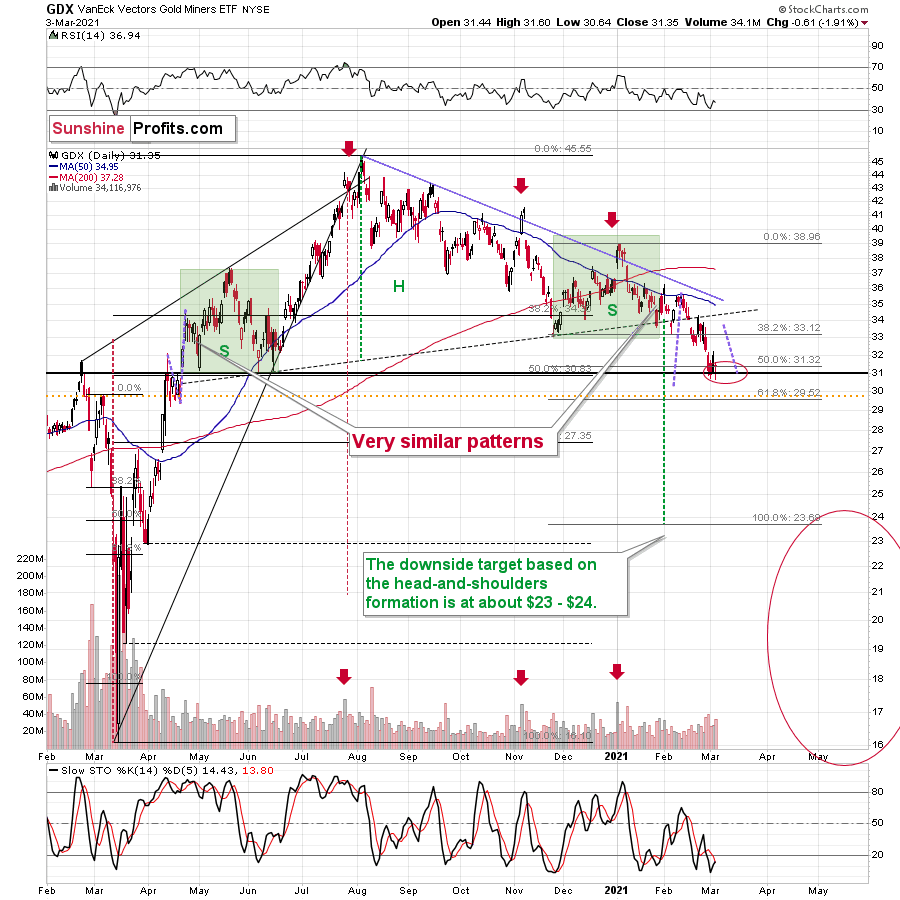
Figure 3 - VanEck Vectors Gold Miners ETF (GDX)
Mining stocks showed strength yesterday. Even though gold moved visibly to new yearly lows, the GDX didn’t move to new intraday lows. The GDXJ did move to new intraday lows, but the decline was relatively small compared to what happened in gold and to what happened on the general stock market. The latter declined substantially yesterday and the GDXJ is more correlated with it than GDX – hence GDXJ’s underperformance was normal. Still, compared to both gold’s decline and stocks’ decline, the GDXJ and GDX declined very little.
The price level at which miners showed strength matters greatly too. Miners stopped their decline practically right in my target area, which I based on the 50% Fibonacci retracement and the 2020 highs and lows. Moreover, the proximity of the $31 level corresponds to the 2019 high and the 2016 high. Since so many support levels coincide at the same price (approximately), the latter is likely to be a very strong support.
Moreover, the RSI was just close to 30, which corresponded to short-term buying opportunities quite a few times in the past.
How high are miners likely to rally from here before turning south once again? The nearest strong resistance is provided by the neck level of the previously broken head and shoulders pattern, which is slightly above $34.
Also, let’s keep in mind the mirror similarity in case of the price action that preceded the H&S pattern and the one that followed it. To be precise, we know that the second half of the pattern was similar to its first half (including the shape of pattern’s shoulders), but it’s not yet very clear if the follow-up action after the pattern is going to be similar to the preceding price action. It seems quite likely, though. If this is indeed the case, then the price moves that I marked using green and purple lines are likely to be at least somewhat similar.
This means that just as the late-April 2020 rally was preceded by a counter-trend decline, the recent decline would likely be followed by a counter-trend rally. Based on the size of the April counter-trend move, it seems that we could indeed see a counter-trend rally to about $34 this time.
There’s also an additional clue that might help you time the next short-term top, and it’s the simple observation that it was relatively safe to exit one’s long positions five trading days after the bottom.
That rule marked the exact bottom in November 2020, but it was also quite useful in early February 2021. In early December 2020, it would take one out of the market only after the very first part of the upswing, but still, let’s keep in mind that it was the “easy” part of the rally. The same with the October 2020 rally. And now, since miners are after a confirmed breakdown below the broad head and shoulders pattern, it’s particularly important not to miss the moment to get back on the short side of the market, as the next move lower is likely to be substantial. Therefore, aiming to catch the “easy” part of the corrective rally seems appropriate.
So, if the bottom was formed yesterday, then we can expect to take profits from the current long position off the table close to the end of next week.
Finally, let’s take a look at the USD Index.
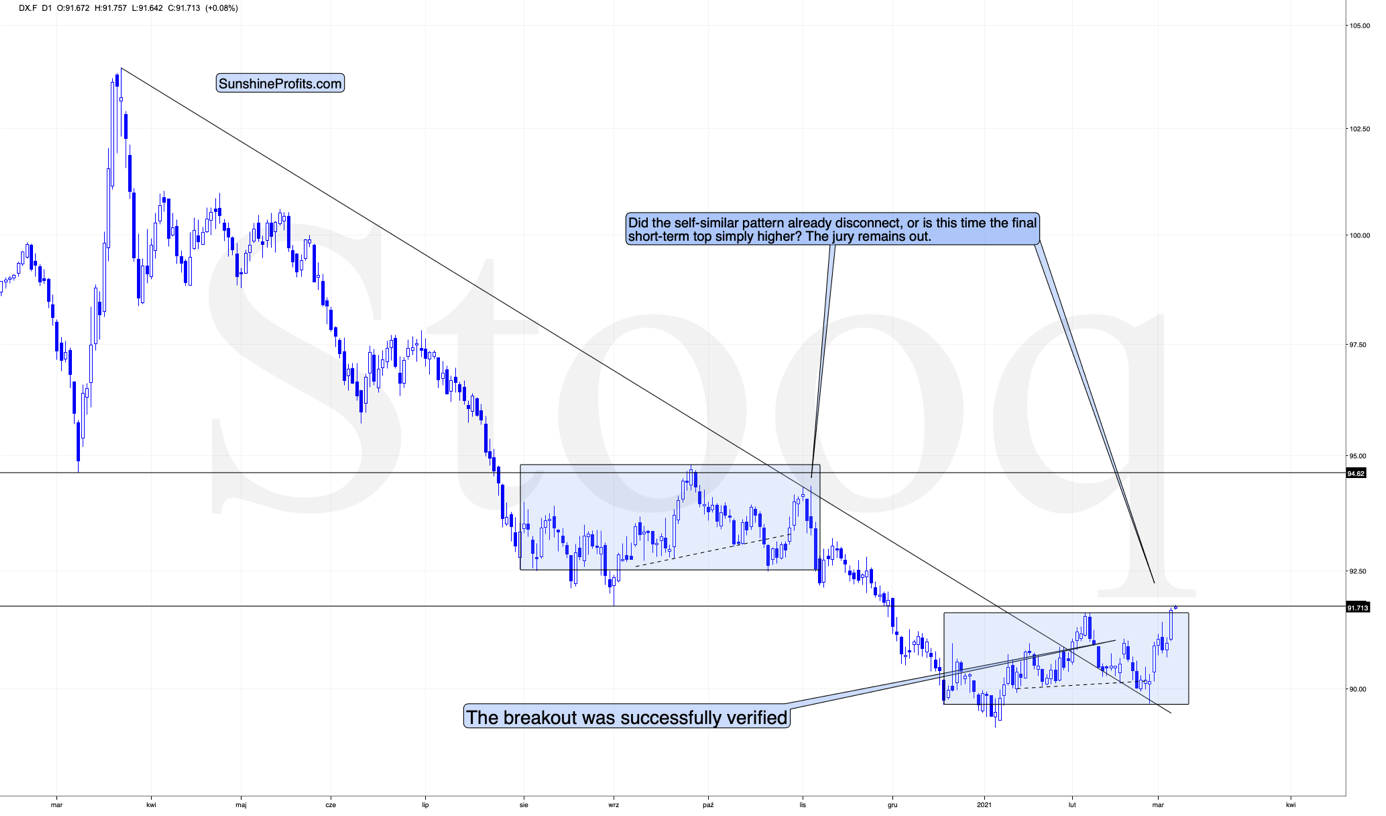
Figure 4 – USD Index
While the medium-term breakout continues to be the most important technical development visible on the above chart (with important bullish implications for the following months), there is one factor that could make the USD Index decline on a temporary basis.
This factor is the similarity to the mid-2020 price pattern. I previously commented on the head and shoulders pattern that had formed (necklines are marked with dashed lines), but that I didn’t trust. Indeed, this formation was invalidated, but a bigger pattern, of which this formation was part, wasn’t invalidated.
The patterns start with a broad bottom and an initial rally. Then it turns out that the initial rally is the head of a head-and-shoulders pattern that is then completed and invalidated. This is followed by a sharp rally, and then a reversal with a sizable daily decline.
So far, the situations are similar.
Last year, this pattern was followed by a decline to new lows. Now, based on the breakout above the rising medium-term support line, such a bearish outcome doesn’t seem likely, but we might see the pattern continue for several more days, before they disconnect. After all, this time, the USD Index is likely to really rally – similarly to how it soared in 2018 – and not move to new lows.
What happens before the patterns disconnect? The USD Index could decline temporarily.
Back in November 2020, the second top was below the initial one, and we just saw the USD Index move to new yearly high. Did the self-similar pattern break yet? In a way yes, but it doesn’t mean that the bearish implications are completely gone.
In mid-2020, the USD Index topped after moving to the previous important intraday low – I marked it with a horizontal line on the above chart.
Right now, the analogous resistance is provided by the September 2020 bottom and at the moment of writing these words, the USD Index moved right to this level.
Consequently, it could be the case that we see a decline partially based on the above-mentioned resistance and partially based on the remaining self-similar pattern. The latter would be likely to lose its meaning over the next several days and would be decisively broken once the USD Index rallies later in March. The above would create a perfect opportunity for the precious metals sector to correct the recent decline – and for miners (GDX ETF) to rally to $34 or so.
Please note that if gold rallies here – and it’s likely to – then this will be the “perfect” time for the gold and stock market permabulls to “claim victory” and state that the decline is over and that they were right about the rally all along. Please be careful when reading such analyses in the following days, especially if they come from people that have always been bullish. If someone is always bullish, the odds are that they won’t tell you when the next top is going to be (after all, this would imply that they stop being bullish for a while). Just because anyone can publish an article online, doesn’t mean that they should, or that others should follow their analyses. The internet is now replete people who claim to have expertise in the markets, and we all saw what happened to the profits of those who bought GameStop at $300. It’s the same thing that happened to the profits of those who were told since the beginning of this year that gold is going to rally – they turned into losses. What we see as well are internet echo chambers, where you are more likely to only read articles that express what you already agree with, instead of being exposed to differing viewpoints that shed light on other critical factors.
Gold is likely to rally from here, but it’s highly unlikely that this was the final bottom, and that gold can now soar to new highs. No. The rally in the USD Index has only begun and while it could pull back, it’s likely to soar once again, similarly to how it rallied in 2018. And gold is likely to respond with another substantial wave lower. This doesn’t mean we’re permabears either or that we want to see gold fail. On the contrary, gold has a bright future ahead, but not before it goes through a medium-term decline after this corrective rally is over.
Thank you for reading our free analysis today. Please note that the above is just a small fraction of the full analyses that our subscribers enjoy on a regular basis. They include multiple premium details such as the interim targets for gold and mining stocks that could be reached in the next few weeks. We invite you to subscribe now and read today’s issue right away.
Sincerely,
Przemyslaw Radomski, CFA
Founder, Editor-in-chief


Gold Investment News
Delivered To Your Inbox
Free Of Charge
Bonus: A week of free access to Gold & Silver StockPickers.
Gold Alerts
More-
Status
New 2024 Lows in Miners, New Highs in The USD Index
January 17, 2024, 12:19 PM -
Status
Soaring USD is SO Unsurprising – And SO Full of Implications
January 16, 2024, 8:40 AM -
Status
Rare Opportunity in Rare Earth Minerals?
January 15, 2024, 2:06 PM

