
tools spotlight

-
How Equities and Yields Worsen Gold’s Dejected State
March 4, 2021, 9:05 AMLet’s face it, gold is in the doldrums and needs to seek a psychiatrist. The strength to surge back is simply not there yet. Gold will eventually prevail, but not until it gets the support it needs. Will Powell’s Operation Twist 3.0 save the day?
With U.S. equities suffering another derailment on Mar. 3, the precious metals were once again caught up in the wreckage. And because the PMs don’t operate in a vacuum, I’ve warned on several occasions that equity-market stress often reverberates across the precious metals’ market.
Please see below:
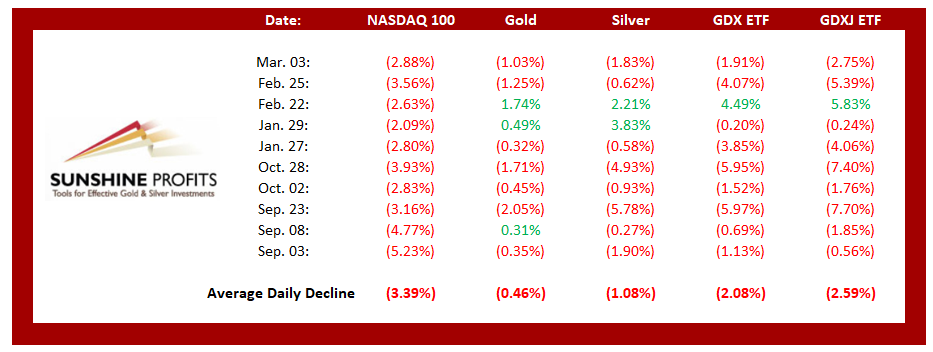
Figure 1
If you analyze the table above, you can see that NASDAQ 100 drawdowns of more than 2.00% tend to unnerve the PMs. Moreover, if you exclude silver’s short squeeze on Jan. 29 and the NASDAQ 100’s relatively ‘quiet’ 2.63% drawdown on Feb. 22, bouts of equity volatility significantly impact the PMs (especially the miners).
But what’s causing the sudden crisis of confidence?
Well, to reiterate what I wrote on Feb. 24, Jerome Powell, Chairman of the U.S. Federal Reserve (FED), has lost control of the bond market.
Waking up to another spike on Mar. 3, the behavior of the U.S. 5-Year, 7-Year and 10-Year Treasury yields continues to rattle investors. Surging by nearly 9% on the day, the U.S. 5-Year Treasury yield has become increasingly unhinged.
Please see below:
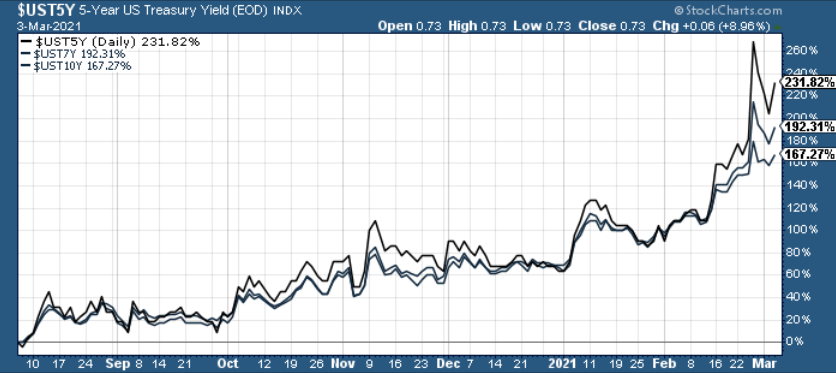
Figure 2
While he’ll never admit it, it’s clear that investors are starting to doubt Powell’s ability to maintain a financial-market nirvana.
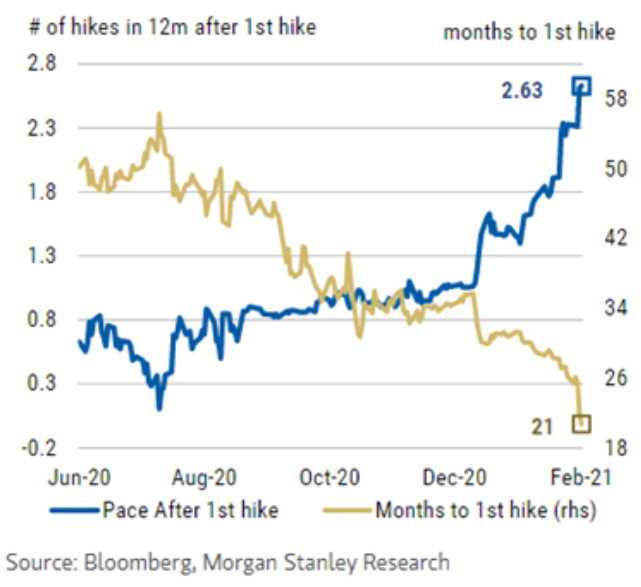
Figure 3
To explain, the gold line above tracks investors’ belief in how long it will be until the FED raises interest rates. Likewise, the blue line tracks investors’ belief in how quickly subsequent rate hikes will follow the initial rate hike. If you follow the gold line, you can see that at the end of December, investors expected roughly 36 months (three years) of bliss before the first rate hike (and only one rate hike occurring thereafter).
Conversely, investors’ now fear that an initial rate hike may occur within 21 months (less than two years), with another 2.63 rate hikes occurring within the following 12 months.
And with confidence suddenly teetering on the edge, according to Bloomberg Economics, fear of a monetary policy shock is driving the bond market’s recent sell-off.
Please see below:
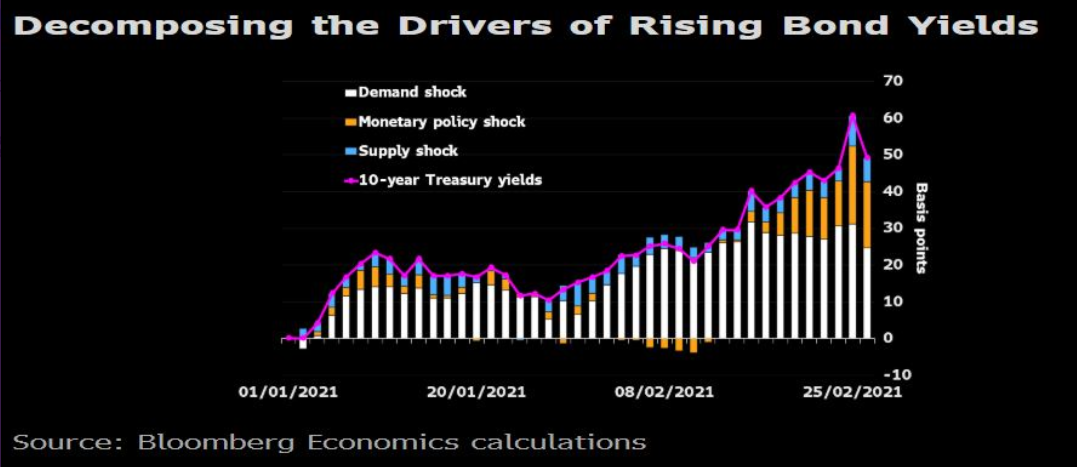
Figure 4
To explain, the purple line above tracks the U.S. 10-Year Treasury yield, while the vertical bars quantify the effect of three different variables – a demand shock, a monetary policy shock and a supply shock. If you analyze the right side of the chart, you can see that the orange bar (a monetary policy shock) continues to exert greater influence over the U.S. 10-Year Treasury yield’s movement. As a result, Powell’s cobra flute isn’t hypnotizing investors like it once did.
Amid the chaos, Cathie Wood’s Ark Innovation ETF – home to speculative technology stocks like Tesla, Square and Roku – ended Wednesday (Mar. 3) in bear market territory.
Please see below:
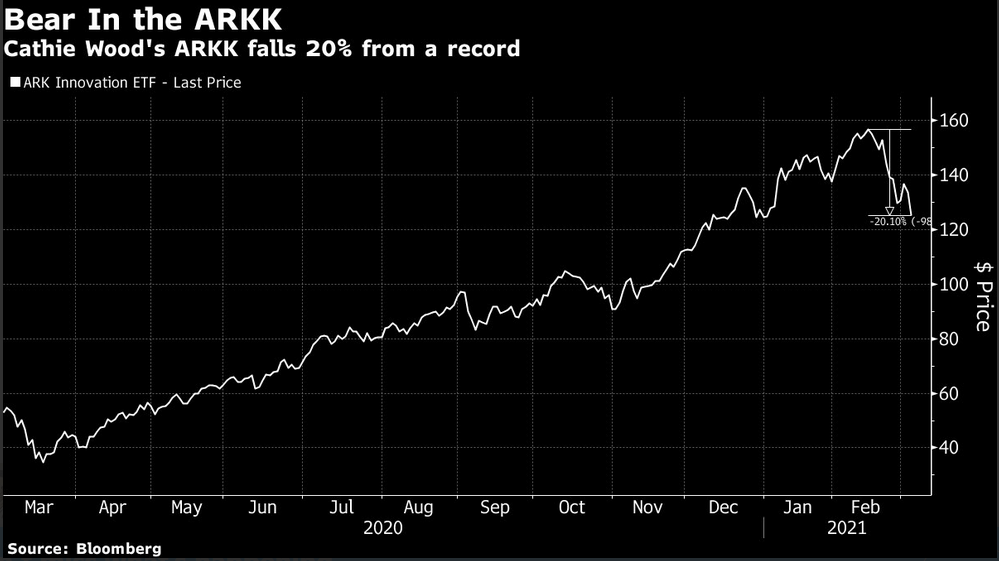
Figure 5
Also suffering from the yield surge, gold has become completely dejected.
On Feb. 17, I warned that gold topped (on Aug. 7), exactly one day after the U.S. 10-Year Treasury yield bottomed (Aug. 6). As a result, the yield curve story remains one of the most compelling narratives contributing to gold’s plight.
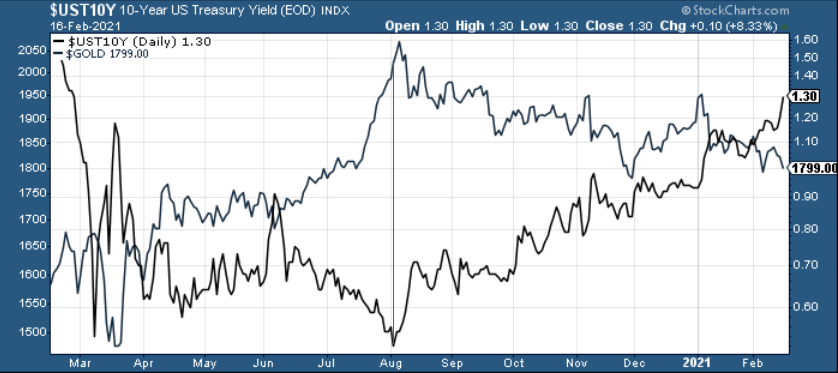
Figure 6
And two weeks later, the script remains the same.
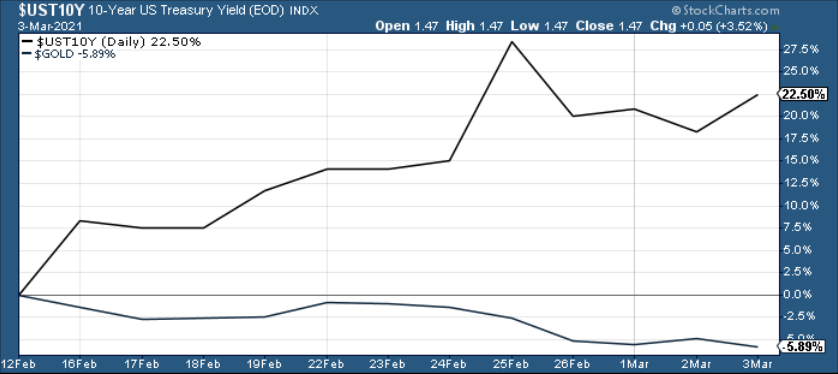
Figure 7
As further evidence, investors are dumping gold-backed ETFs at their fastest pace since 2016.
Please see below:
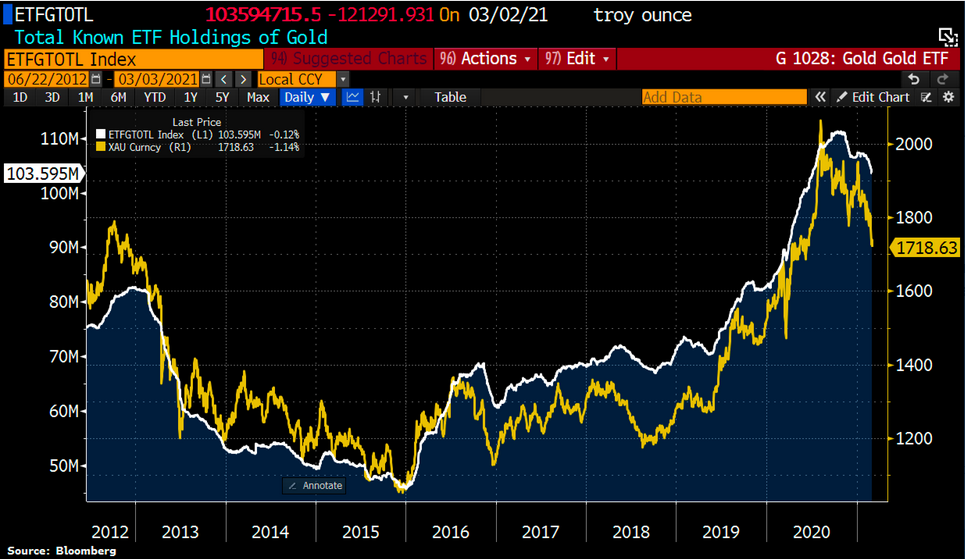
Figure 8
To explain, the yellow line above tracks the performance of spot gold (XAU), while the white line tracks worldwide holdings of gold-backed ETFs. Suffering 12-straight days of outflows, the current swoon marks gold-backed ETFs’ longest losing streak in roughly five years.
But with the behavior of U.S. Treasury yields, U.S. equities and the PMs signaling that a regime change is underway, has the bubble finally burst or is this just another ‘buy the dip’ opportunity?
Well, on one side of the coin, 50% of respondents aged 25-34 told Deutsche Bank that their forthcoming stimulus checks are heading straight into the stock market.
Please see below:
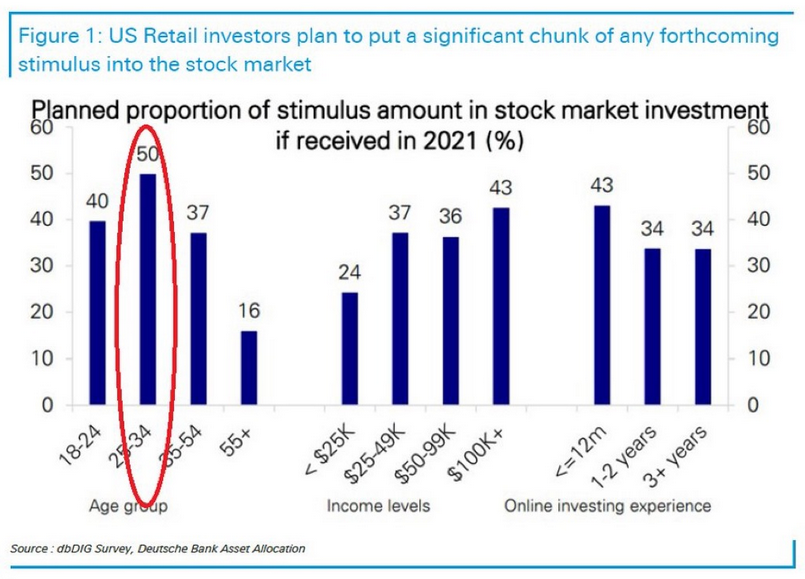
Figure 9
On the other side of the coin, Bank of America’s Equity & Quant Strategy team believe that we’re approaching a precipice. As of Feb. 28, the group’s Sell Side Indicator is flashing a warning signal.
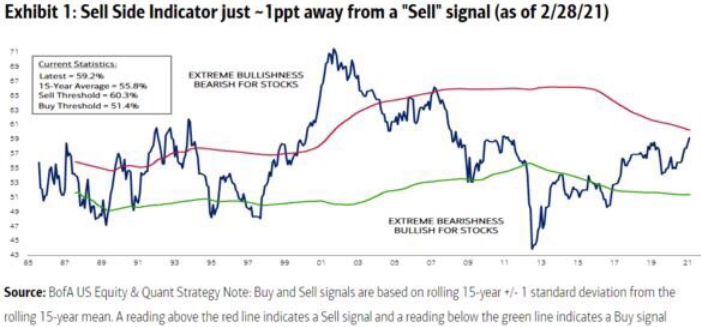
Figure 10
To explain, the blue line above tracks the historical readings from BofA’s Sell Side Indicator. And plotting 1 standard deviation above and below the indicator’s 15-year average, the green and purple lines signal when to buy and sell equities. As it stands, the indicator (59.2%) is only 1.1% away from a screaming sell signal (determined by reaching the 60.3% threshold). More importantly though, the last time the indicator was this close to 60.3% was November 2007 – roughly one month after the S&P 500 began its nearly 58% plunge during the Global Financial Crisis (GFC).
Conversely, while a righteous drawdown would serve as vindication for those that study history and perform diligent fundamental and technical analysis, could Superman – I mean Powell – save the day once again?
Enter Operation Twist 3.0.
With Powell speaking at the Wall Street Journal’s Jobs Summit on Mar. 4, whispers of an old strategy are becoming louder. Dubbed Operation Twist 3.0, the strategy (a version of yield curve control) requires the FED to buy long-term Treasuries and sell short-term Treasuries in order to flatten the yield curve (reduce the spread between short-term and long-term interest rates). And with the first ‘Twist’ occurring in 1961 and the second occurring in 2011 – following the GFC – Fed Governor Lael Brainard hinted on Mar. 2 that 3.0 could be next.
“I am paying close attention to market developments,” she said. “Some of those moves last week and the speed of the moves caught my eye. I would be concerned if I saw disorderly conditions or persistent tightening in financial conditions that could slow progress towards our goals.”
But analogous to putting out a fire by pouring on more gasoline, FED officials remain clueless to the indirect effect of their policies. Despite the implementation likely to suppress bond yields, buoy equities and breathe new life into the PMs, the sugar high will inevitably wear off.
The FED remains stuck between a rock and a hard place:
- If they let yields rise, the cost of borrowing rises, the cost of equity rises, and the U.S. dollar is supported (all leading to shifts in the bond and stock markets and destroying the halcyon environment they worked so hard to create).
- To stop yields from rising, the U.S. Federal Reserve (FED) has to increase its asset purchases (and buy more bonds in the open market). However, the added liquidity should have the same net-effect because it increases inflation expectations (which is a precursor to higher interest rates).
And with Powell’s deny-and-suppress strategy seemingly evolving into acknowledge-and-deflect, Operation Twist 3.0 will only provide a short-term reprieve. Conversely, over the medium-term, it’s the same story: you can only stretch a rubber band so far before it snaps.
In conclusion, the medium-term outlook for the PMs remains profoundly bearish. However, if gold can find a bottom at roughly $1,675, it will likely trigger a short-term corrective upswing. Moreover, if Powell can convince the bond market to settle down, equities should rally, and the PMs could participate in the upward momentum (given their moderate-to-strong correlations with the S&P 500). Conversely, the positivity is likely to be short-lived, as the PMs and U.S. equities are likely to suffer significant drawdowns over the medium-term.
Thank you for reading our free analysis today. Please note that the above is just a small fraction of the full analyses that our subscribers enjoy on a regular basis. They include multiple premium details such as the interim targets for gold and mining stocks that could be reached in the next few weeks. We invite you to subscribe now and read today’s issue right away.
Sincerely,
Przemyslaw Radomski, CFA
Founder, Editor-in-chief -
So, Where Is the Corrective Upswing?
March 3, 2021, 8:20 AMCan the precious metals move lower before a short-term correction, and after correcting, will they continue their medium-term downtrend?
Gold & silver reversed yesterday (Mar. 2) and the GDX rallied after bottoming right in my previous target area, but it’s still unclear if the bottom is in.
Let’s check what’s happening in the charts.
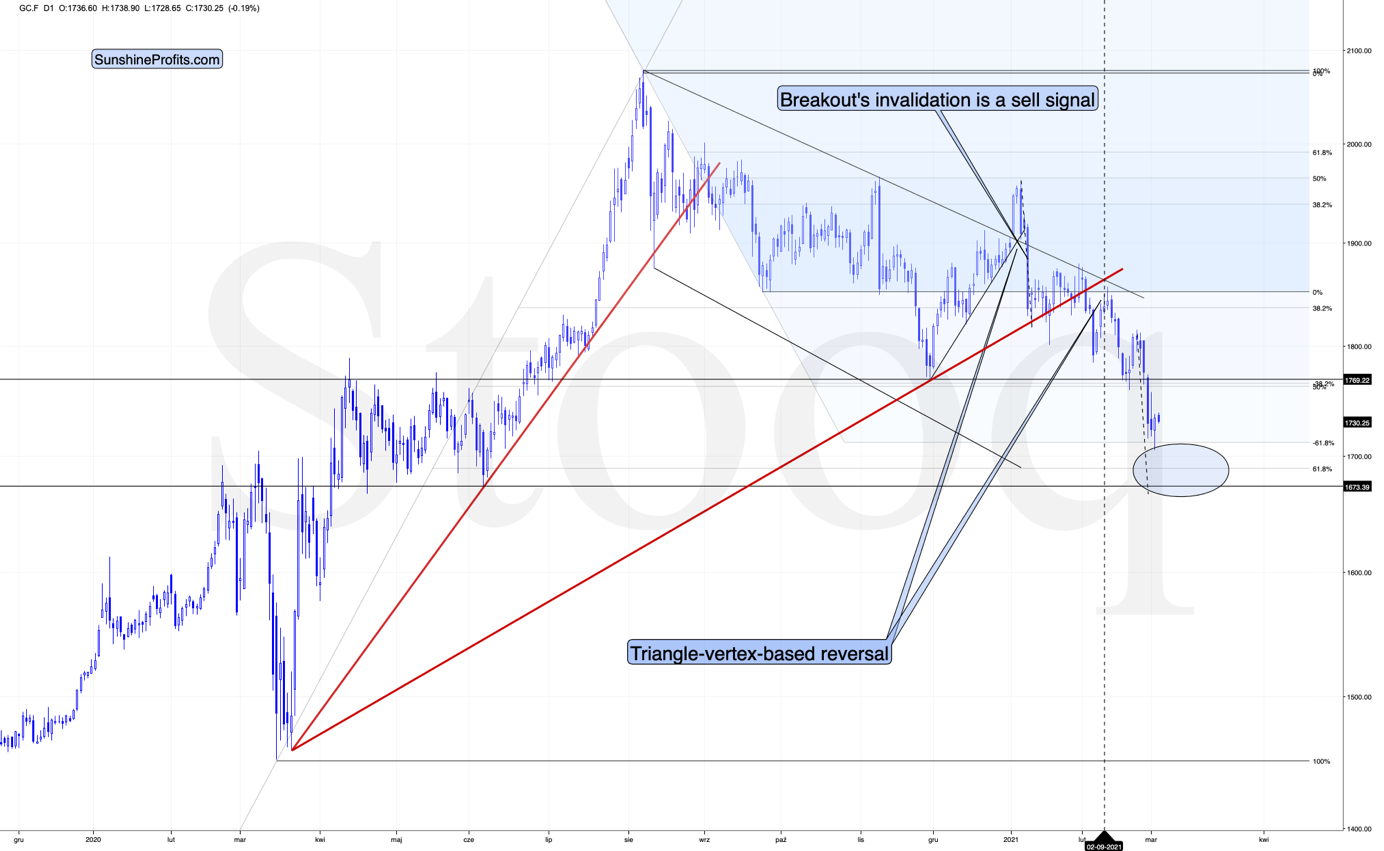
Figure 1 – COMEX Gold Futures (GC.F)
In short, gold reversed yesterday after touching the upper border or my target area. Can the temporary bottom be in? Yes. Is it likely to be in? Not necessarily. Most likely it’s not in yet, because gold still hasn’t moved to its strong support levels.
The size of the first part of the move sometimes tends to be identical or near-identical to the size of the final move. The size of the initial, August decline was almost just like the November decline. Now, copying the January 2021 decline to the current situation (blue, dashed lines), provides us with the target at about $1,675.
The above price area coincides with the previous 2020 lows, and it’s also slightly below the 61.8% Fibonacci retracement based on the entire 2020 upswing. Gold would be likely to at least reach this retracement before forming the temporary bottom.
Consequently, it would not be surprising to see gold suffering another ~$50 decline before finding a short-term bottom. More importantly though, if the initial move lower coincides with an S&P 500 correction, it would be likely to push mining stocks and silver lower in a more visible way.
On the bullish front, the shape of yesterday’s candlestick does indeed look like an intraday reversal. And we saw the same kind of intraday reversal in silver.
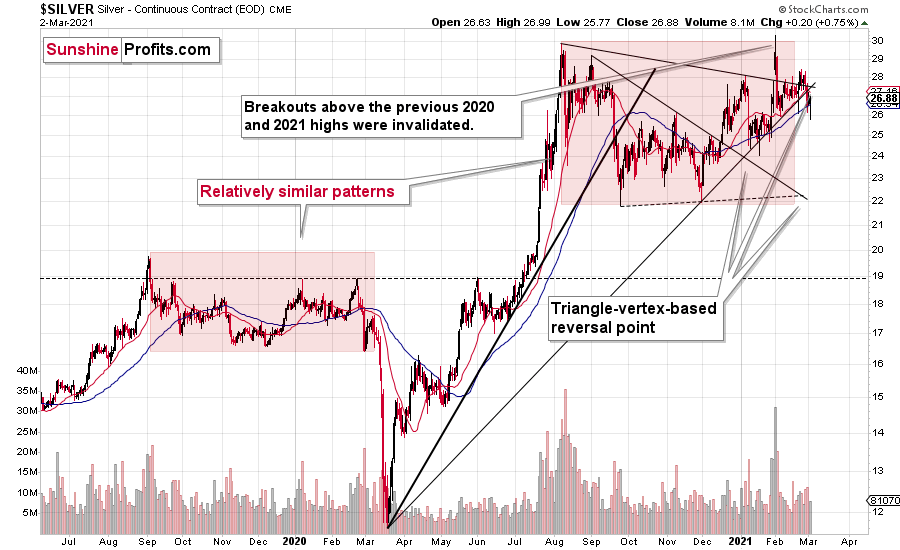
Figure 2 – COMEX Silver Futures
The fact that silver’s triangle-vertex-based reversal is approximately today / was approximately yesterday (it’s unclear) further validates the scenario, in which precious metals move higher in the short term.
I previously wrote that silver is likely to catch up with the decline at its later stage, while miners are likely to lead the way. That’s exactly what we’ve been seeing in the last few months. Silver is still likely to catch up with the declines when silver investors panic – just as they tend to do close to the end of given price moves (selling close to the bottom and buying close to the top). So far, miners remain the asset of choice for trading, but sometime during the next downswing, we might move to silver in order to magnify gains from both declines. As a reminder, please consider what happened on March 13 and March 16, 2020 and consider that the GDX ETF bottomed (in terms of the daily closing prices) on March 13. That was when silver was only in the middle of its decline.
Speaking of mining stocks, let’s take a look at the GDX ETF chart.
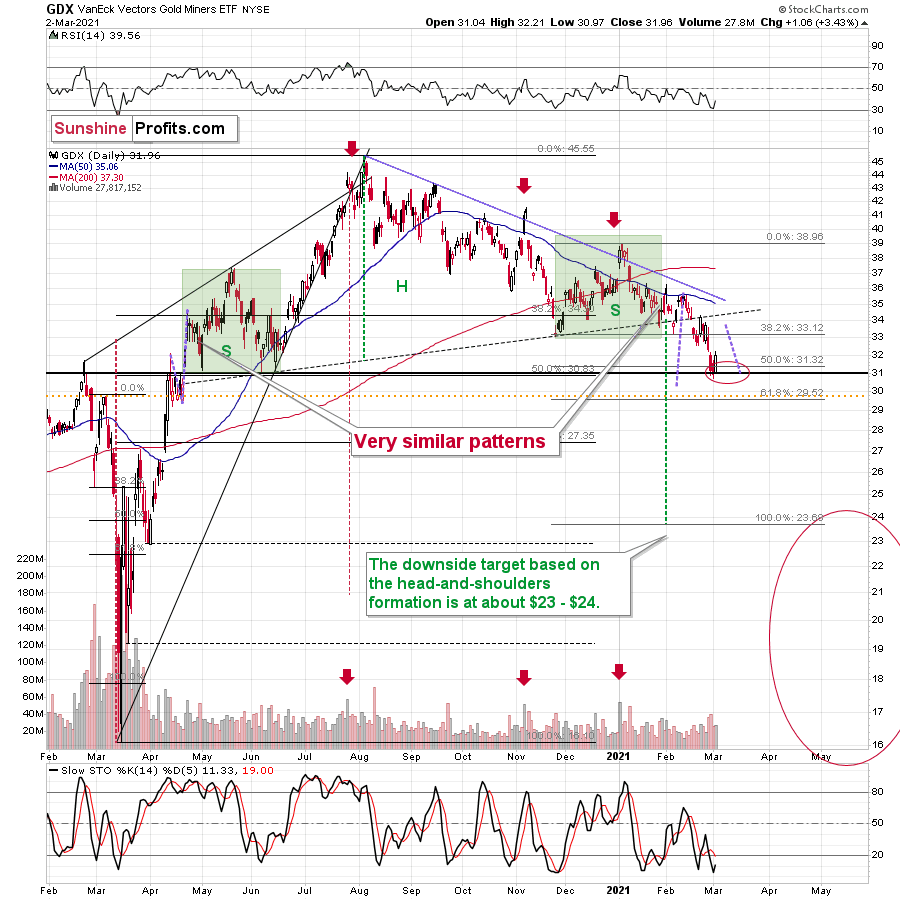
Figure 3 - VanEck Vectors Gold Miners ETF (GDX)
The GDX moved higher shortly after we successfully exited our short positions, relatively close to the bottom. But is this rally about to take miners much higher before they turn south once again? It’s unclear at this time.
It could be the case that we see an immediate move lower once again as gold declines to $1,675 or so, but it could also be the case that miners correct to $33 - $34 now, and then move to new lows later.
All in all, it seems that we are already seeing the corrective upswing, or one is about to start after another very short-term downswing. Once this corrective upswing is over, the downtrend is likely to resume.
Why would this be the case? There are myriads of reasons and I’m going over most of them each week in my flagship Gold & Silver Trading Alerts, but to name just a few, it’s gold’s invalidation of the breakout above its 2011 high, despite having an extremely positive fundamental picture, gold’s weak performance relative to the USD Index, miners’ relatively weak performance compared to gold, and the medium-term breakout in the USDX.
And speaking of the USD Index, let’s take a look at its chart.
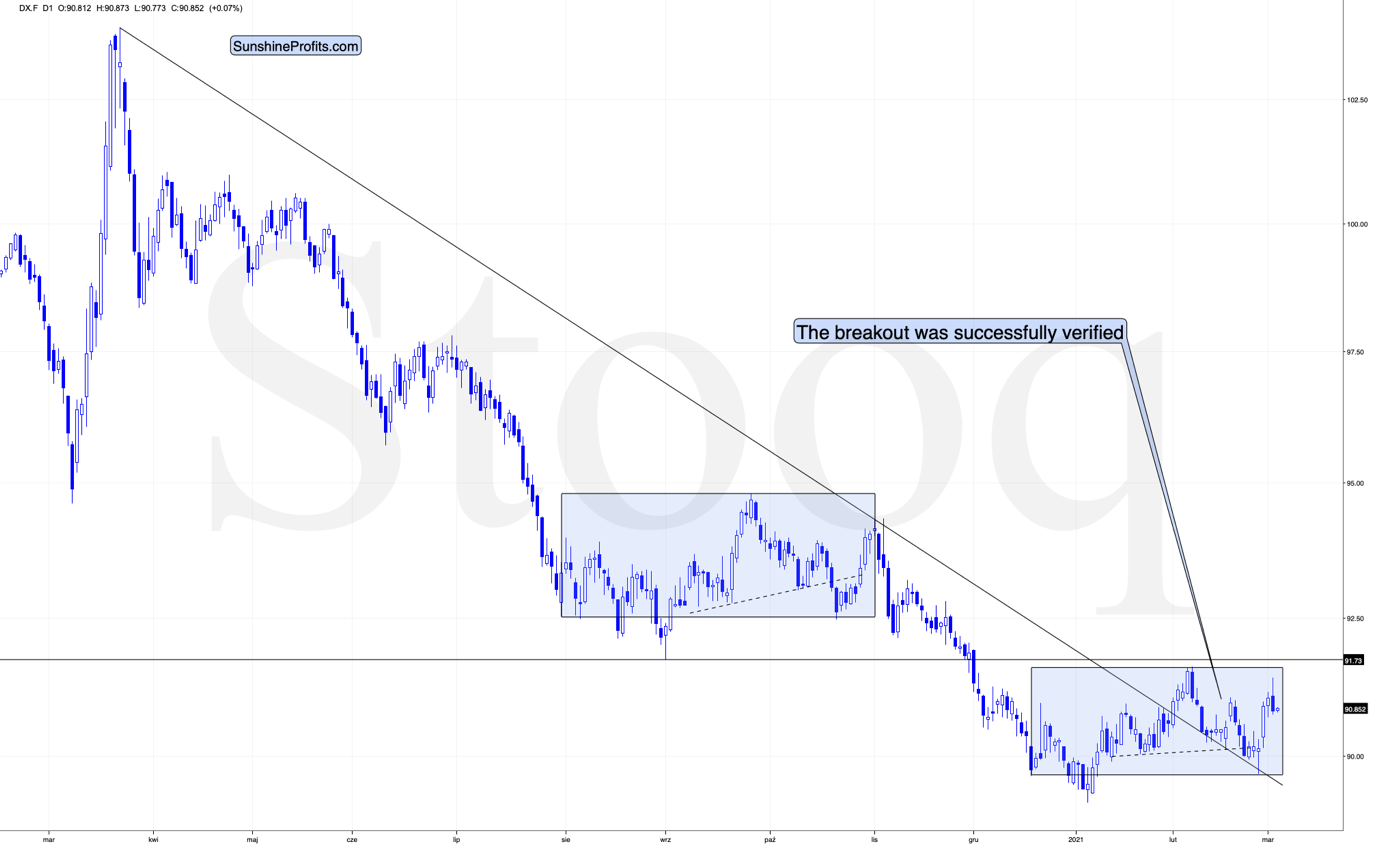
Figure 4
While the medium-term breakout continues to be the most important technical development visible on the above chart (with important bullish implications for the following months), there is one factor that could make the USD Index decline on a temporary basis.
This factor is the similarity to the mid-2020 price pattern. I previously commented on the head and shoulders pattern that had formed (necklines are marked with dashed lines), but that I didn’t trust. Indeed, this formation was invalidated, but a bigger pattern, of which this formation was part, wasn’t invalidated.
The patterns start with a broad bottom and an initial rally. Then it turns out that the initial rally is the head of a head-and-shoulders pattern that is then completed and invalidated. This is followed by a sharp rally, and then a reversal with a sizable daily decline.
So far, the situations are similar.
Last year, this pattern was followed by a decline to new lows. Now, based on the breakout above the rising medium-term support line, such a bearish outcome doesn’t seem likely, but we might see the pattern continue for several more days, before they disconnect. After all, this time, the USD Index is likely to really rally – similarly to how it soared in 2018 – and not move to new lows.
What happens before the patterns disconnect? The USD Index could decline temporarily.
This means that the temporary bottom in the precious metals and miners could have already formed, but it’s far from being crystal-clear.
All in all, markets tend to reverse only after reaching important support or resistance levels, which means that PMs and miners might still move lower before their short-term corrective upswing, but it could also be the case that the latter is already underway. Depending on how many confirmations we get of the bullish outlook, it might or might not be a good idea to enter temporary long positions here. After all, the medium-term downtrend started in August 2020 and it remains intact – thus, quick long positions are against the trend and thus riskier.
Thank you for reading our free analysis today. Please note that the above is just a small fraction of the full analyses that our subscribers enjoy on a regular basis. They include multiple premium details such as the interim targets for gold and mining stocks that could be reached in the next few weeks. We invite you to subscribe now and read today’s issue right away.
Sincerely,
Przemyslaw Radomski, CFA
Founder, Editor-in-chief -
Gold, Silver: Waiting to Make a Move
March 2, 2021, 10:00 AMAfter every storm, there’s a period of calm. How close are the precious metals to reaching important support and resistance levels before their short-term corrective upswing?
Where will gold bounce from here and is silver waiting for investors to panic, before declining further?
In yesterday’s flagship Gold & Silver Trading Alert, I covered multiple factors and analyzed the precious metals sector from many angles. Today, I’ll zoom in and focus on the more short-term details.
Let’s start with what gold has been doing in the last several hours.
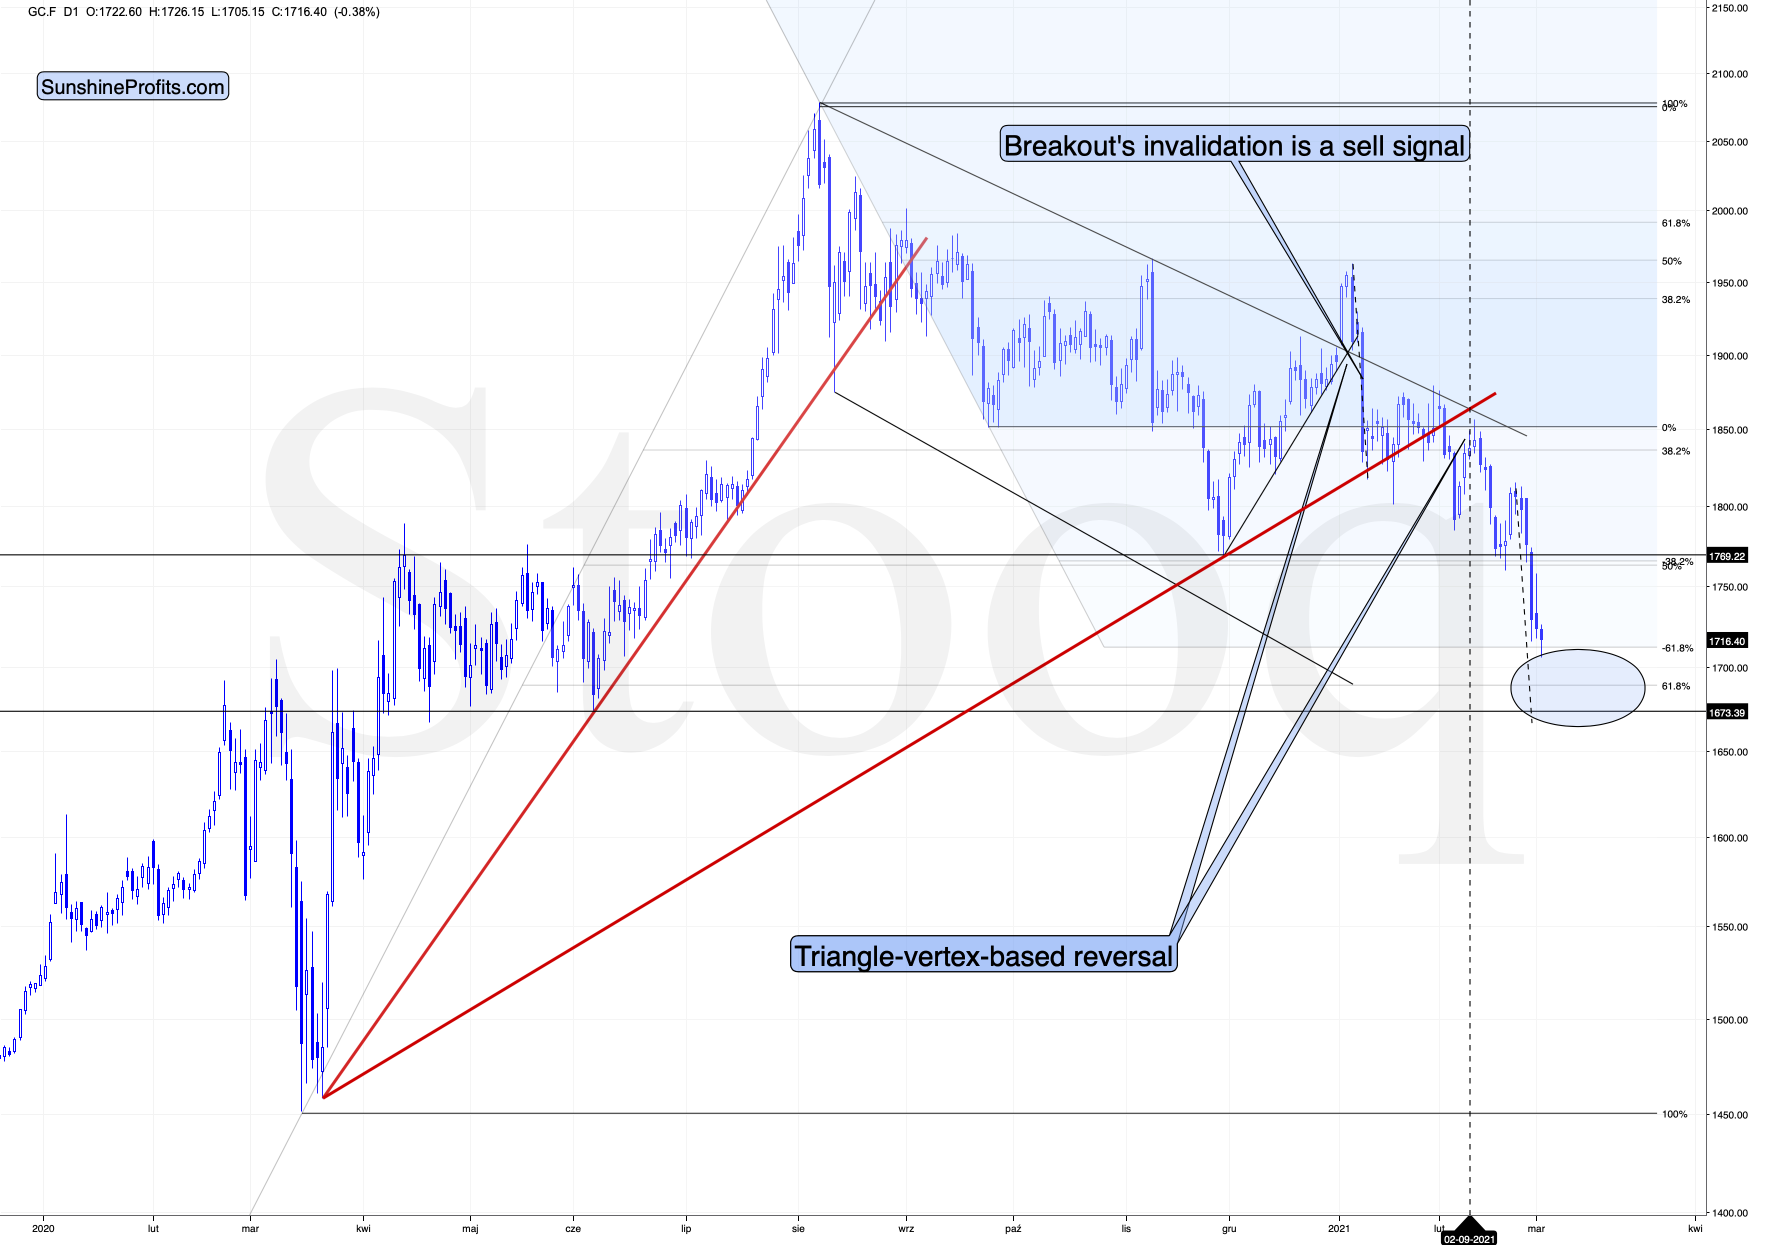
Figure 1 – COMEX Gold Futures (GC.F)
In short, it’s been declining, but not as fast as it did on Friday (Feb. 26). And that’s quite normal – the volatility doesn’t have to stay very high at all times. Is the bottom in? Most likely it’s not, because gold still hasn’t moved to its strong support levels.
Furthermore, if you analyze the symmetry of previous declines (the similar shape of their candles), the magnitude of the August, November and January drawdowns imply a base-case retracement back to the $1,670 to $1,680 range.
The size of the first part of the move sometimes tends to be identical or near-identical to the size of the final move. The size of the initial, August decline was almost just like the November decline. Now, copying the January 2021 decline to the current situation (blue, dashed lines), provides us with the target at about $1,675.
All in all, gold is likely to suffer another ~$50 decline before finding a short-term bottom. More importantly though, if the initial move lower coincides with an S&P 500 correction, it would present an attractive opportunity to exit short positions in the GDXJ ETFs, while positioning oneself for a potential short-term upswing.
Before moving to mining stocks, let’s take a look at silver.
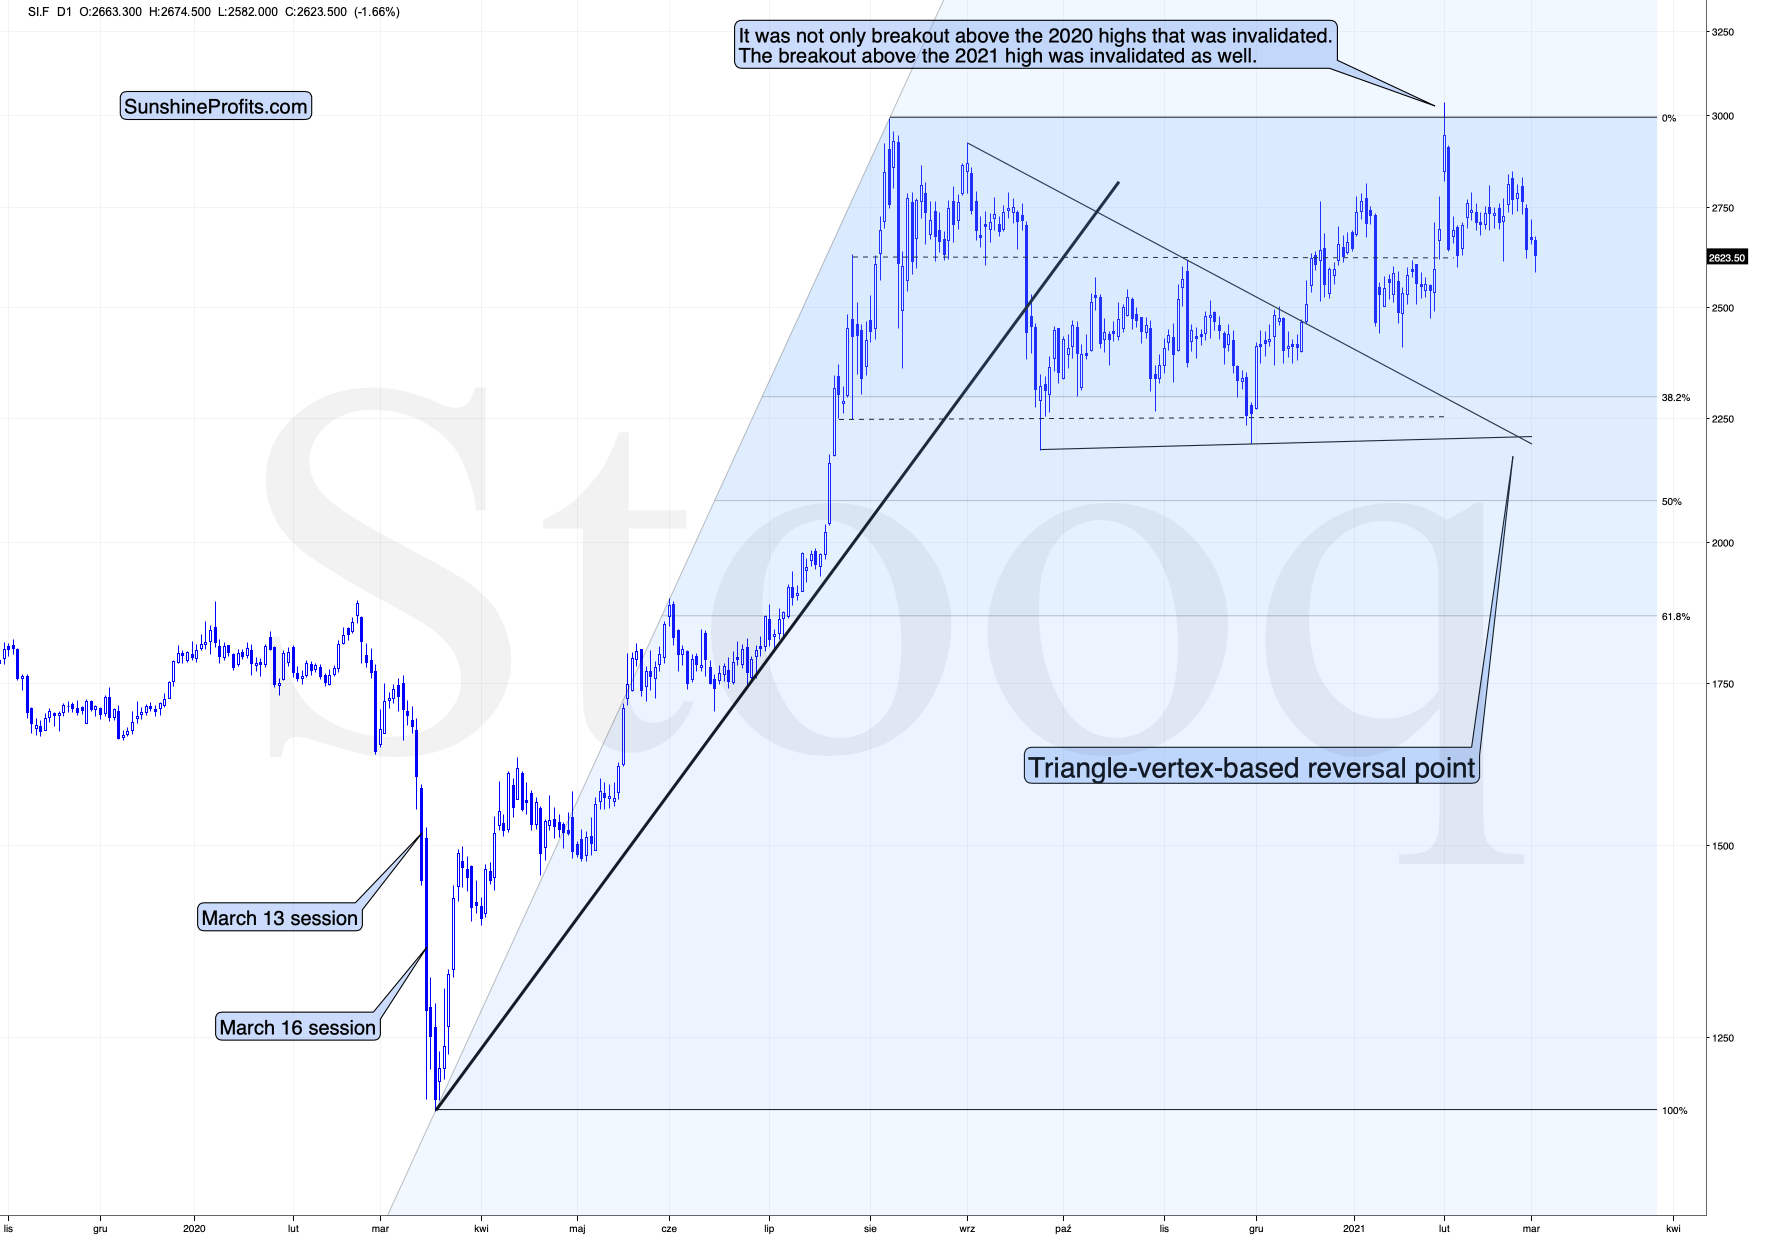
Figure 2 – COMEX Silver Futures (SI.F)
Well, silver has not been moving much recently. The back-and-forth movement resulted in the silver price being more or less where it was trading at its July 2020 high, and relatively close to the middle of the trading range between the August 2020 top and the September 2020 low.
I previously wrote that silver is likely to catch up with the decline at its later stage, while miners are likely to lead the way. That’s exactly what we’ve been seeing in the last few months. Silver is still likely to catch up with the declines when silver investors panic – just as they tend to do close to the end of given price moves (selling close to the bottom and buying close to the top). So far, miners remain the asset of choice for trading, but sometime during the next downswing, we might move to silver in order to magnify gains from both declines. As a reminder, please consider what happened on March 13 and March 16, 2020 and consider that the GDX ETF bottomed (in terms of the daily closing prices) on March 13. That was when silver was only in the middle of its decline.
Speaking of mining stocks, let’s take a look at the GDX ETF chart.
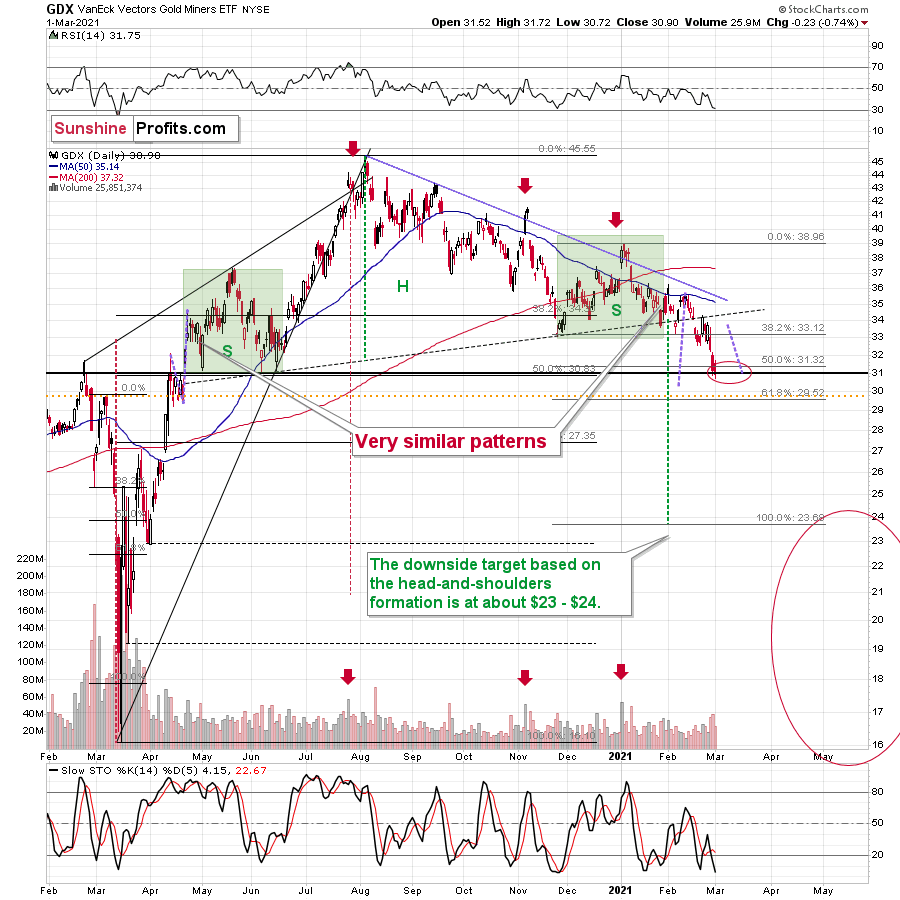
Figure 3 - VanEck Vectors Gold Miners ETF (GDX)
In short, the GDX seems to be forming a bottom in my previous target area. Now, if gold declines one more time before correcting, the GDX could dip temporarily once again – perhaps slightly below $30.
Remember though, if gold does bounce off of the $1,670 to $1,700 range, and the miners are able to ride the momentum higher, ~$33 to ~$34 is where the rally likely ends. From there, the bearish medium-term trend will likely continue, with the miners declining to my secondary target range of $23 to $24.
From a medium-term perspective, the potential head and shoulders pattern – highlighted by the shaded green boxes above – also deserves plenty of attention.
For context, I wrote previously:
Ever since the mid-September breakdown below the 50-day moving average, the GDX ETF was unable to trigger a substantial and lasting move above this MA. The times when the GDX was able to move above it were also the times when the biggest short-term declines started.
(…)
The most recent move higher only made the similarity of this shoulder portion of the bearish head-and-shoulders pattern to the left shoulder (figure 3 - both marked with green) bigger. This means that when the GDX breaks below the neck level of the pattern in a decisive way, the implications are likely to be extremely bearish for the next several weeks or months.
Due to the uncanny similarity between the two green rectangles, I decided to check what happens if this mirror-similarity continues. I used purple, dashed lines for that. There were two important short-term price swings in April 2020 – one shows the size of the correction and one is a near-vertical move higher.
Copying these price moves (purple lines) to the current situation, we get a scenario in which GDX (mining stocks) moves to about $31 and then comes back up to about $34. This would be in perfect tune with what I wrote previously. After breaking below the head-and-shoulders pattern, gold miners would then be likely to verify this breakdown by moving back up to the neck level of the pattern. Then, we would likely see another powerful slide – perhaps to at least $24.
This is especially the case, since silver and mining stocks tend to decline particularly strongly if the stock market is declining as well. And while the exact timing of the market’s slide is not 100% clear, stocks’ day of reckoning is coming. And it might be very, very close.
As I explained previously, based on the similarities to the 1929 and 2008 declines, it could be the case that the precious metals sector declines for about 3 months after the general stock market tops. And it seems that we won’t have to wait long for the latter. Perhaps the next big move lower in stocks is already underway.
Let’s consider the GDXJ ETF, as that’s the ETF where you might have a short position at this time.
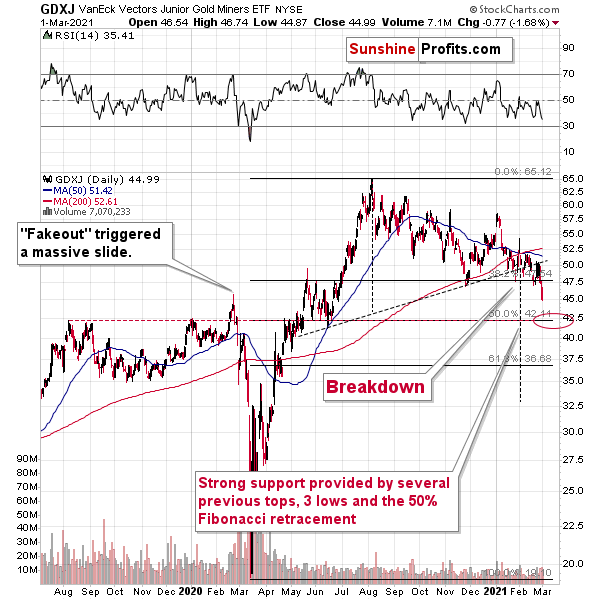
Figure 4 - VanEck Vectors Junior Gold Miners ETF (GDXJ)
There is strong support at about $42.5 in the GDXJ ETF, so I expect to see a corrective upswing once the price gets there. The move could be similar in nature to what we saw at the beginning of last March. The rally took just several days, and it was then erased just as quickly. Looking at the above chart from the 4-hour point of view provides us with two more confirmations of this target on an approximate basis.
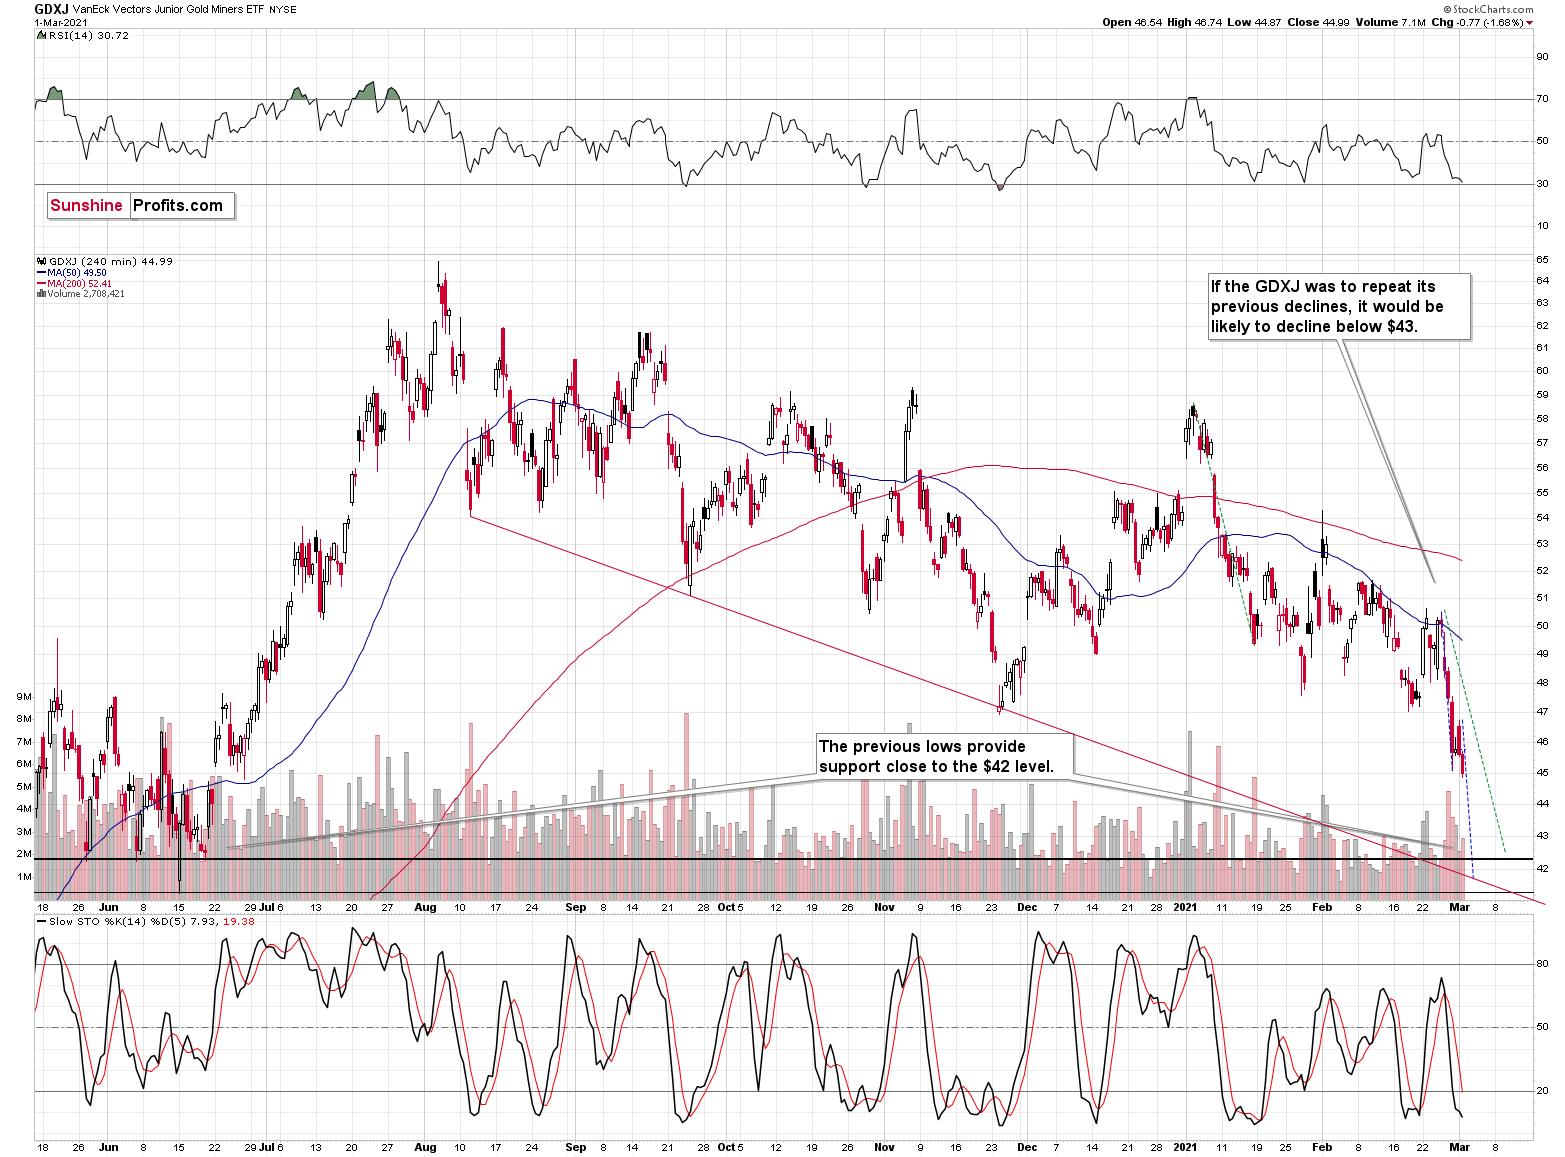
Figure 5
These two factors are analogies to the sizes of previous declines. Copying the initial 2021 decline to the current situation (marked with green) provides us with $42.5 as the next target, and copying the very recent decline and then pasting it over the most recent intraday high (marked with blue), provides us with a target slightly below $42.
The additional support at this area comes from the declining red support line that’s based on the previous intraday lows. Please note that this line has already triggered a sizable short-term reversal in late November, so it’s not something worth ignoring.
Moreover, please note that the RSI indicator (upper part of the above chart) is just above 30, and when this level is reached, it usually corresponds to a short-term buying opportunity. Back in November, the RSI moved visibly below this level before the bottom was formed. So, the RSI is yet another reason to expect a rebound, once prices decline one more time.
The direct trigger for the correction in the precious metals market might come from the same place that triggered it’s slide – the USD Index.
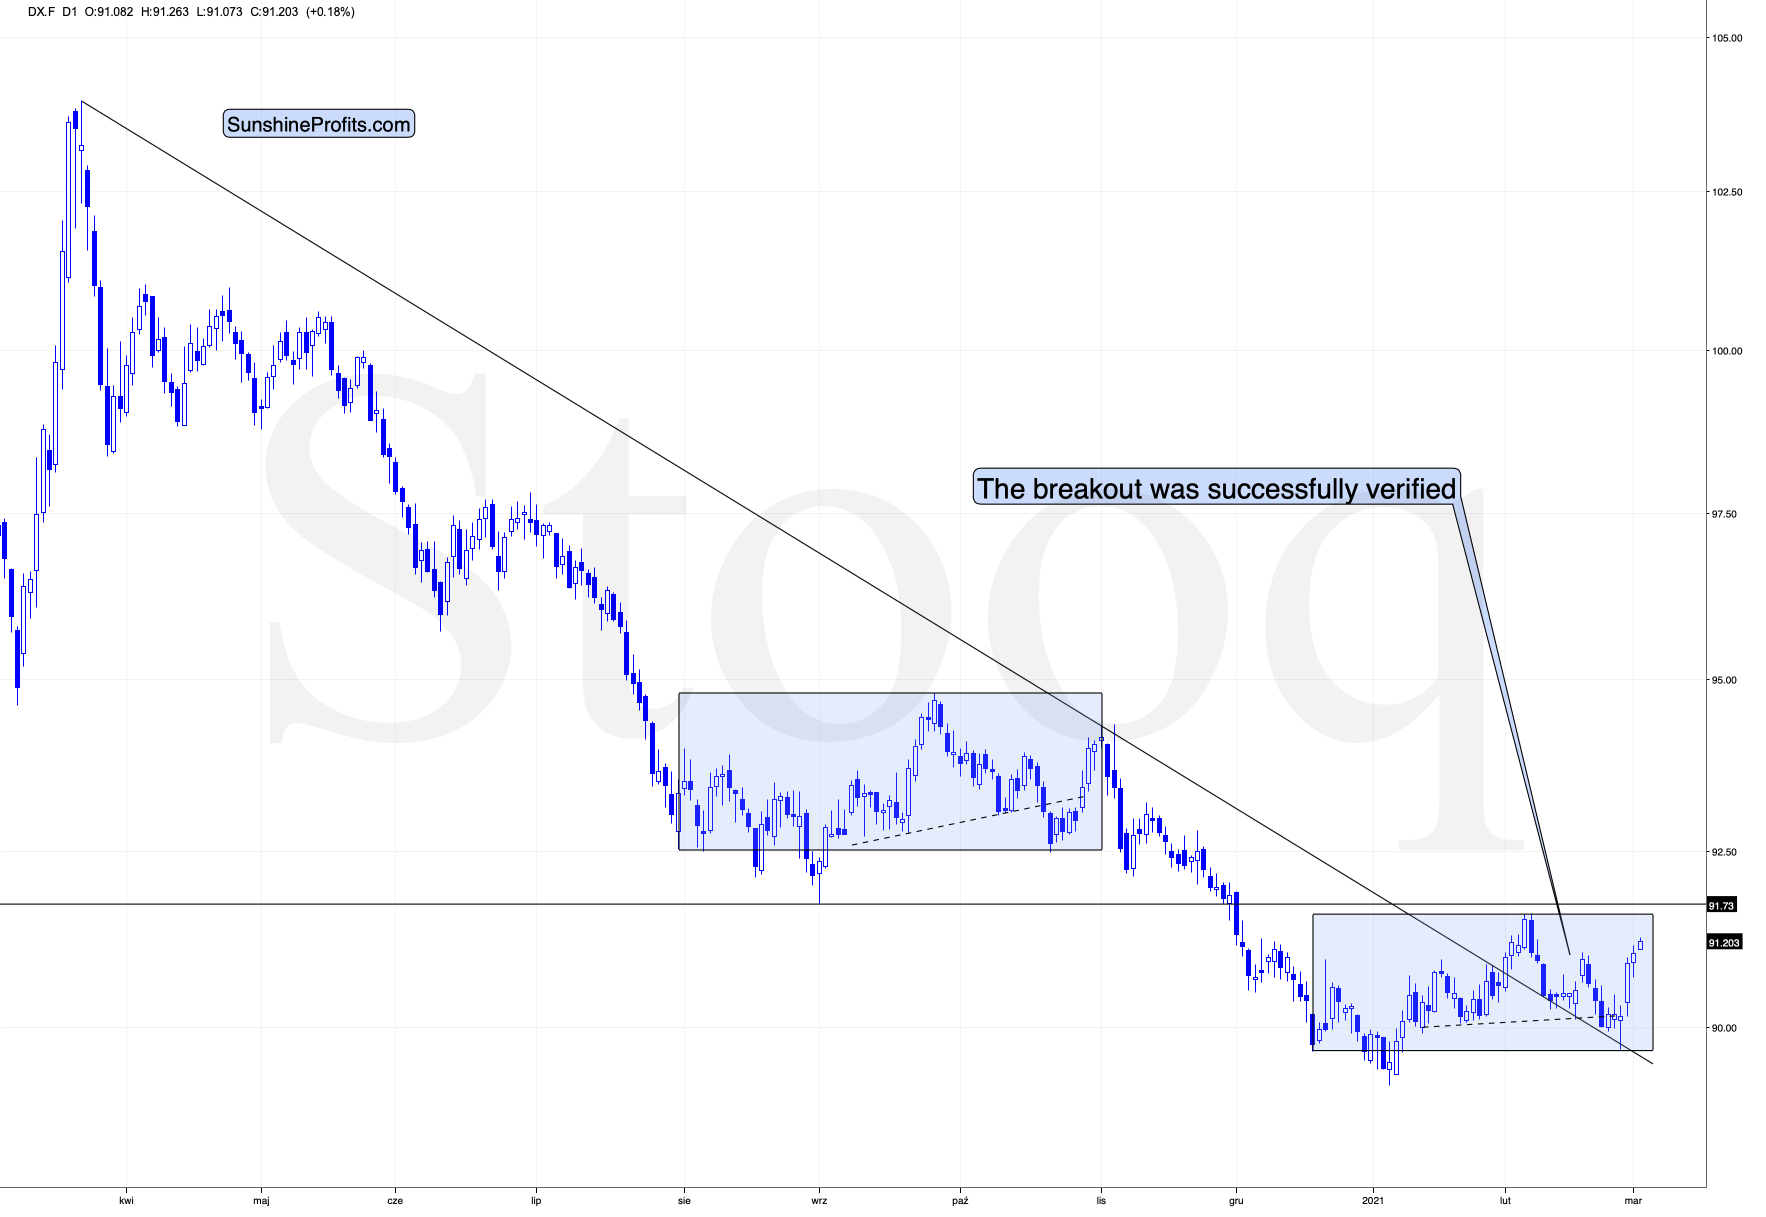
Figure 6
While the medium-term breakout continues to be the most important technical development visible on the above chart (with important bullish implications for the following months), there is one thing that could make the USD Index decline on a temporary basis.
This thing is the similarity to the mid-2020 price pattern. I previously commented on the head and shoulders pattern that had formed (necklines are marked with dashed lines), but that I didn’t trust. Indeed, this formation was invalidated, but a bigger pattern, of which this formation was part, wasn’t invalidated.
The patterns start with a broad bottom and an initial rally. Then it turns out that the initial rally is the head of a head-and-shoulders pattern that is then completed and invalidated. This is followed by a sharp rally. So far, the situations are similar.
Last year, this pattern was followed by a top below the previous high and then by a decline to new lows. Now, based on the breakout above the rising medium-term support line, such a bearish outcome doesn’t seem likely, but we might see the pattern continue for several more days, before they disconnect. After all, this time, the USD Index is likely to really rally – similarly to how it soared in 2018 – and not move to new lows.
What happens before the patterns disconnect? The USD Index could decline temporarily, and the top could be formed any day or hour now.
This means that the bottom in the PMs and miners could be formed any day or hour now – as well.
Still, markets tend to reverse only after reaching important support or resistance levels, which means that PMs are still likely to move lower before their short-term corrective upswing.
Thank you for reading our free analysis today. Please note that the above is just a small fraction of the full analyses that our subscribers enjoy on a regular basis. They include multiple premium details such as the interim targets for gold and mining stocks that could be reached in the next few weeks. We invite you to subscribe now and read today’s issue right away.
Sincerely,
Przemyslaw Radomski, CFA
Founder, Editor-in-chief -
After Gold’s Slide, What Happens to Miners?
March 1, 2021, 10:59 AMAfter gold came down hard last week, what will the yellow metal’s next chapter bring for the miners? How high can they go if gold rallies from here?
As gold recently moved very close to my approximate target of $1,700, the senior miners (GDX) ended Friday’s (Feb. 26) session $0.13 above my initial downside target of $31. And while an eventual flush to the $23 to $24 range (or lower) remains on the table, a corrective upswing could be next in line.
To explain, if gold can bounce off of the $1,670 to $1,700 range, the GDX ETF will likely follow suit. Thus, while the miners are likely to move drastically lower over the medium-term, a decline of nearly 11% over the last two weeks has given way to short-term oversold conditions.
Please see below:
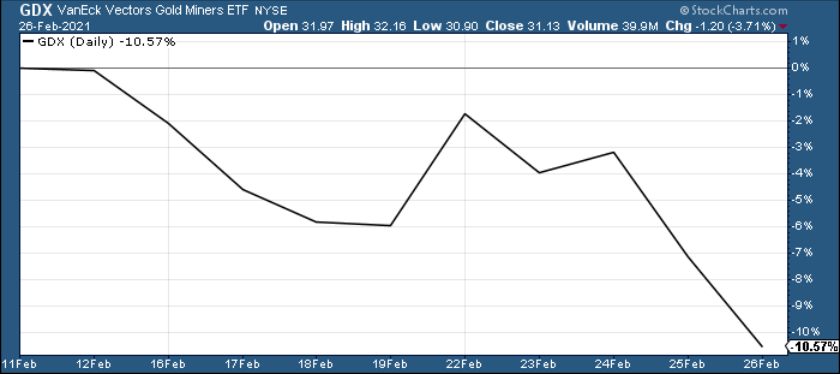
Figure 1
Even more precise, if you analyze the chart below, you can see that the GDX ETF has garnered historical support at roughly $29.52. Moreover, the level also coincides with the early-March high, the mid-April low and the 61.8% Fibonacci retracement level. As a result, a corrective upswing to ~$33/$34 could be the miners’ next move.
Please see below:
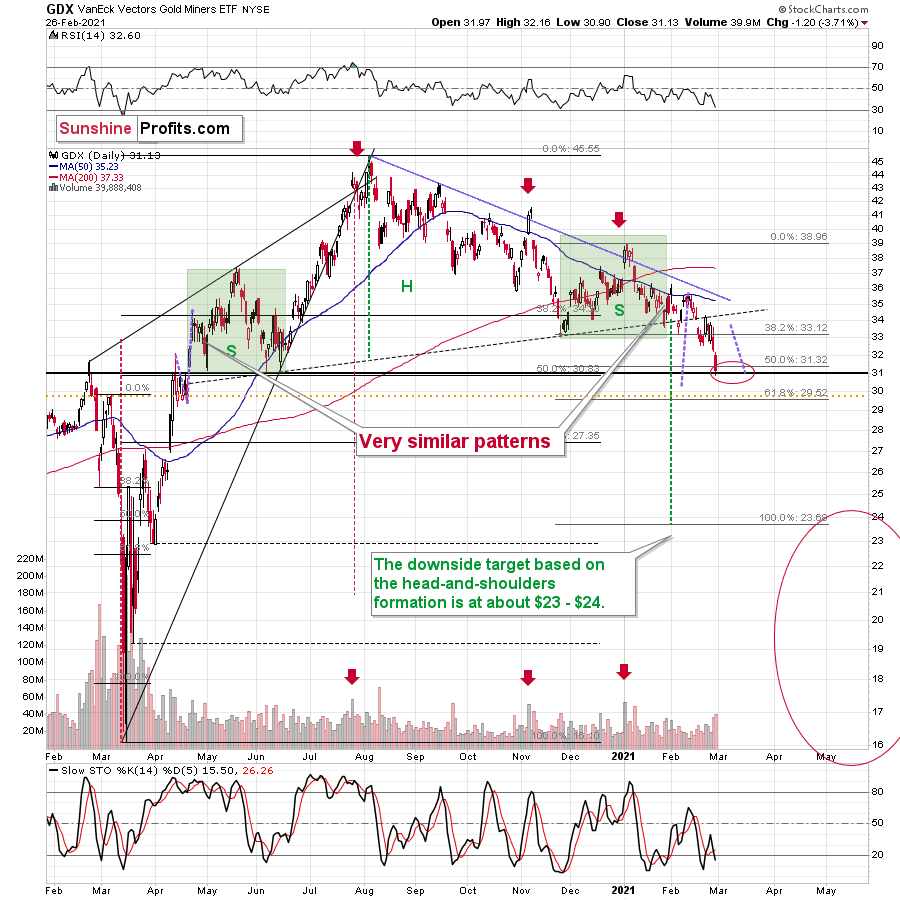
Figure 2 - VanEck Vectors Gold Miners ETF (GDX), GDX and Slow Stochastic Oscillator Chart Comparison – 2020
Remember though, if gold does bounce off of the $1,670 to $1,700 range, and the miners are able to ride the momentum higher, ~$33 to ~$34 is where the rally likely ends. From there, the bearish medium-term trend will likely continue, with the miners declining to my secondary target range of $23 to $24.
From a medium-term perspective, the potential head and shoulders pattern – highlighted by the shaded green boxes above – also deserves plenty of attention.
Ever since the mid-September breakdown below the 50-day moving average, the GDX ETF was unable to trigger a substantial and lasting move above this MA. The times when the GDX was able to move above it were also the times when the biggest short-term declines started.
Looking at the chart above, the most recent move higher only made the similarity of this shoulder portion of the bearish head-and-shoulders pattern to the left shoulder (figure 26 - both marked with green) bigger. This means that when the GDX breaks below the neck level of the pattern in a decisive way, the implications are likely to be extremely bearish for the next several weeks or months.
Due to the uncanny similarity between the two green rectangles, I decided to check what happens if this mirror-similarity continues. I used purple, dashed lines for that. There were two important short-term price swings in April 2020 – one shows the size of the correction and one is a near-vertical move higher.
Copying these price moves (purple lines) to the current situation, we get a scenario in which GDX (mining stocks) moves to about $31 and then comes back up to about $34. This would be in perfect tune with what I wrote previously. After breaking below the head-and-shoulders pattern, gold miners would then be likely to verify this breakdown by moving back up to the neck level of the pattern. Then, we would likely see another powerful slide – perhaps to at least $24.
This is especially the case, since silver and mining stocks tend to decline particularly strongly if the stock market is declining as well. And while the exact timing of the market’s slide is not 100% clear, the day of reckoning for stocks is coming. And it might be very, very close.
As I explained previously, based on the similarities to the 1929 and 2008 declines, it could be the case that the precious metals sector declines for about 3 months after the general stock market tops. And it seems that we won’t have to wait long for the latter. Perhaps the next big move lower in stocks is already underway.
In conclusion, the sun may be about to shine on the precious metals, even if the upcoming rally is not yet destined to last. If the yellow metal can rally off of the $1,670 to $1,700 range, the miners have a pathway to ~$33/$34. Supporting a short-term bounce, abnormally high short interest in U.S. Treasuries could be a contrarian indicator, with a temporary calming of the priors weeks’ yield surge adding fuel to the PMs’ fire. If so, the favorable backdrop could support a temporary bounce before gold and the miners resume their medium-term downtrends.
Thank you for reading our free analysis today. Please note that the above is just a small fraction of the full analyses that our subscribers enjoy on a regular basis. They include multiple premium details such as the interim targets for gold and mining stocks that could be reached in the next few weeks. We invite you to subscribe now and read today’s issue right away.
Sincerely,
Przemyslaw Radomski, CFA
Founder, Editor-in-chief -
Gold & Silver Trading Alert – Monday’s Early Heads-up
February 27, 2021, 6:12 AMAvailable to premium subscribers only.


Gold Investment News
Delivered To Your Inbox
Free Of Charge
Bonus: A week of free access to Gold & Silver StockPickers.
Gold Alerts
More-
Status
New 2024 Lows in Miners, New Highs in The USD Index
January 17, 2024, 12:19 PM -
Status
Soaring USD is SO Unsurprising – And SO Full of Implications
January 16, 2024, 8:40 AM -
Status
Rare Opportunity in Rare Earth Minerals?
January 15, 2024, 2:06 PM

