

-
Much To Our Delight, Oil Keeps Rising
May 6, 2020, 7:47 AMIn yesterday's Oil Trading Alert, we opened a long position based on crude oil's exceptional strength, and this position is already over $2 profitable. Crude oil is taking a breather today, but it doesn't seem that this pause is the end of the rally. These are the three reasons why:
- Crude oil has just broken above the declining resistance line and it managed to do so despite quite a few bearish factors. It even broke higher with a bullish price gap, underscoring the strength of the bulls
- Crude oil has already consolidated a bit, even though it's not visible on the daily chart.
- The really strong resistance level of about $30 was not yet reached.
The first and third reasons are clearly visible on crude oil's daily chart below:
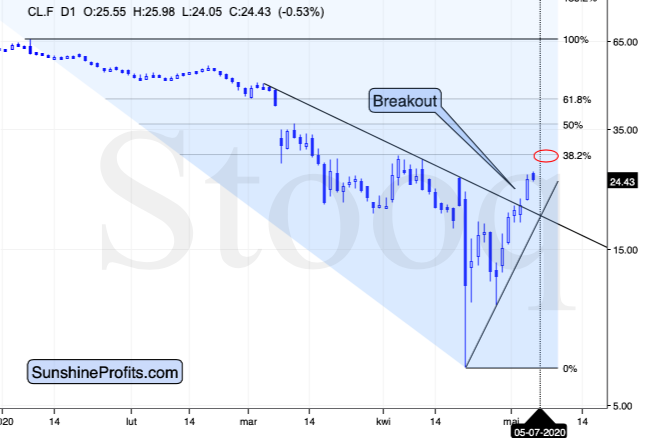
Given the strength with which crude oil broke above the declining resistance line and the fact that crude oil opened with a bullish gap yesterday, the next very short-term move will very likely be to the upside. The next particularly strong resistance level is based on the 38.2% Fibonacci retracement level and the April highs - at about $30.
Based on the triangle-vertex-based reversal, we're likely to see some kind of reversal on Thursday or Friday, and given the current momentum, it seems likely that it will be a top.
As far as the second point is concerned, let's take a look at the 4-hour chart.
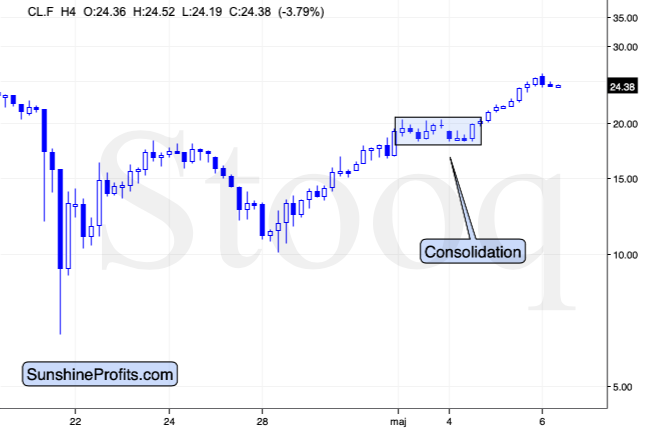
Even though it's not apparent on the daily chart, the above perspective allows us to see that crude oil has already consolidated in early May. This means that the rally is less excessive than it appears at first sight, and that a pause right now is not inevitable.
Besides, the price moves tend to be similar before and after consolidations. In nominal terms, crude oil gained about $10 before the consolidation (moving from about $10 to about $20), so gaining an extra $10 after the consolidation means a move from about $20 to about $30. Of course, in relative terms, a bigger rally would be likely.
Either way, the very short-term outlook for crude oil is bullish, in our view.
Summing up, despite numerous bearish factors, crude oil showed exceptional strength and soared clearly above the declining resistance line on Tuesday, which made the short-term outlook bullish. This is especially the case since black gold opened with a bullish gap, and then continued to rally. It seems that the open profits on our long positions in crude oil will become bigger shortly.
If you enjoyed the above analysis and would like to receive daily premium follow-ups, we encourage you to sign up for our Oil Trading Alerts to also benefit from the trading action we describe - the moment it happens. The full analysis includes more details about our current positions and levels to watch before deciding to open any new ones or where to close existing ones.
Thank you.
Nadia Simmons
Day Trading and Oil Trading StrategistPrzemyslaw Radomski, CFA
Editor-in-chief, Gold & Silver Fund Manager -
Calm Before Another Storm in Oil?
May 4, 2020, 8:39 AMThe most crazy part of this year's crude oil trading might be already behind us and with the volatility declining a bit - and crude oil decisively above $10, it seems that we could leave the USO ETF for a while and return to our regular futures perspective for the black gold analysis.
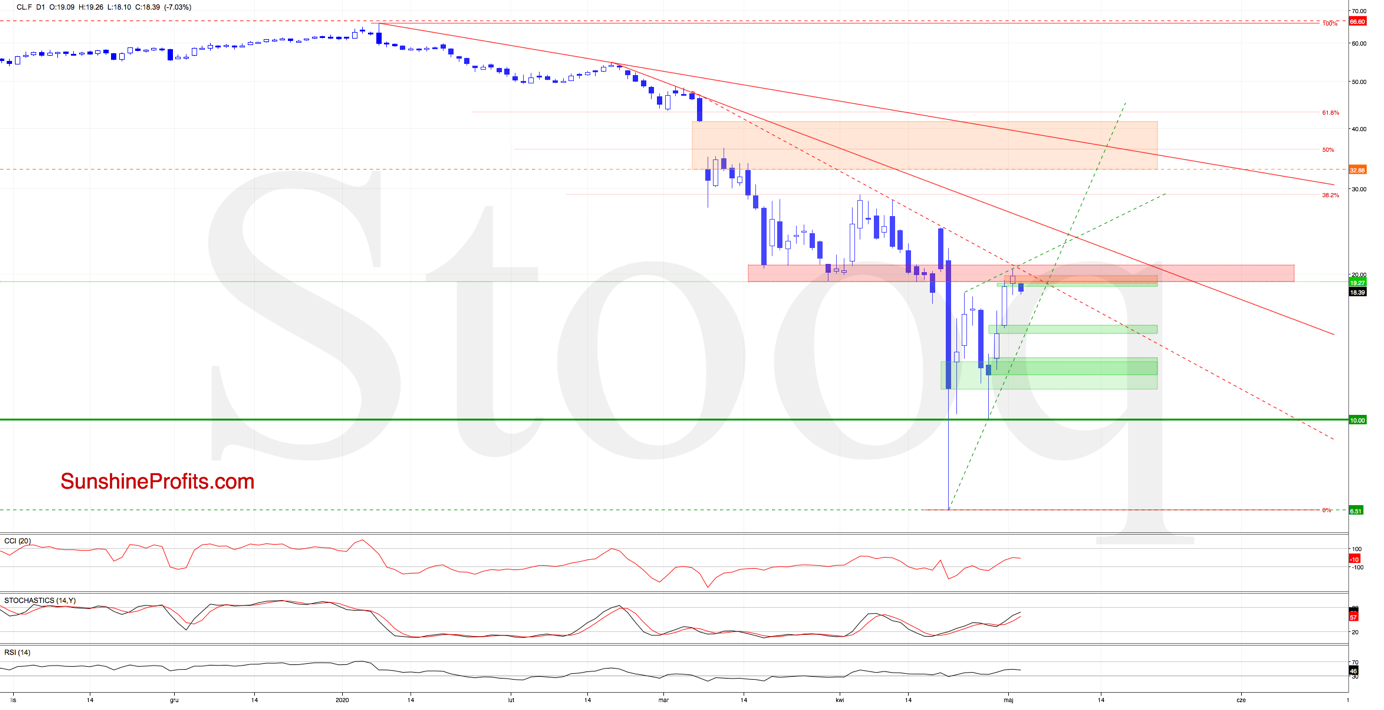
Looking at the daily chart of crude oil futures, we see that the bulls managed to extend earlier gains, which resulted in a climb to the previously broken red zone created by the March lows. Although the futures rose above the late-March low on Friday, they failed to move higher earlier today as the week started with the orange bearish gap.
Additionally, when we take a closer look at the above chart, we can notice that the recent rebound pushed futures to the short-term red dashed resistance line based on the previous peaks, which suggests that as long as it remains in the cards, the bears have an additional ally in the red resistance zone area.
On top of that, when we zoom in our picture and focus on the 4-hour chart, we can see several more bearish factors. Let's check the chart below to find out.
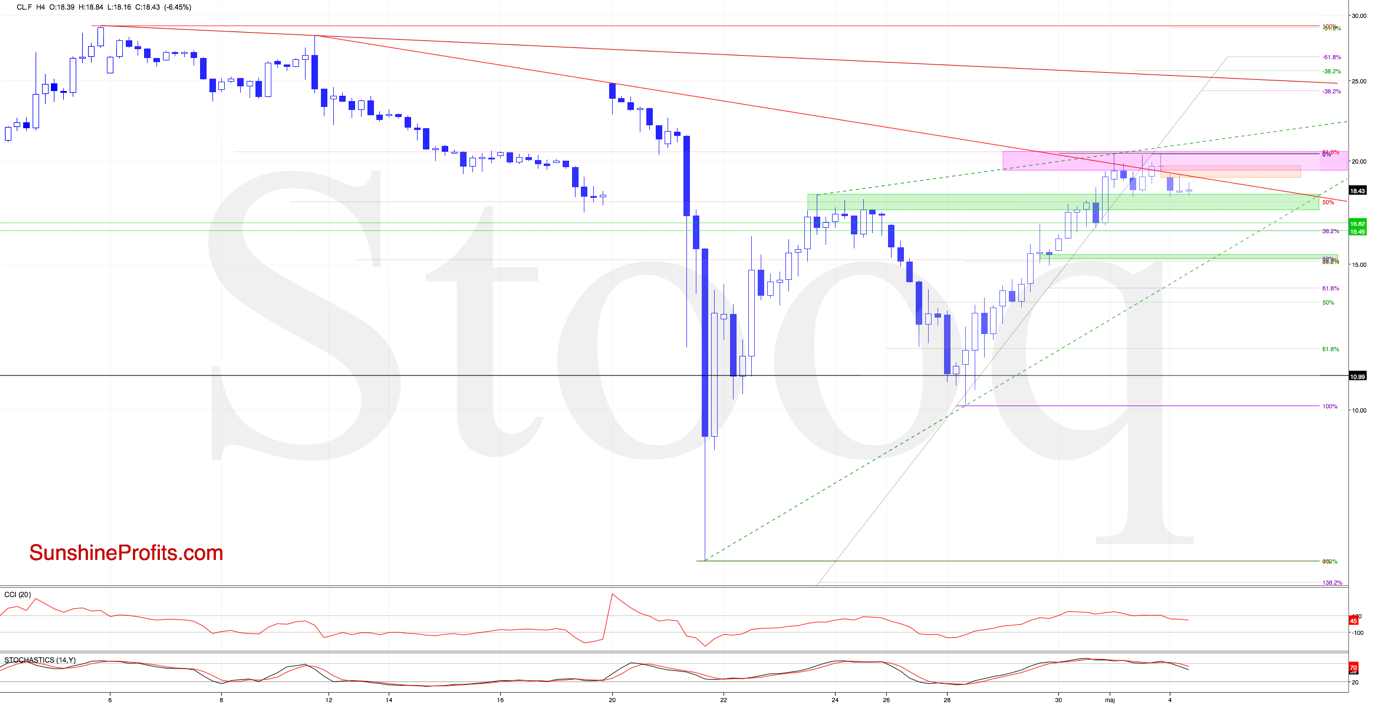
From this perspective, we see that the crude oil futures tried to break above the above-mentioned red resistance line, but all Friday's attempts failed. This shows that the bulls are struggling at this area - invalidations of the earlier tiny breakouts didn't bode well for higher values of the futures.
Additionally, the futures reached the 61.8% Fibonacci retracement (based on the entire March-April decline slightly above the mentioned red resistance line), which gave the sellers an additional reason to act during Friday's session.
In this way, market participants created a pink resistance area based on the retracement and Friday's highs, which together with the red declining resistance line serves as the nearest resistance.
As we mentioned earlier, the crude oil futures opened today with the orange gap, which resulted in a drop below the red resistance line and an invalidation of the earlier tiny Friday's breakout, which suggests that further deterioration may be just around the corner - especially when we factor in the sell signals generated by the 4-hour indicators.
How low could the futures go if the situation develops in tune with our assumptions?
In our opinion, the first downside target for the bears would be around $16.46-$16.82, where the bottom of the Thursday's correction and the 38.2% Fibonacci retracement (based on the recent upward move) are.
However, if this support area is broken, the next target would be around $15.20-$15.40, where the next green support area (created by two important Fibonacci retracements and the bottom of the Wednesday's correction) and probably the lower border of the green rising wedge would intersect.
Moreover, in case the decline becomes very volatile, we might - at least very briefly - see the re-test of the previous lows. While crude oil continuous futures might not slide all the way down below $7, they could still decline to the second bottom at about $10. The 61.8% Fibonacci retracement based on the most recent rally is at about $12, so we'll put our binding profit-take level slightly above this level. At the same time, we would like to stress that this doesn't mean that we will neither adjust this level, nor that we will definitely wait until crude oil gets there to exit the position. If the risk to reward ratio becomes less favorable, we'll exit the position at that time.
Summing up, the outlook for crude oil has deteriorated based on the resistance levels reached and on the 4-hour indicators. It seems that we might see another downturn relatively soon. Consequently, we are opening speculative short positions. At the moment of writing these words, crude oil is trading at $19.27, so the stop-loss level for the current trade is relatively close and the risk seems relatively low (compared to our previous trades).
If you enjoyed the above analysis and would like to receive daily premium follow-ups, we encourage you to sign up for our Oil Trading Alerts to also benefit from the trading action we describe - the moment it happens. The full analysis includes more details about our current positions and levels to watch before deciding to open any new ones or where to close existing ones.
Thank you.
Nadia Simmons
Day Trading and Oil Trading StrategistPrzemyslaw Radomski, CFA
Editor-in-chief, Gold & Silver Fund Manager -
About the Shaky Ground of the Oil Upswing
April 30, 2020, 11:12 AMAvailable to premium subscribers only.
Free Gold & Oil Newsletter
with details not available
to 99% investors
+ 7 days of Gold Alerts
+ Mining Stock Rankings
Gold Alerts
More-
Status
New 2024 Lows in Miners, New Highs in The USD Index
January 17, 2024, 12:19 PM -
Status
Soaring USD is SO Unsurprising – And SO Full of Implications
January 16, 2024, 8:40 AM -
Status
Rare Opportunity in Rare Earth Minerals?
January 15, 2024, 2:06 PM
Metals charts


