

-
Mixed Signals on The Dashboard, So Oil Pays Attention to Stocks
June 3, 2022, 1:23 PMWhat are the main fundamentals for crude oil to look at? Russia’s revenues boosted by high oil prices, OPEC+ raising output, dropping US inventories.
On Thursday (June 2), black gold prices rallied more than one percent after US crude reserves dropped more than expected amid higher demand for fuel, despite the OPEC+'s output deal to boost crude oil supplies by 648k barrels per day this summer, instead of its planned 432k) to offset the drop in Russian oil production.
Today, Russia's finance ministry just said it expected to receive 393 billion roubles ($6.35 bn) in additional oil and gas revenue this month.
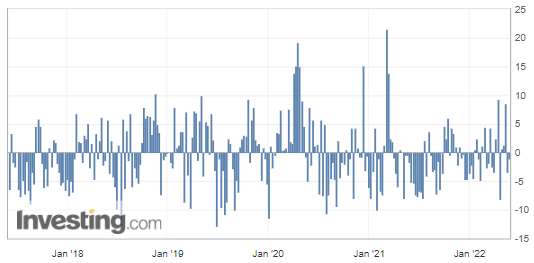
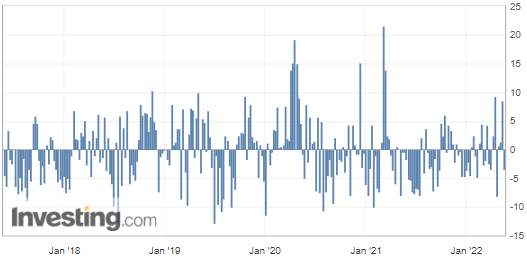
United States Crude Oil Inventories
The weekly commercial crude oil reserves in the United States fell almost four times more than the predictions, according to figures released on Thursday by the US Energy Information Administration (EIA).

US crude inventories have decreased by over five million barrels, which implies greater demand and is considered a bullish factor for crude oil prices. Here, the difference with the forecasted figure is quite high, which is why the increased output from OPEC+ remained in the back.
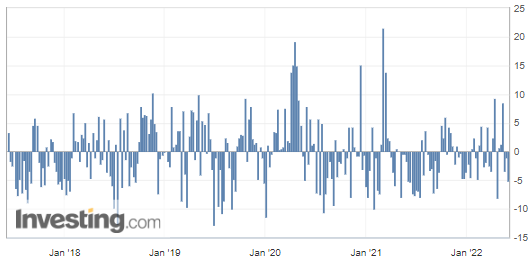
(Source: Investing.com)
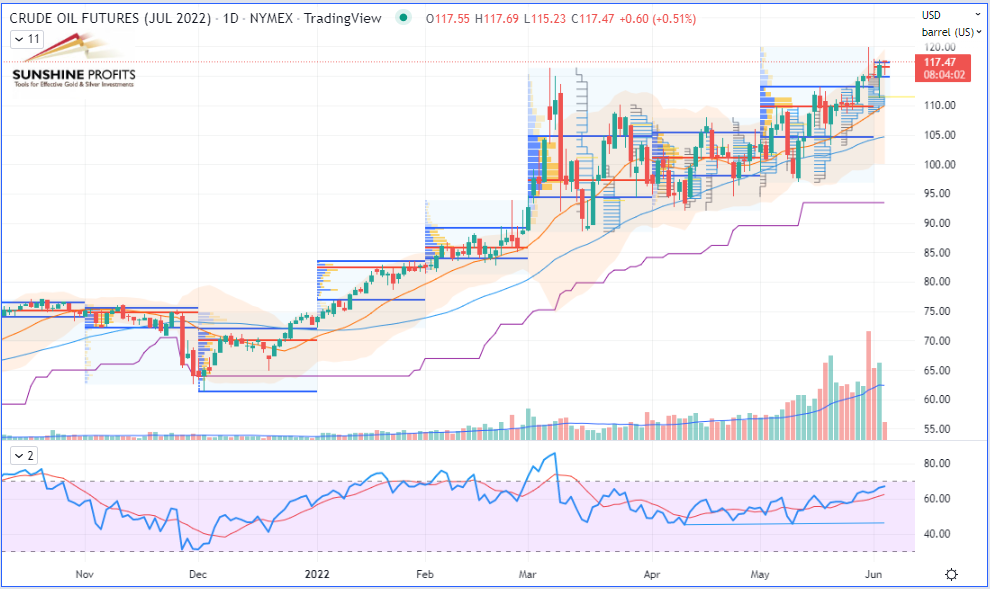
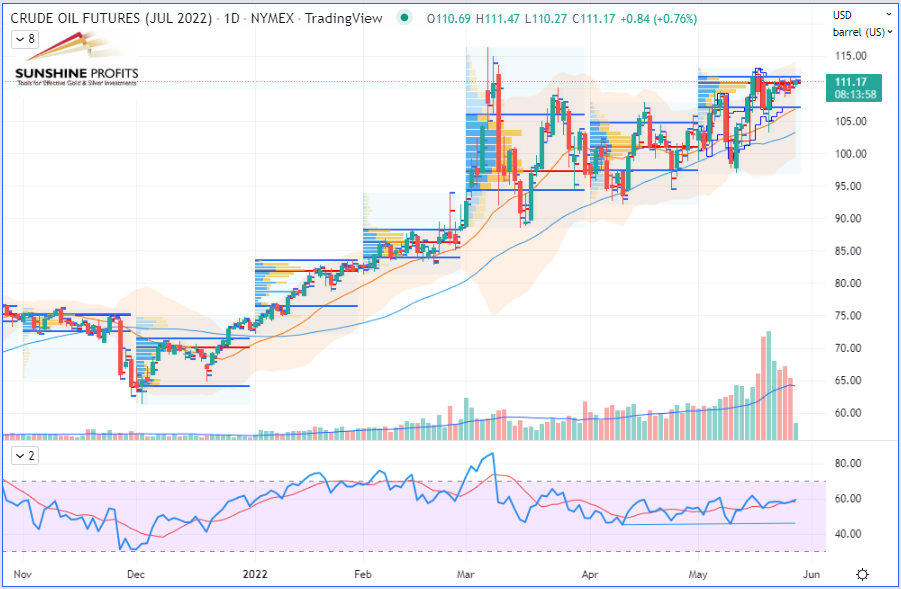
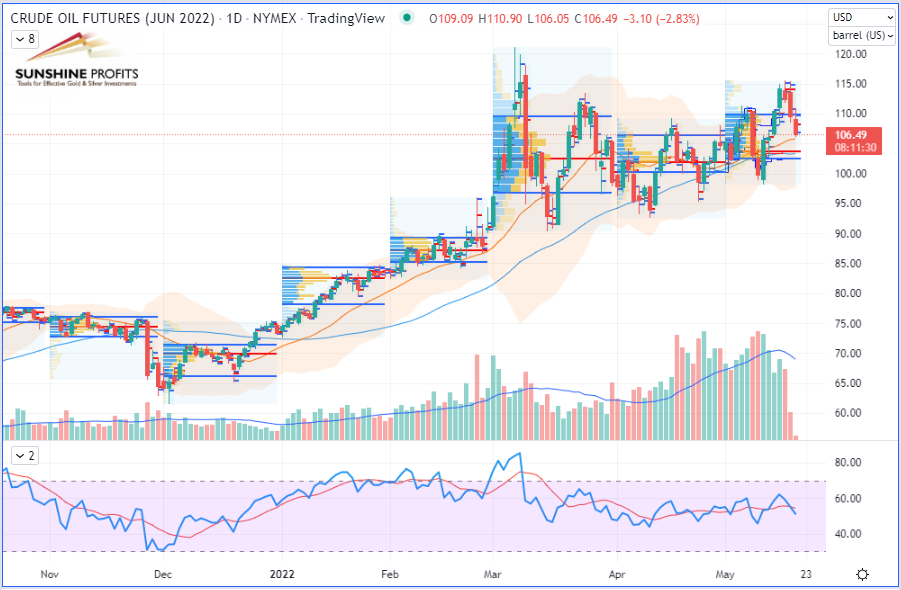
WTI Crude Oil (CLM22) Futures (June contract, daily chart)
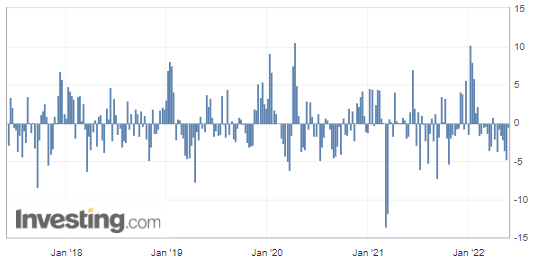
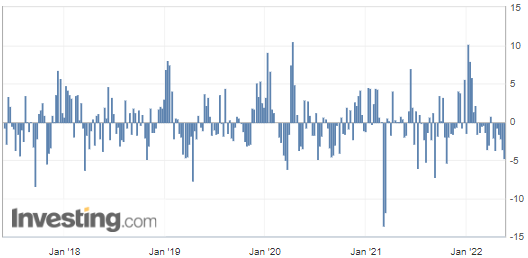
United States Gasoline Inventories
The following are US Gasoline Reserves which were extracted from the same released report:

The above figure confirmed the drop in fuel, which analysts did not expect to drop over a week, so the figure falls into the bullish side as well. Personally, I was mentioning the likeliness of a potential drop in my last analysis from May 26, because of a demand acceleration triggered by the beginning of the Summer Driving Season in the USA.
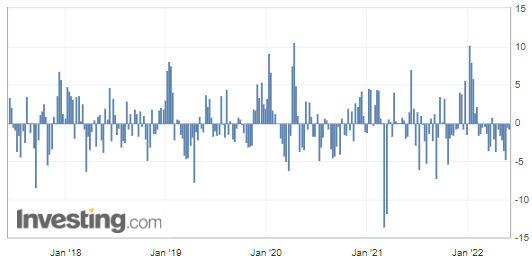
(Source: Investing.com)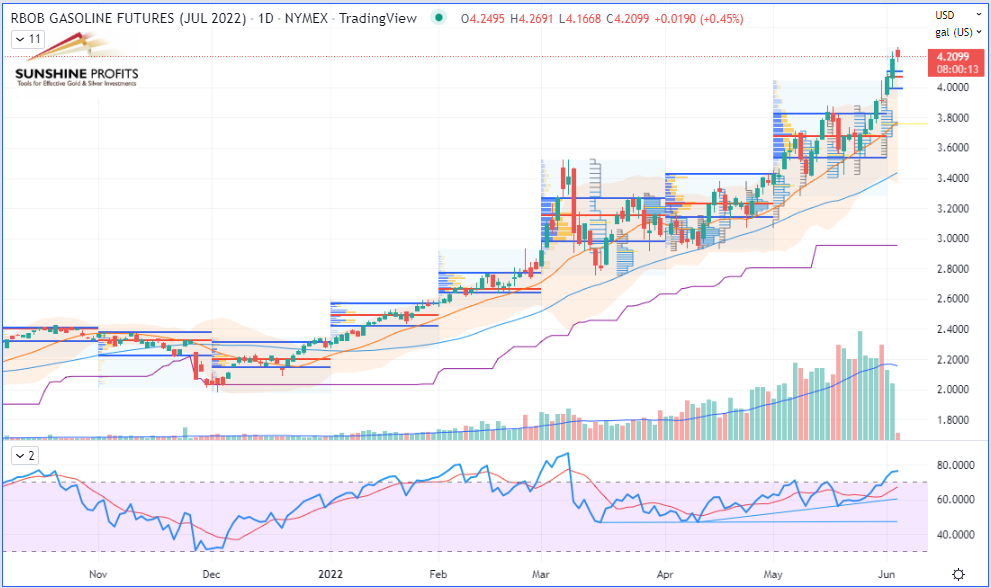
RBOB Gasoline (RBM22) Futures (June contract, daily chart)
Wishing you a good weekend!
Today's premium Oil Trading Alert includes details of our new trading position. Interested in more exclusive updates? Join our premium Oil Trading Alerts newsletter and read all the details today.
Thank you.
Sebastien Bischeri,
Oil & Gas Trading Strategist -
New Market Conditions - New Natural Gas Trade Projections
June 1, 2022, 10:21 AMWhile Europe could face fuel shortages this summer due to tight oil markets, how to enter a trade in current conditions?
On the NYMEX, natural gas futures have reached record levels around the $10 mark before reverting to around $8-8.50. If the production estimates climb, it does not seem to be enough to slow demand down. Concerning U.S. liquified natural gas (LNG) exports, it appears that a joint task force – formed by the White House and the European Commission – would secretly assist the European Union in securing more US-sourced (shale) gas while displacing Russian natural gas imports.
Meanwhile, Europe could face fuel shortages this summer due to tight oil markets, International Energy Agency (IAE) Director Fatih Birol told German newspaper Spiegel. So, energy demand may support prices by providing them with a rebounding floor.
That is precisely where we would take action in order to get long on our newly defined support zone!
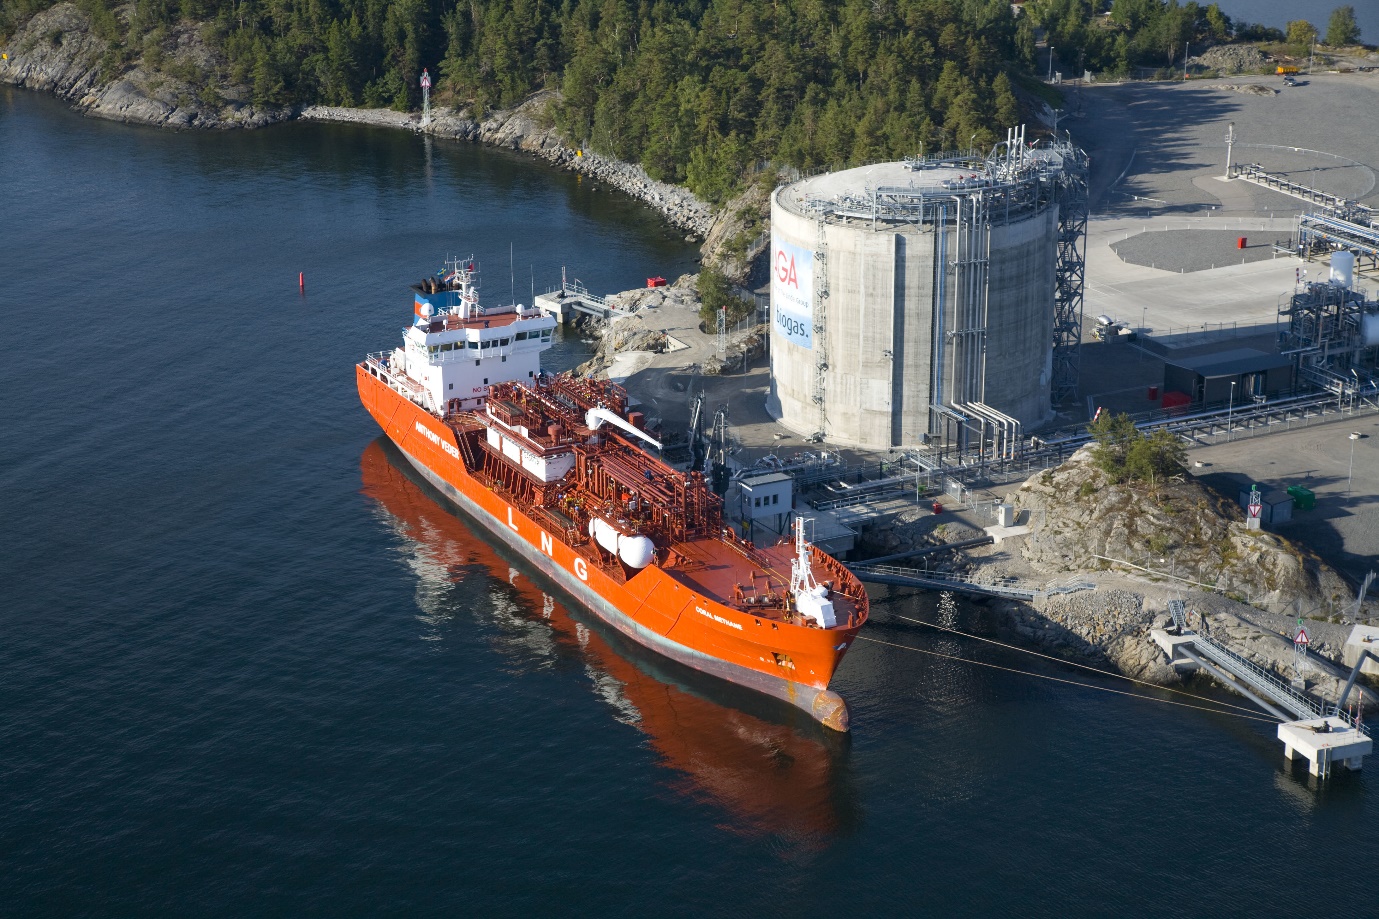
Liquefied Natural Gas (LNG) Terminal (Source, Author: Jan Arrhénborg / AGA, License: Creative Commons)
Today's premium Oil Trading Alert includes details of our new trading position. Interested in more exclusive updates? Join our premium Oil Trading Alerts newsletter and read all the details today.
Thank you.
Sebastien Bischeri,
Oil & Gas Trading Strategist -
Black Gold Still Hesitant Despite Bullish US Crude Inventories
May 26, 2022, 10:22 AMA drop in reserves was slightly bigger than expected, however, the crude oil market remains hesitant to break out. What’s holding it back?
Crude oil prices have been progressing very slowly during the quiet European session on Thursday, as several European countries celebrate Ascension Day and preparations for the long Memorial Day weekend are underway in the United States.. We may expect some profit-takings on various commodity markets before the start of the US Summer Driving Season, however, it could be offset by an increase in gasoline demand in the forthcoming days and weeks.
Let’s keep an eye on Volatility
The Volatility Index (VIX) – aka “Fear Index” – is currently making lower highs as it can be seen in the following charts, especially on the weekly and daily charts, nevertheless, it remains well above the $20-25 zone.
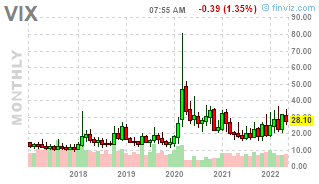
VIX (Monthly chart, Source: FINVIZ.com)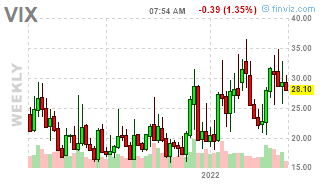
VIX (Weekly chart, Source: FINVIZ.com)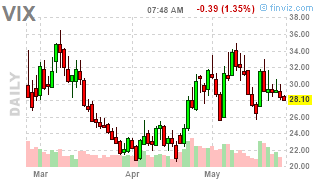
VIX (Daily chart, Source: FINVIZ.com)If we were seeing a spike towards $40, this could signal an acceleration of volatility and would potentially precede a more violent market crash, notably marked by a sudden drop in equities…
On the contrary, if a de-escalation were going to happen in the Black Sea region, the VIX could fall back to its lower levels (except if we get fears redirected to a probable recession), below that $20-25 band. Thus, volatility represents another critical instrument on any trader’s dashboard to carefully monitor while trading financial markets.
United States Crude Oil Inventories
This time, the weekly commercial crude oil reserves in the United States dropped a little more than the predictions, according to figures released on Wednesday by the US Energy Information Administration (EIA).

US crude inventories have decreased by over 1 million barrels, which implies slightly greater demand and is normally considered a bullish factor for crude oil prices. Here, the difference with the forecasted figure is rather low though…
(Source: Investing.com)
WTI Crude Oil (CLM22) Futures (June contract, daily chart)
United States Gasoline Inventories
On the other hand, some additional figures extracted from the same EIA report were released:

These are US Gasoline Reserves, which were expected to drop by 634 thousand barrels over the week. However, with 482 thousand barrels on the meter, the figure falls into the bearish side (having a lower deviation than expected), even though we may start to see accelerating demand triggered by the beginning of the Summer Driving Season in the USA in the forthcoming days or weeks.
(Source: Investing.com)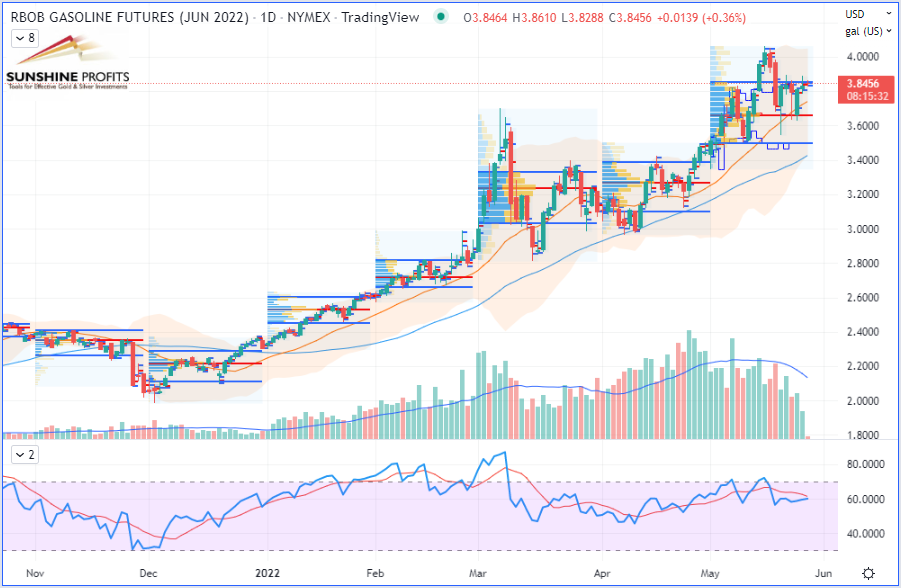
RBOB Gasoline (RBM22) Futures (June contract, daily chart)
On the Eastern side of Europe, Russian oil production shows an extraordinary ability to adapt to tougher economic conditions – in particular, Russia's economy withstanding sanctions – including the emergence of China and India as key buyers of Russian crude, in part due to the appealing discounts they are offered. After all, it is not Black (Gold) Friday every day!
That’s all for today, folks. Happy trading!
Today's premium Oil Trading Alert includes details of our new trading position. Interested in more exclusive updates? Join our premium Oil Trading Alerts newsletter and read all the details today.
Thank you.
Sebastien Bischeri,
Oil & Gas Trading Strategist -
Can Crude Oil Escape Its Current Ranging Market?
May 24, 2022, 9:41 AMThe black gold – currently trading around $110 – is hesitating between making further gains driven by tightening supplies and losing ground in a context of economic slowness.
Crude oil prices are slightly down after closing flat yesterday (May 23) as the market swings between gains and losses in a wide range, currently struggling to find direction, as the US dollar index weakened by correcting almost back onto its 50-day moving average (DMA). The greenback indeed closed yesterday below its two-week lows. Meanwhile the ECB’s chief, Christine Lagarde, was taking a rather significant hawkish tone overnight, hinting at a probable rate hike in July which would get the shared currency out of its negative interest rate territory.
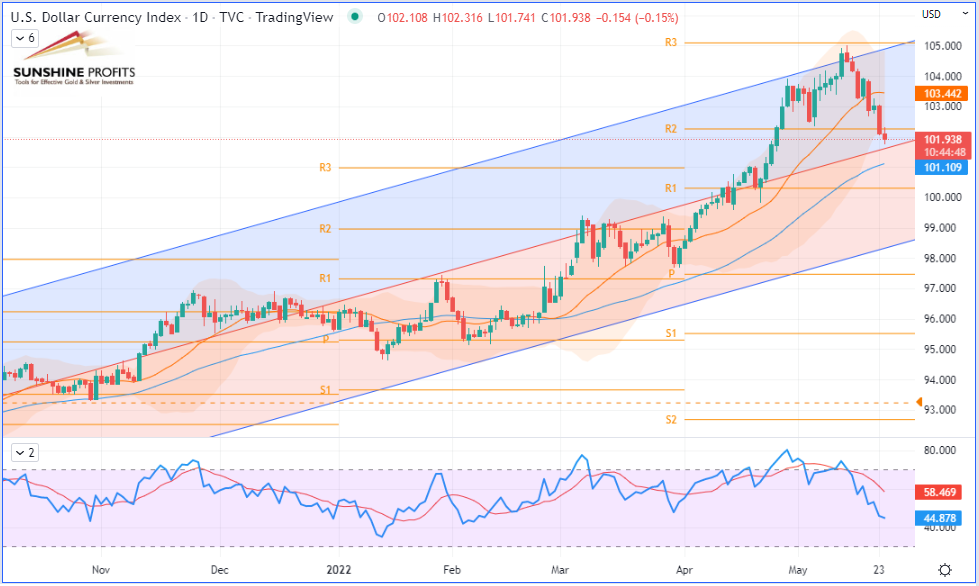 US Dollar Currency Index (DXY) CFD (TradingView, daily chart)
Global economic issues
Growing fears of a global recession and an economic slowdown in China due to its strict zero-Covid policy paint a bleak picture of the demand outlook and put downward pressure on prices.
Hungary’s concerns
Hungary, which is heavily dependent on Russian oil, said it would need around 750 million euros ($800 million) in short-term investment to upgrade refineries and expand an oil pipeline transporting oil from Croatia. In the long term, it is estimated that converting the Hungarian economy to avoid Russian oil could cost up to 18 billion euros. So to convince Hungary, the European Commission last week offered up to €2 billion in support for landlocked countries in Central and Eastern Europe that do not have access to non-Russian supplies, also including countries such as Czech Republic and Slovakia.
Norwegian shortages drive UK gas prices higher
While energy prices have been rising by 9% a year in the United Kingdom – the highest rate for 40 years – gas prices in Great Britain soared due to some supply shortages from Norway, its main supplier which covers more than 60% of the UK total supplies. In fact, Norway suffered unplanned outages at its giant natural gas field, including flows through the Langeled pipeline (operated by Norwegian Gas System Manager, Gassco) that fell to 38 million cubic meters (mcm) per day due to outages.
Location of Langeled pipelineOil & Gas Charts
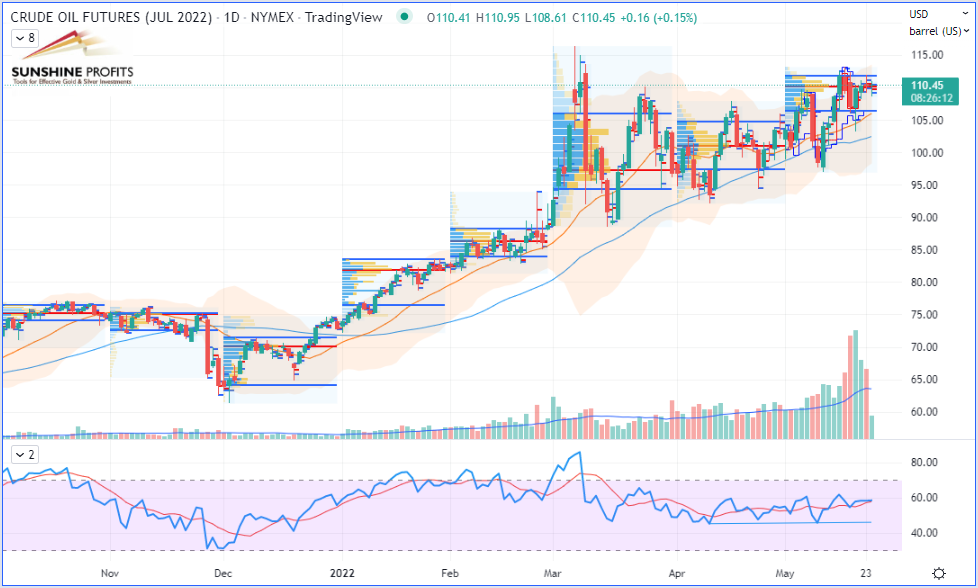 WTI Crude Oil (CLN22) Futures (July contract, daily chart)
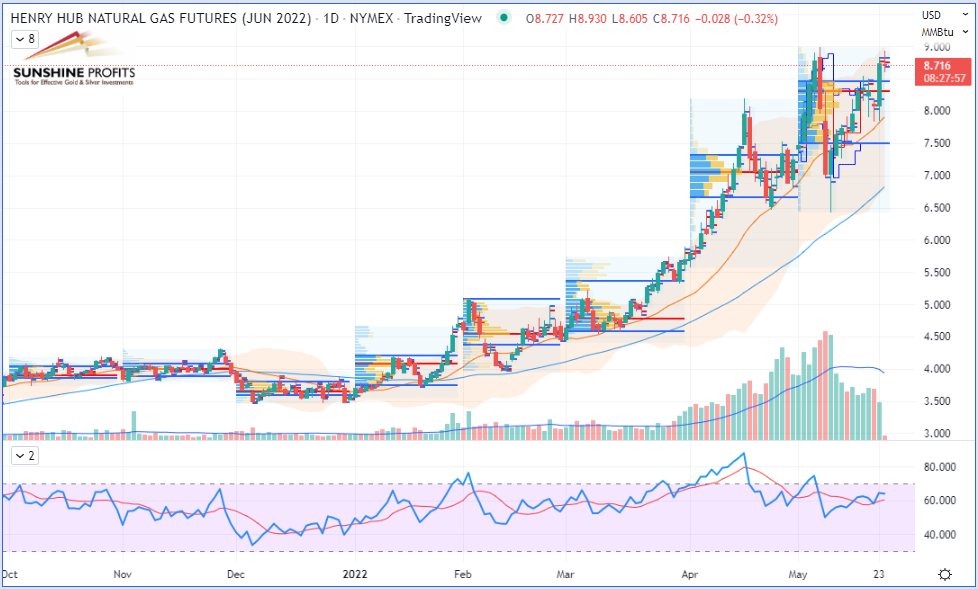 Henry Hub Natural Gas (NGM22) Futures (June contract, daily chart)
So, what progress do you think oil will make? Will it break out of its current range and accelerate further up, while getting fuelled by geopolitics and tightening supplies? Or do you think that crude is set to drop lower? Write back and let me know.
That’s all for today, folks. Happy trading!
Today's premium Oil Trading Alert includes details of our new trading position. Interested in more exclusive updates? Join our premium Oil Trading Alerts newsletter and read all the details today.
Thank you.
Sebastien Bischeri,
Oil & Gas Trading Strategist -
Why Is Crude Oil Ignoring US Inventories?
May 19, 2022, 10:34 AMWhile the current pull-back on black gold is fundamentally triggered by different forces, where is the prevailing wind coming from that is pushing prices lower?
On Wednesday, the day after the US Fed’s Chair Powell showed a more hawkish tone, crude oil prices dropped 2.5% following profit-takings on most commodity markets - new fears emerged that a world economic slowdown combined with rising interest rates could negatively impact the global demand. By the way, talking about profit-takings, our subscribers took theirs on Monday within the last phases of the strong rally in crude oil that hit our last projected targets.
United States Crude Oil Inventories
The commercial crude oil reserves in the United States unexpectedly dropped in the week ended May 13, according to figures released on Wednesday by the US Energy Information Administration (EIA).

US crude inventories have decreased by almost 3.4 million barrels, which implies greater demand and would normally be considered a bullish factor for crude oil prices. However, it appears that with the US Federal Reserve’s sustained hawkish tone, which contributes to pushing commodities to the lower side, the market does not pay as much attention to US crude inventories, which are relegated to the background…
(Source: Investing.com)
WTI Crude Oil (CLM22) Futures (June contract, daily chart)
United States Gasoline Inventories
On the other hand, some additional figures extracted from the same EIA report were released:

These are US Gasoline Reserves, which plunged by almost 4.78 million barrels over a week, while the market forecasted a decline of only 1.33 million barrels.
(Source: Investing.com)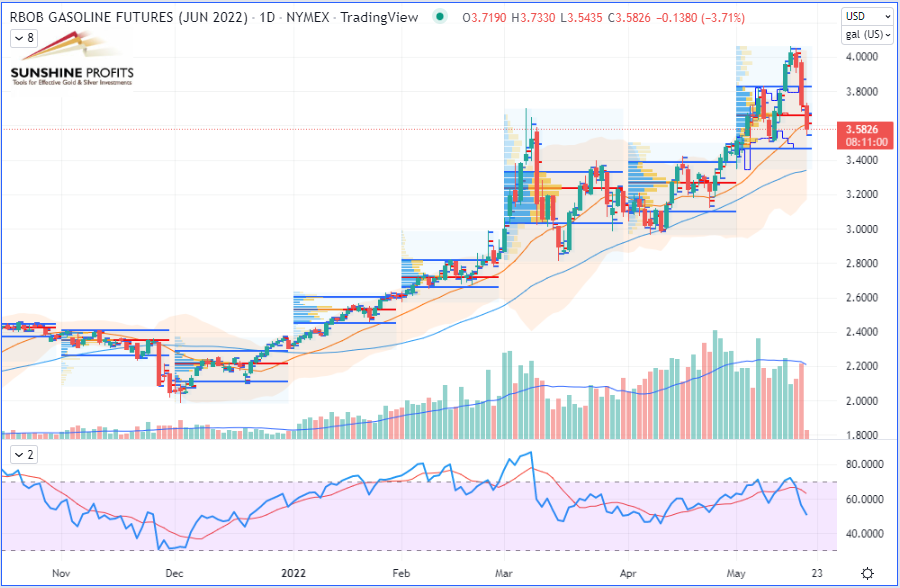
RBOB Gasoline (RBM22) Futures (June contract, daily chart)
Consequently, despite demand for black gold, which nevertheless remains at a high level according to the two above figures, crude oil prices continued to slide on Thursday. They proceeded with their decline from the previous day, still dampened by fears of a global economic slowdown.
The possible easing of US sanctions against Venezuela could be considered another bearish factor, coming in addition to the Hungarian veto on the EU’s plan to ban Russian oil. The European problems didn’t stop there, as Turkey opposed the opening of talks on the NATO membership extension to Finland and Sweden after the two Nordic countries submitted a formal application.
The current situation of Hungary is quite understandable, since the Central European country is particularly dependent on Russian hydrocarbons.
So, what do you think will now happen to black gold? Let us know in the comments.
That’s all, folks, for today. Happy trading!
Today's premium Oil Trading Alert includes details of our new trading position. Interested in more exclusive updates? Join our premium Oil Trading Alerts newsletter and read all the details today.
Thank you.
Sebastien Bischeri,
Oil & Gas Trading Strategist


Free Gold & Oil Newsletter
with details not available
to 99% investors
+ 7 days of Gold Alerts
+ Mining Stock Rankings
Gold Alerts
More-
Status
New 2024 Lows in Miners, New Highs in The USD Index
January 17, 2024, 12:19 PM -
Status
Soaring USD is SO Unsurprising – And SO Full of Implications
January 16, 2024, 8:40 AM -
Status
Rare Opportunity in Rare Earth Minerals?
January 15, 2024, 2:06 PM
Metals charts


