

-
Oil Rebounded from Support Yesterday, Yet Again Trades Lower Today
October 30, 2019, 10:26 AMLet's dive into the chart below (chart courtesy of www.stooq.com ) to find out where crude oil price is headed next.
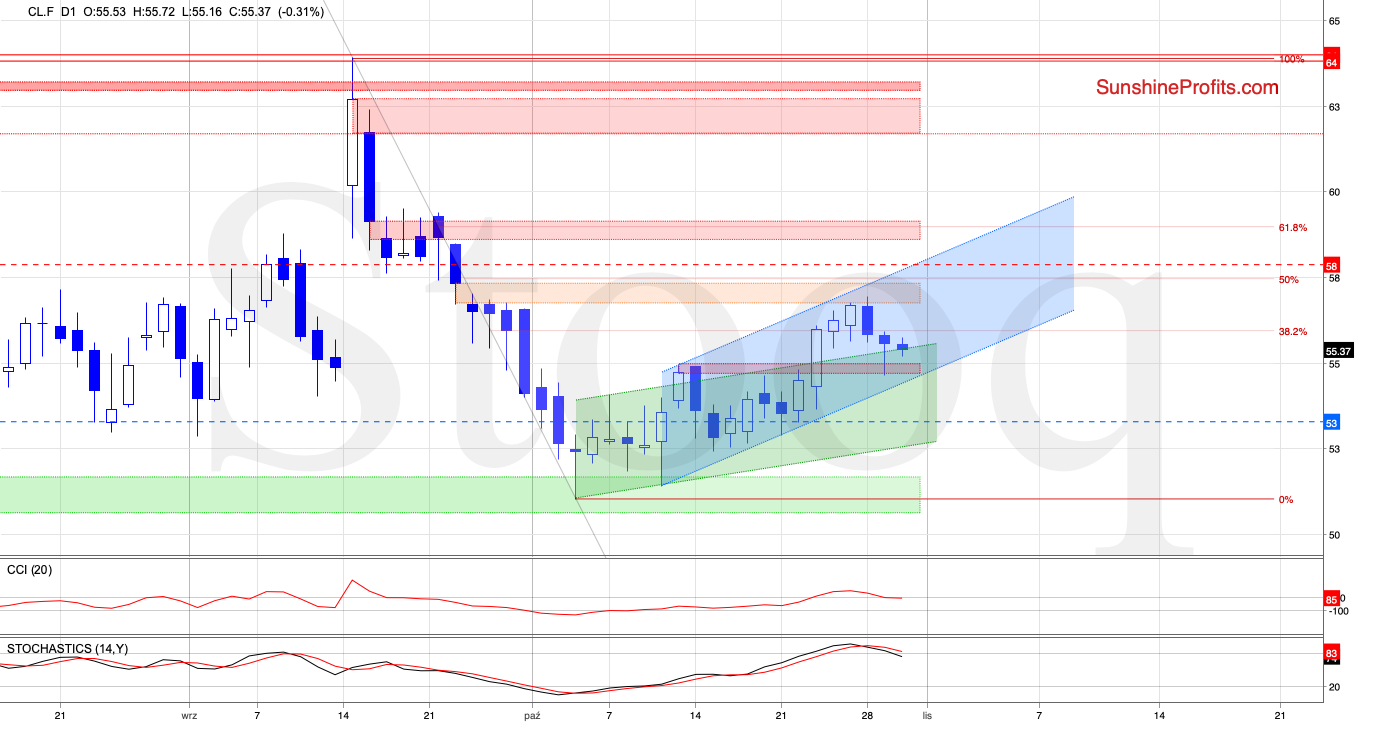
The daily chart shows the previously broken red zone that serves now as support. This is where prices rebounded from yesterday, closing above the upper border of the rising green trend channel.
The futures' invalidation of the earlier small breakdown below this support, is a positive sign for the bulls. Despite this improvement, they however didn't manage to hold on to their gains, and prices attempted to move lower once again before today's market open.
Additionally, the sell signals generated by the CCI and the Stochastic Oscillator remain on the cards, supporting the sellers and further deterioration in the coming day(s). This is especially so when we remember about the tiny gap between yesterday's open and Monday's close still being open.
What could happen if the futures extend declines from here?
In our opinion, we'll see not only a test of the lower border of the very short-term rising blue trend channel, but maybe even a drop to the lower border of the green channel in the following days - yes, that's below our initial downside target.
Summing up, the short position continues to be justified from the risk/reward perspective as crude oil futures moved lower, increasing the probability of an invalidation of the earlier breakout above the upper border of the rising green trend channel. If the situation develops in tune with this scenario, the way to yesterday's low will be open.
We hope you enjoyed reading the above free analysis, and we encourage you to read today's Oil Trading Alert - this analysis' full version. It includes more details about our current positions and levels to watch. There's no risk in subscribing right away, because there's a 30-day money back guarantee for all our products, so we encourage you to subscribe today.
-
That's an Oil Reversal We Saw Yesterday, Isn't It?
October 29, 2019, 11:52 AMMany times in the past, the relationship between these two commodities gave us valuable clues about crude oil future moves. Will the history repeat itself once again? What can we infer about the next gold move from the chart below?
Let's examine the current situation in the oil-to-gold ratio to find answers to these questions.
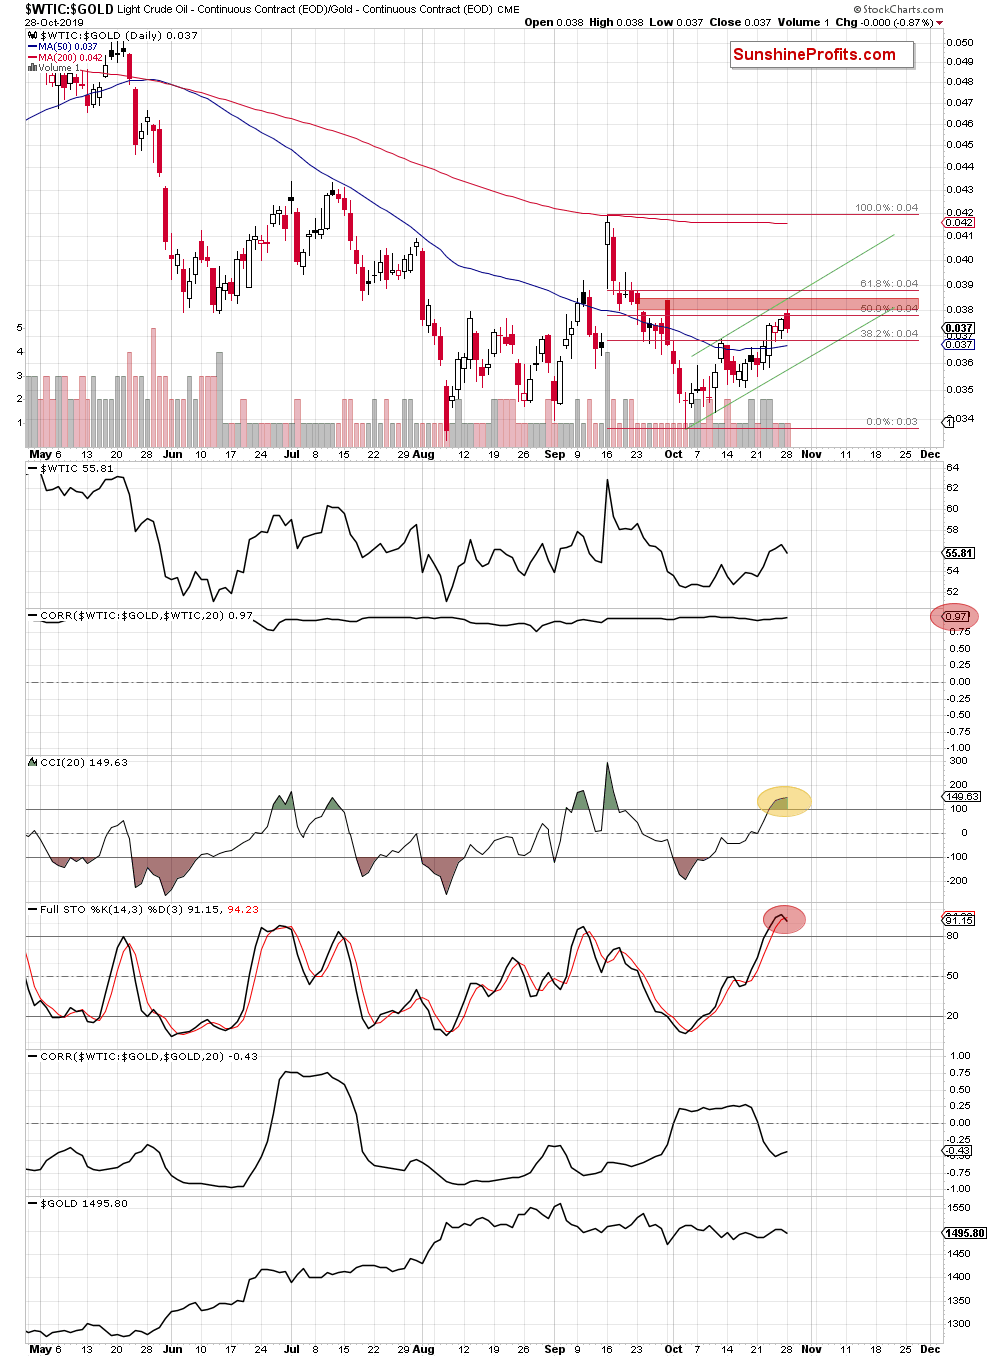
The daily chart shows that although crude oil-to-gold ratio opened yesterday's session with a bullish gap, moving even higher after the markets' open, the red gap created on September 24, 2019 stopped the bulls. It was the bears that took the reins in the following hours.
The ratio reversed and moved quite sharply lower, invalidating the earlier small breakout above the 50% Fibonacci retracement. Additionally, the sellers formed a bearish formation on the above chart - the dark cloud cover pattern.
What do we know about this candlestick formation?
It usually appears at the end of the upward trend and precedes its reversal. Its first part is formed by a white candle. Then a black candle must appear on the market to complete the formation. What's important, is that this candle should open above the close of the first candle, pointing to further buying pressure. And that's exactly what has happened yesterday.
After that, the value/price of a given asset usually moves even higher, but the immediately following decline must be strong enough for the black candle to close below the midpoint of the white candlestick's body. Such a shift from buying to selling suggests that reversal and further deterioration could be just around the corner.
Taking a closer look at the above chart, we see that yesterday's close was below the above-mentioned level, which increases the probability of lower values of the oil-to-gold ratio in the very near future. This is especially so when we factor in the current situation in the CCI and the sell signal generated by the Stochastic Oscillator.
That's all very nice but what does it mean for the price of black gold?
The correlation between the ratio and the price of the commodity is very strong (0.97), meaning that lower values of the ratio are highly likely to also translate into further deterioration in crude oil.
And that further deterioration in the ratio, what would it mean for gold?
The correlation between the oil-to-gold ratio and the price of yellow metal decreased significantly in the previous weeks, which means that forecasting the direction of the yellow metal based on this relationship is not a good idea. You will learn much more about the current situation in gold (and the whole precious metals sector) from our Gold Trading Alerts.
We hope you enjoyed reading the above free analysis, and we encourage you to read today's Oil Trading Alert - this analysis' full version. It discusses the daily oil price outlook, describing what exactly makes us open a new position and why. There's no risk in subscribing right away, because there's a 30-day money back guarantee for all our products, so we encourage you to subscribe today.
-
Oil Reached Another Resistance. Can It Break Through?
October 28, 2019, 12:11 PMIn Thursday's Alert, we mentioned the struggles the bulls had with the first important Fibonacci retracement, and the importance of who wins the battle in this area. Friday's session showed that the buyers didn't give up as they reached another important resistance area before the closing bell.
Can today's session give us any tips as to the direction of further movement? Let's analyze the chart below (chart courtesy of www.stooq.com).
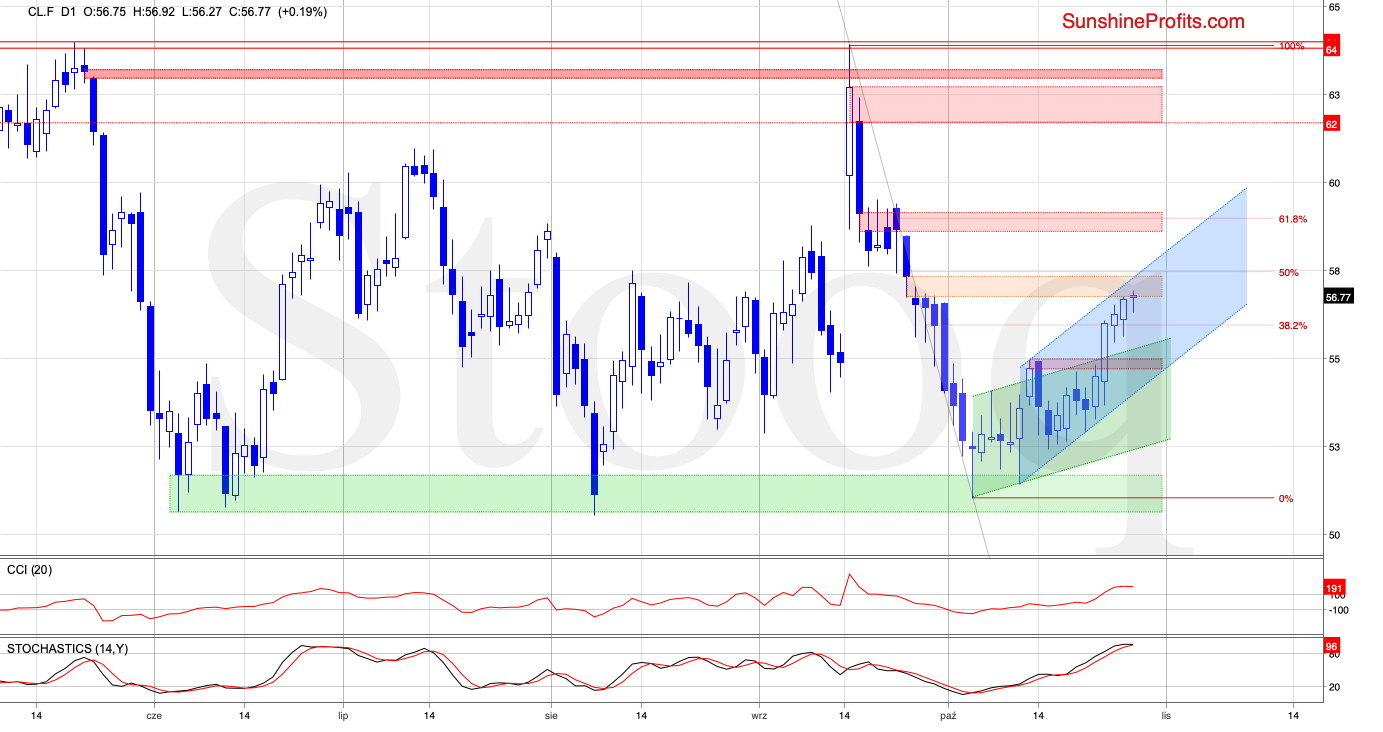
Crude oil futures opened today with a tiny gap. Despite this positive development, the orange gap encouraged the sellers to act, which translated into a pullback. However, this deterioration didn't last long and the bulls returned, pushing the futures above Friday's closing prices.
While this is a positive development, let's keep in mind that as long as the gap remains open, a bigger move to the upside is not likely to be seen - especially when we factor in the proximity to the 50% Fibonacci retracement, the upper border of the very short-term rising blue trend channel and the overbought position of both the CCI and the Stochastic Oscillator. They're very close to generating their sell signals.
We hope you enjoyed reading the above free analysis, and we encourage you to read today's Oil Trading Alert - this analysis' full version. It discusses what exactly we are keenly watching in the market, what would make us open a new position. There's no risk in subscribing right away, because there's a 30-day money back guarantee for all our products, so we encourage you to subscribe today.
-
Is Oil Consolidating, Or Rolling Over?
October 25, 2019, 11:38 AMNothing changed since our yesterday’s premium analysis was posted, and everything we wrote in it remains up-to-date, so saving our subscribers’ time, we’re not posting a regular analysis today. You will find the up-to-date crude oil market analysis below.
Thank you.
-
Oil Spikes On the Heels of Inventory Report. More Upside Ahead?
October 24, 2019, 9:40 AMIn yesterday's alert, we mentioned the price gap, which opened Wednesday's session. Although it was a bearish signal that could spur further sales, we decided to withhold the decision to open new position because of potentially increased volatility caused by market developments and the EIA inventory data.
Was this a good decision? Let's take a look at the chart below (charts courtesy of http://stockcharts.com and www.stooq.com ).
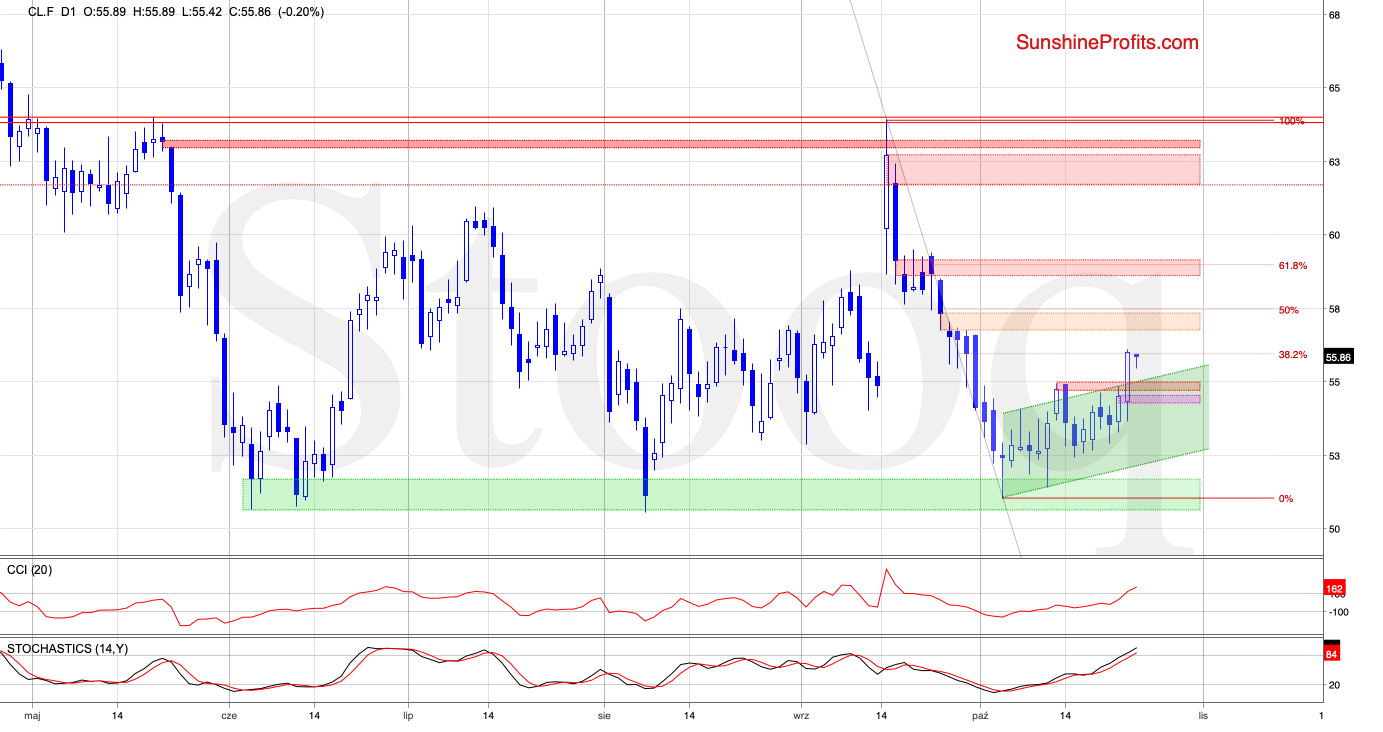
While crude oil futures moved lower after the gap appeared, the bulls took the reins after the U.S. Energy Information Administration reported a 1.7-million-barrel crude inventory drop for the week ended Oct.18 (missing analysts' expectations for a build-up of 2.2 million barrels).
This positive event encouraged the buyers to act, which brought about a sharp move to the upside. As a result, the futures not only closed the gap, but also broke above the upper border of the rising green trend channel and the red resistance zone.
This triggered further improvement and crude oil futures climbed to the 38.2% Fibonacci retracement based on the entire September-October decline. Despite the tiny breakout above the retracement, the futures pulled back. This translated into another daily open with a gap, which equals only 8 cents this time.
We saw another attempt to move lower in the following hours, but taking into account the lack of sell signals, it seems that we'll see another attempt to break above the 38.2% Fibonacci retracement next.
If the bulls win the battle around this level, the way to the orange gap and the late-September peaks could be open. But the sellers can take advantage of any sign of their weakness quickly.
Does the current market situation somehow affect our current position? At the moment, the answer is no. Why? Because the potential for the growth seems to be limited not only by the Fibonacci retracement, but also by the aforementioned gap. Therefore, we will wait for the result of the battle for 38.2% Fibonacci retracement before deciding to open any positions.
We hope you enjoyed reading the above free analysis, and we encourage you to read today's Oil Trading Alert - this analysis' full version. It discusses also the current situation in the NYSE Arca Oil Index (the XOI). The full Alert includes more details about levels to watch and correlation between the index and crude oil. There's no risk in subscribing right away, because there's a 30-day money back guarantee for all our products, so we encourage you to subscribe today.
Free Gold & Oil Newsletter
with details not available
to 99% investors
+ 7 days of Gold Alerts
+ Mining Stock Rankings
Gold Alerts
More-
Status
New 2024 Lows in Miners, New Highs in The USD Index
January 17, 2024, 12:19 PM -
Status
Soaring USD is SO Unsurprising – And SO Full of Implications
January 16, 2024, 8:40 AM -
Status
Rare Opportunity in Rare Earth Minerals?
January 15, 2024, 2:06 PM
Metals charts


