

Trading position (short-term; our opinion): Short position with a stop-loss order at $57.86 and the initial downside target at $53.28 is justified from the risk/reward perspective.
Let's analyze the charts below (charts courtesy of http://stockcharts.com and www.stooq.com) to find out where will the price of crude oil is headed next.
Although crude oil extended gains after yesterday's market open, this improvement proved only temporary. The commodity reversed and declined in the following hours.
What are the technical factors that encouraged the sellers to act?
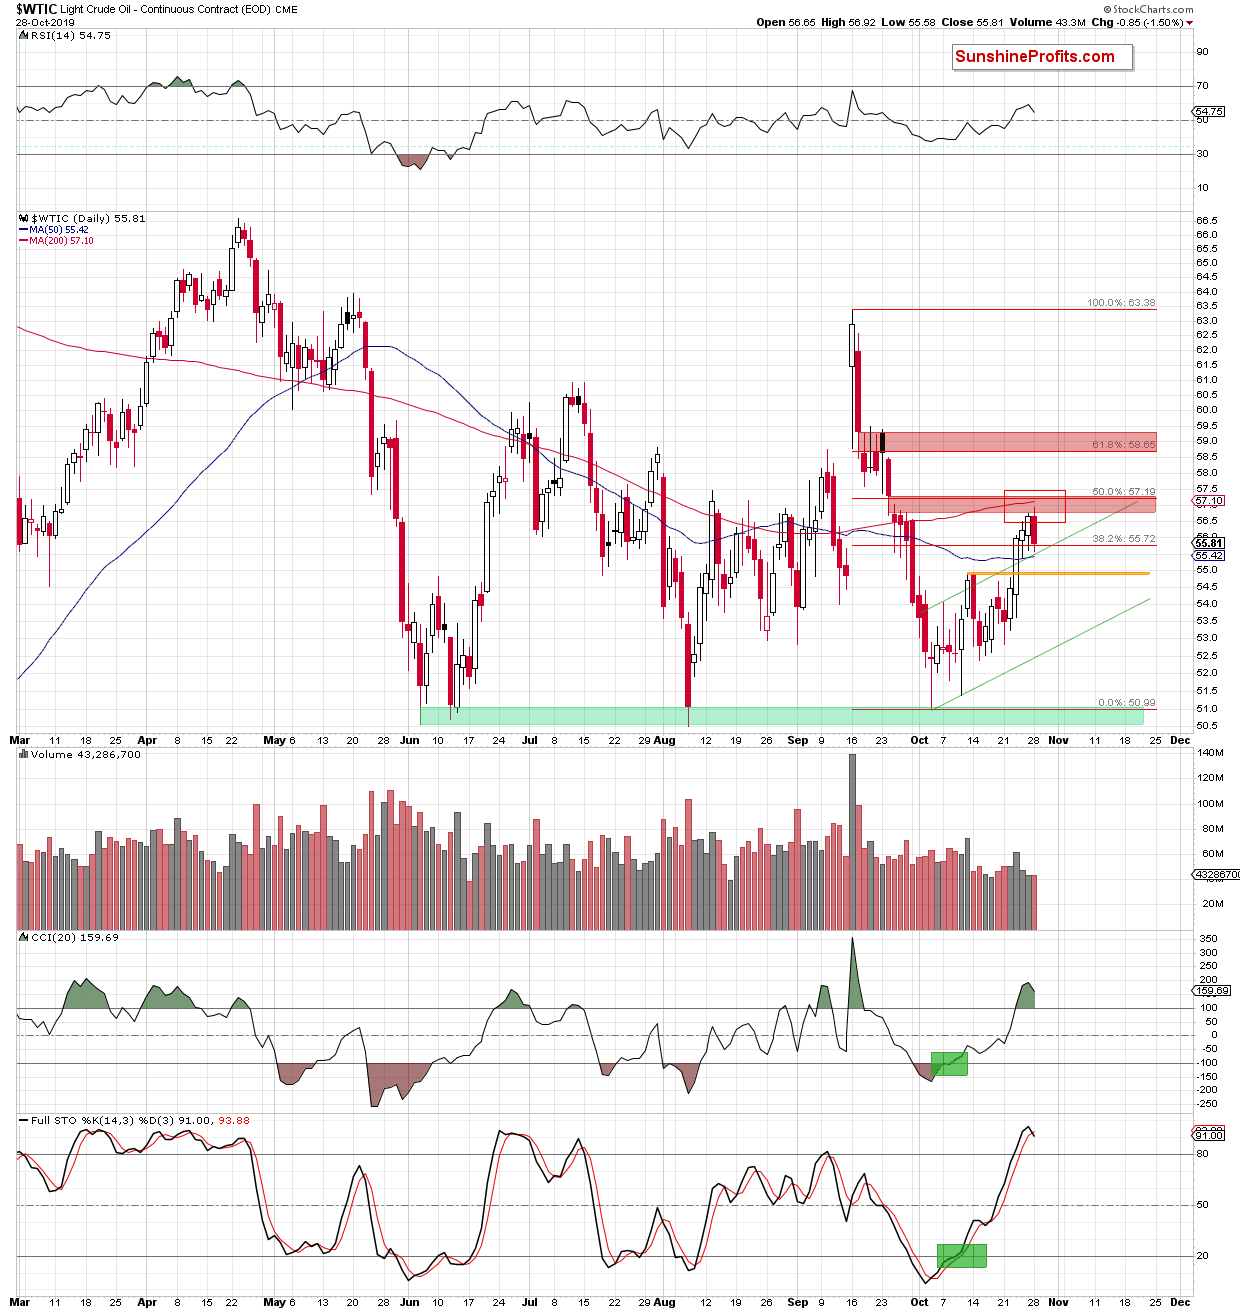
First, it was the red gap, which has been strong enough to stop the bulls several times in August and September.
Second, it was the proximity to the 200-day moving average.
And finally, the proximity to the 50% Fibonacci retracement did its job.
These three factors combined brought about a 1.5% decline and a daily close below $56. Yesterday's drop also means that the Stochastic Oscillator generated its sell signal, further supporting the bears.
How much is there left for today to drive the sellers into more action?
Before answering, let's recall our yesterday's words:
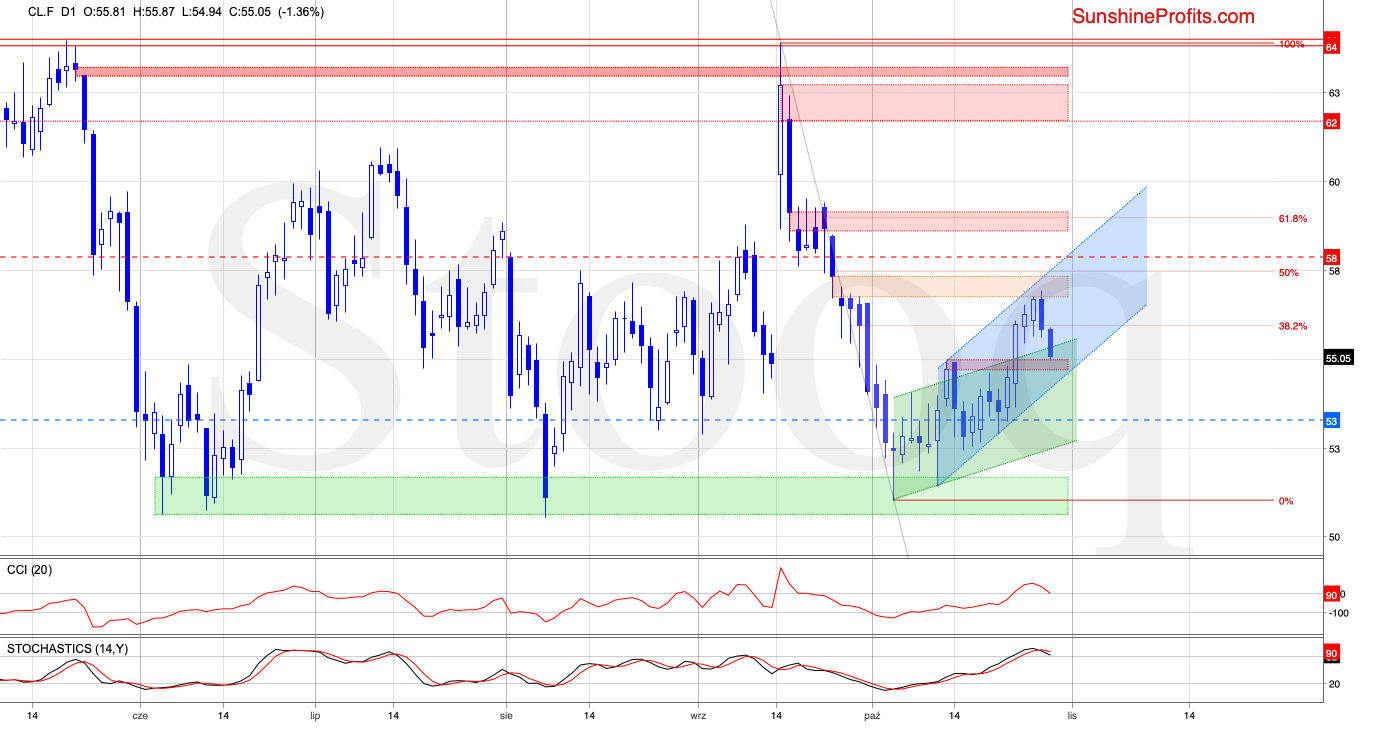
(...) as long as the gap remains open, a bigger move to the upside is not likely to be seen - especially when we factor in the proximity to the 50% Fibonacci retracement, the upper border of the very short-term rising blue trend channel and the overbought position of both the CCI and the Stochastic Oscillator. They're very close to generating their sell signals.
Therefore, even if the bulls retest the above-mentioned resistances, we will stay at the sidelines, waiting for more clear signs to emerge. These could include a bearish candlestick or an invalidation of the breakout above the blue channel for example. Nevertheless, should we see reliable signs of the buyers' weakness, we'll likely open short positions - this is a matter of very short time actually.
The situation has indeed developed in line with the above, and crude oil futures extended losses after our Alert was posted. Earlier today, they have moved even lower and invalidated the earlier breakout above the upper border of the green rising trend channel.
Additionally, the CCI and the Stochastic Oscillator generated their sell signals, increasing the probability of further deterioration in the coming day(s). On top of that, the picture emerging from the oil-to-gold ratio also favors the sellers at the moment of writing these words.
Relationship Between Crude Oil and Gold
Many times in the past, the relationship between these two commodities gave us valuable clues about crude oil future moves. Will the history repeat itself once again? What can we infer about the next gold move from the chart below?
Let's examine the current situation in the oil-to-gold ratio to find answers to these questions.
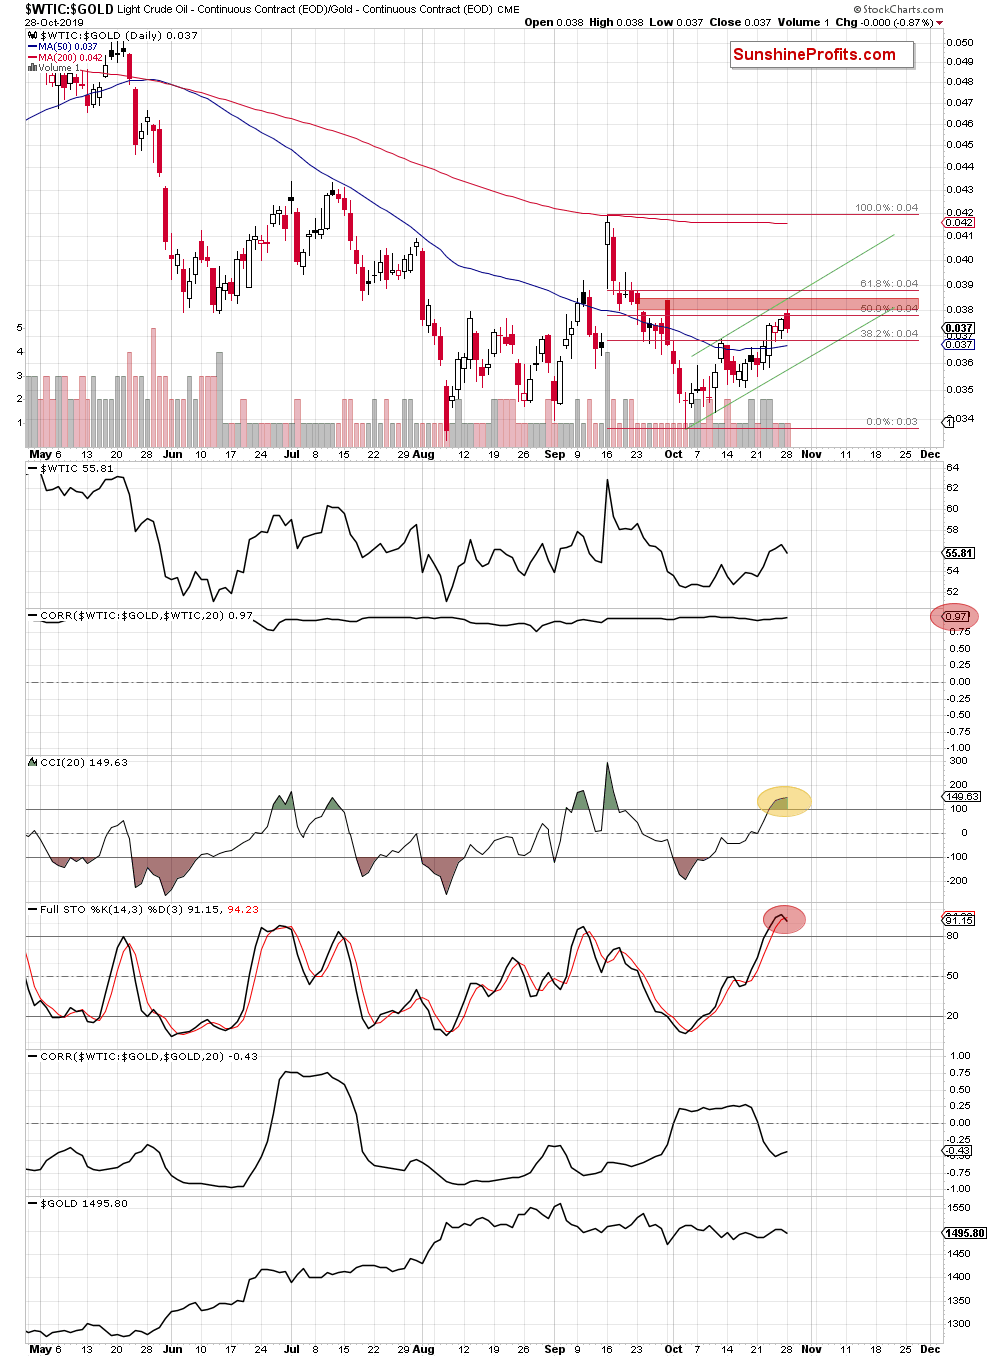
The daily chart shows that although crude oil-to-gold ratio opened yesterday's session with a bullish gap, moving even higher after the markets' open, the red gap created on September 24, 2019 stopped the bulls. It was the bears that took the reins in the following hours.
The ratio reversed and moved quite sharply lower, invalidating the earlier small breakout above the 50% Fibonacci retracement. Additionally, the sellers formed a bearish formation on the above chart - the dark cloud cover pattern.
What do we know about this candlestick formation?
It usually appears at the end of the upward trend and precedes its reversal. Its first part is formed by a white candle. Then a black candle must appear on the market to complete the formation. What's important, is that this candle should open above the close of the first candle, pointing to further buying pressure. And that's exactly what has happened yesterday.
After that, the value/price of a given asset usually moves even higher, but the immediately following decline must be strong enough for the black candle to close below the midpoint of the white candlestick's body. Such a shift from buying to selling suggests that reversal and further deterioration could be just around the corner.
Taking a closer look at the above chart, we see that yesterday's close was below the above-mentioned level, which increases the probability of lower values of the oil-to-gold ratio in the very near future. This is especially so when we factor in the current situation in the CCI and the sell signal generated by the Stochastic Oscillator.
That's all very nice but what does it mean for the price of black gold?
The correlation between the ratio and the price of the commodity is very strong (0.97), meaning that lower values of the ratio are highly likely to also translate into further deterioration in crude oil.
And that further deterioration in the ratio, what would it mean for gold?
The correlation between the oil-to-gold ratio and the price of yellow metal decreased significantly in the previous weeks, which means that forecasting the direction of the yellow metal based on this relationship is not a good idea. You will learn much more about the current situation in gold (and the whole precious metals sector) from our Gold Trading Alerts.
Connecting the dots, we think that opening short positions is justified from the risk/reward perspective. All details below.
Summing up, crude oil futures extended gains and reached the strong resistance area, which stopped the bulls and triggered a reversal yesterday. Thanks to Monday's decline, the sellers received even wind to their sails, which increases the probability of further deterioration in the following days. Therefore, opening short positions is justified from the risk/reward perspective in our opinion.
Trading position (short-term; our opinion): Short position with a stop-loss order at $57.86 and the initial downside target at $53.28 is justified from the risk/reward perspective.
Thank you.
Nadia Simmons
Forex & Oil Trading Strategist

