

Trading position (short-term; our opinion): No position is justified from the risk/reward perspective.
In yesterday's alert, we mentioned the price gap, which opened Wednesday's session. Although it was a bearish signal that could spur further sales, we decided to withhold the decision to open new position because of potentially increased volatility caused by market developments and the EIA inventory data.
Was this a good decision? Let's take a look at the chart below (charts courtesy of http://stockcharts.com and www.stooq.com ).
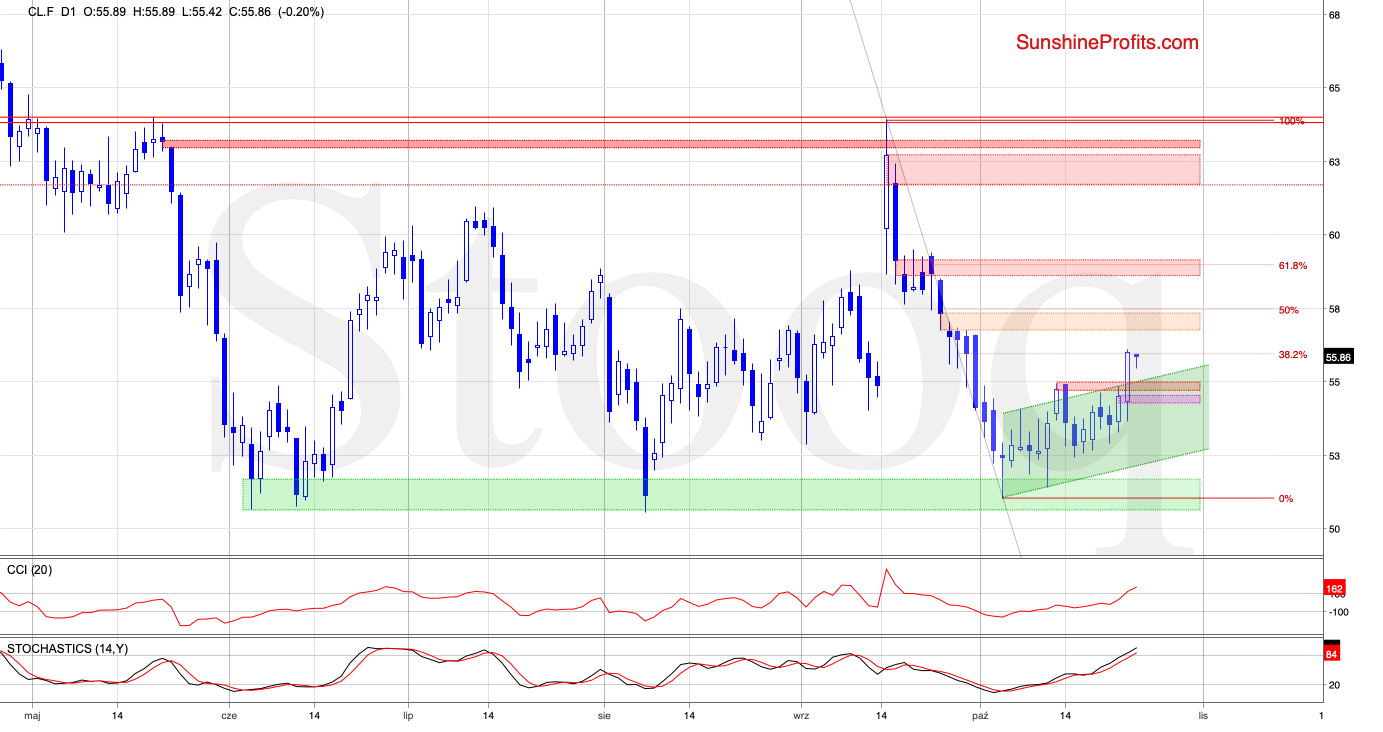
While crude oil futures moved lower after the gap appeared, the bulls took the reins after the U.S. Energy Information Administration reported a 1.7-million-barrel crude inventory drop for the week ended Oct.18 (missing analysts' expectations for a build-up of 2.2 million barrels).
This positive event encouraged the buyers to act, which brought about a sharp move to the upside. As a result, the futures not only closed the gap, but also broke above the upper border of the rising green trend channel and the red resistance zone.
This triggered further improvement and crude oil futures climbed to the 38.2% Fibonacci retracement based on the entire September-October decline. Despite the tiny breakout above the retracement, the futures pulled back. This translated into another daily open with a gap, which equals only 8 cents this time.
We saw another attempt to move lower in the following hours, but taking into account the lack of sell signals, it seems that we'll see another attempt to break above the 38.2% Fibonacci retracement next.
If the bulls win the battle around this level, the way to the orange gap and the late-September peaks could be open. But the sellers can take advantage of any sign of their weakness quickly.
Does the current market situation somehow affect our current position? At the moment, the answer is no. Why? Because the potential for the growth seems to be limited not only by the Fibonacci retracement, but also by the aforementioned gap. Therefore, we will wait for the result of the battle for 38.2% Fibonacci retracement before deciding to open any positions.
Summing up, the EIA data surprised market participants, encouraging the bulls to take over the market. As a result, crude oil futures rallied above the nearest resistances and then hit resistance created by the 38.3% Fibonacci retracement. In our opinion, the result of the battle for this level will show if buyers are ready to attack the price gap created in September (and marked with orange on the daily chart), which blocks the road to the north since September 25, 2019.
Trading position (short-term; our opinion): No position is justified from the risk/reward perspective.
Having said the above, let's take a closer look at the current situation in the NYSE Arca Oil Index. What can we infer from it?
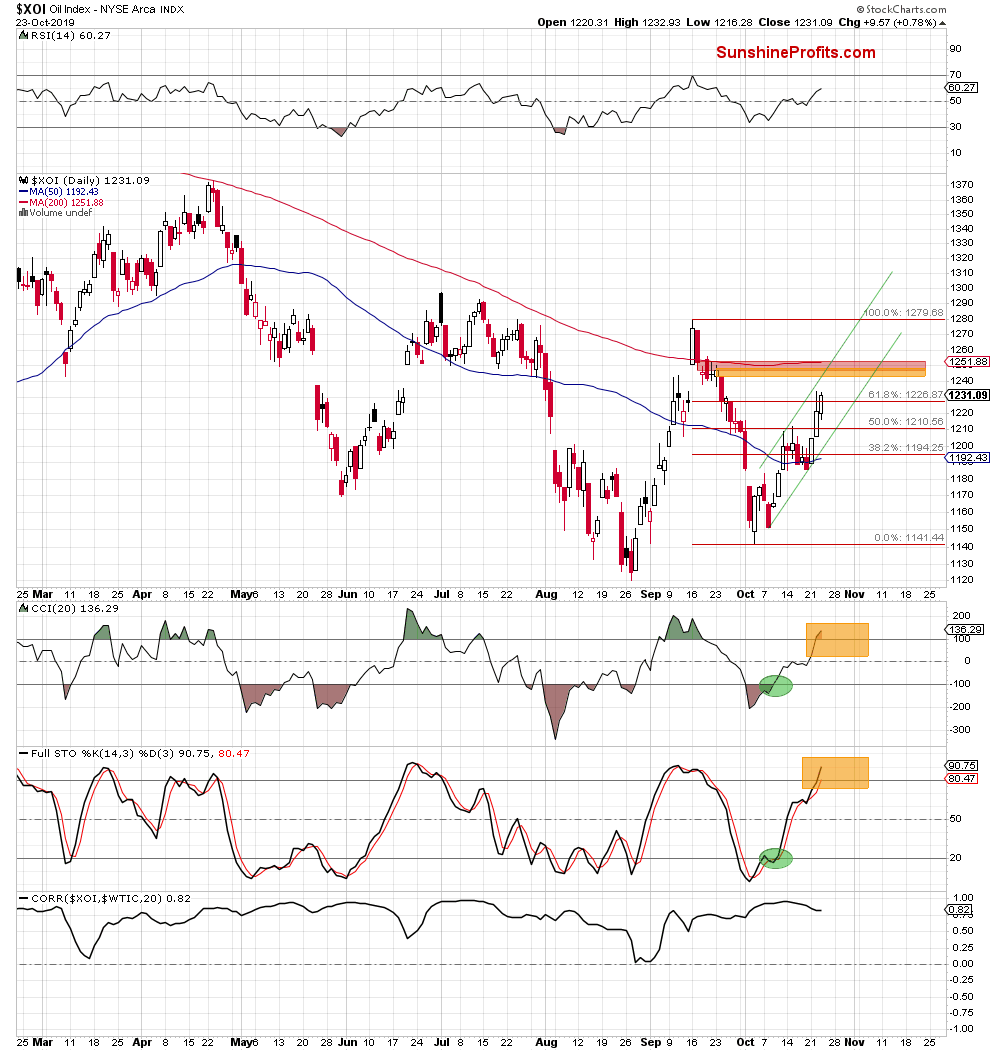
Looking at the daily chart, we see that XOI broke above the 38.2% Fibonacci retracement on October 11, showing more strength compared to crude oil. In the following days, the index consolidated and broke above the next retracement on Tuesday.
XOI then tested the 61.8% Fibonacci retracement too, but the bulls failed and didn't manage to hold gained ground. As a result, the index pulled back, invalidating the earlier breakout that could lead to lower values of stocks.
The sellers' hopes for a pro-decline scenario were broken during yesterday's session when the XOI climbed above the mentioned resistance and closed the day higher, opening the way to next levels.
Is the road north open?
In our opinion, not, because it is blocked by two price gaps that were strong enough to stop the buyers in the previous month (we marked then with red and orange on the above chart). Additionally, in this area we can see the 200-days moving average and the upper border of the green rising trend channel, which serve as the next resistances.
On top of that, we should keep in mind that the CCI and the Stochastic Oscillator moved to their overbought areas, which suggests that reversal could be just around the corner.
What does it mean for crude oil?
Looking at the above chart, we see that the correlation between the index and the commodity decreased in recent days, which points to a bigger strength in the index at the moment. If this relationship sticks, we can expect that XOI will try to close the gap faster than crude oil.
Nevertheless, taking into account the fact that the relationship between oil stocks and black gold is quite strong, we think that reversal in both cases is just a matter of time (a short time, at that). Therefore, should we see bulls' weakness in the above-mentioned areas, we'll likely open short positions. As always, we will keep you informed.
Thank you.
Nadia Simmons
Forex & Oil Trading Strategist

