

-
Is Crude Oil Off Its Lows Now?
March 2, 2020, 10:34 AMOil has taken a beating in recent sessions, leaving many to wonder where the slide stops. But wait, black gold has rebounded on Friday off the daily lows. Is it a harbinger of more to come?
Let's take a closer look at the charts below (charts courtesy of http://stockcharts.com and www.stooq.com ).
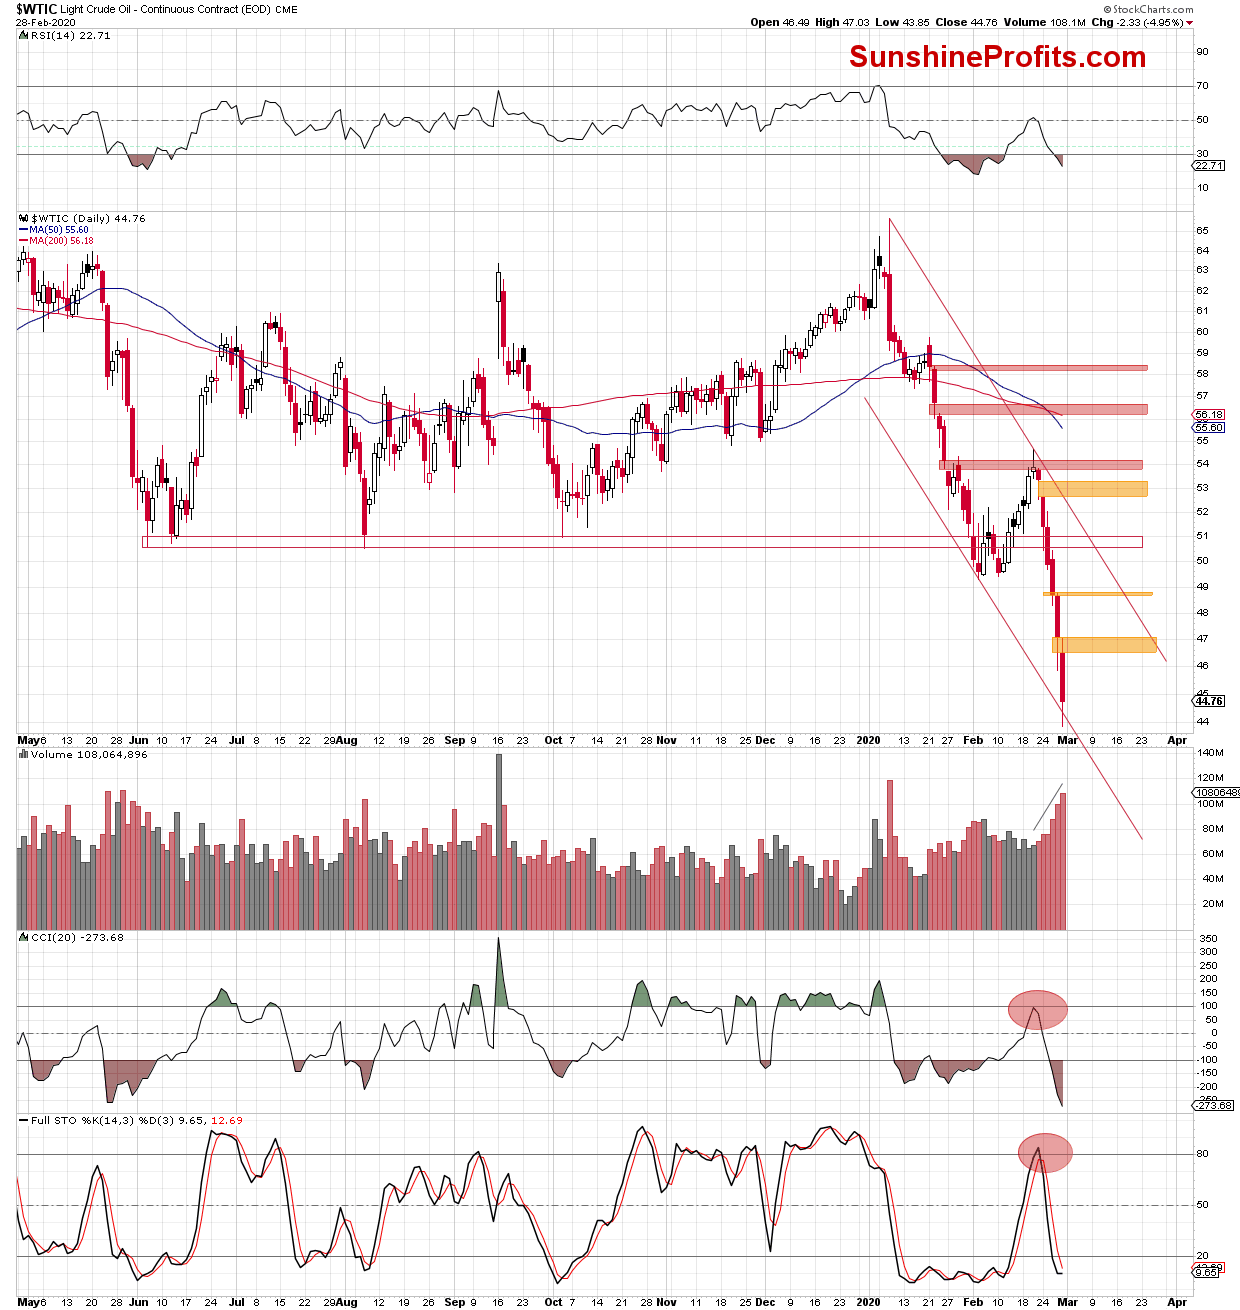
Looking at the daily chart, we see that crude oil opened Friday's session with another bearish orange gap. As the bulls failed to close it, further deterioration followed.
Thanks to this drop, the commodity lost almost 5%, making our short position even more profitable (as a reminder, we opened it when crude oil was trading at about $51.50, so this position is over $6 "in the green").
As you see, Friday's decline took light crude to the lower border of the declining red trend channel. This has triggered a modest rebound before the session close.
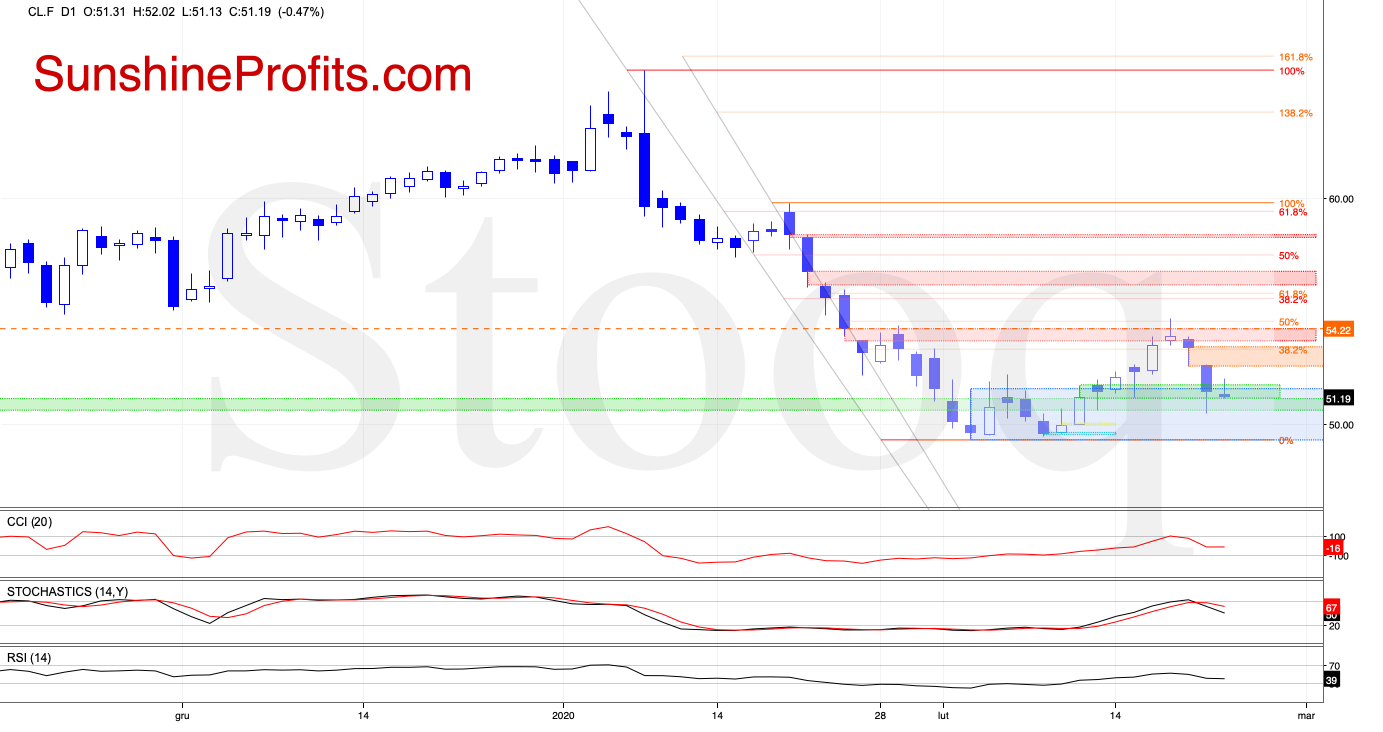
How did this price action reflect in today's crude oil futures?
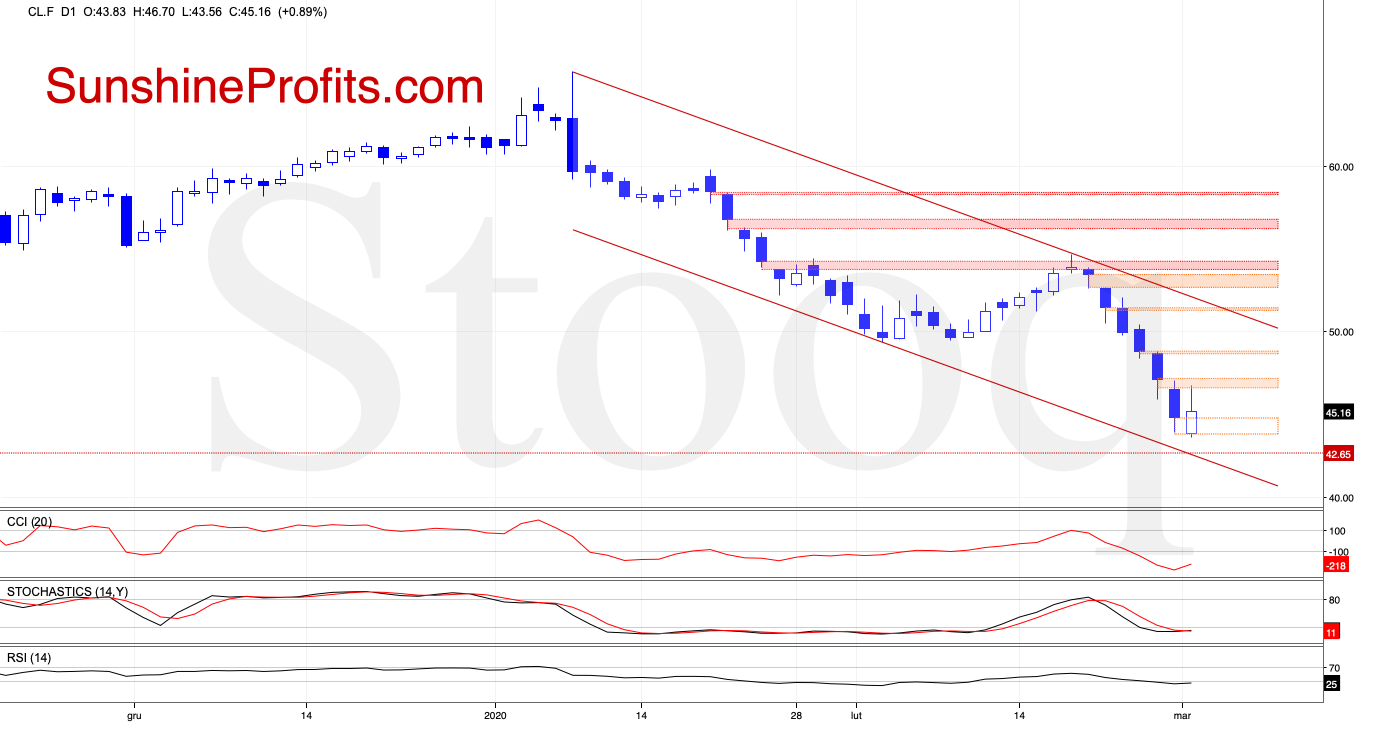
The daily chart above shows that the futures opened the week with another bearish gap. Similarly to what we saw during Friday's session, the bulls pushed prices higher in the following hours, which closed the gap as black gold climbed to the orange gap created at the beginning of Friday.
This is a positive development for the bulls - but only at first glance. The above-mentioned gap stopped the buyers and triggered a pullback. This doesn't bode well for higher values of the futures and crude oil later today.
Additionally, the volume of Friday's session was significant, confirming the bears' strength. This suggests that the decline is not over yet - especially when we factor in the Elliott Waves Theory and the long-term picture below.
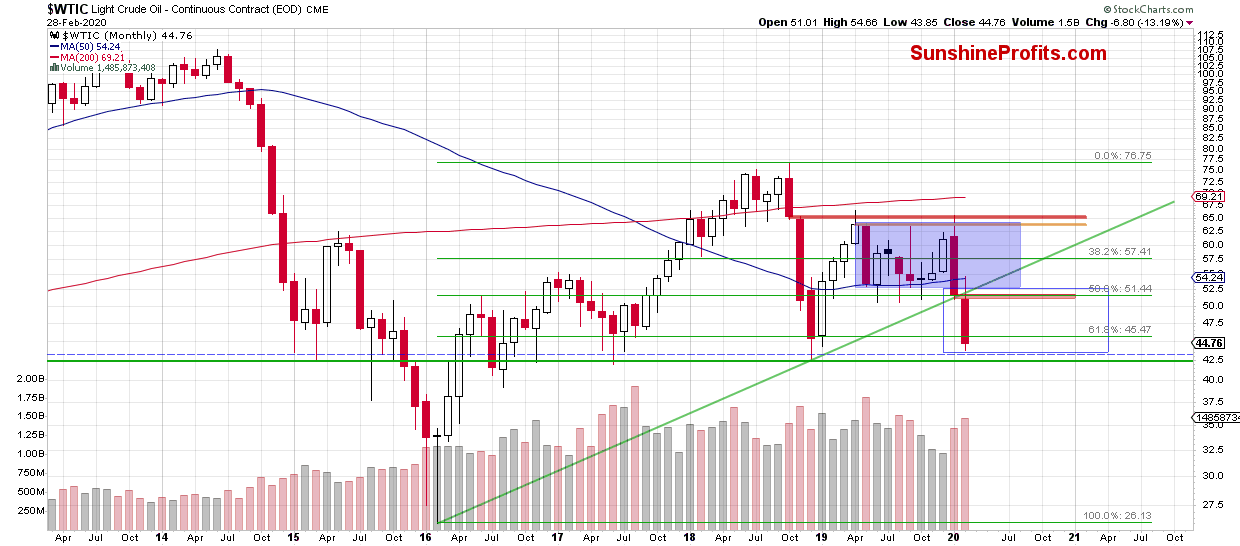
We see that February's downswing took the commodity not only below the long-term green support line, but also below the lower border of the blue consolidation.
What does it mean for the price of black gold?
In our opinion, the commodity could move even lower and drop to around $42.20, where the size of the downward move would correspond to the height of the consolidation. Additionally, there is also the December 2018 low slightly above this level, which increases the likelihood that we'll see a test of this support in the coming week.
Being conservative in terms of money management, we are keeping our profit-take level somewhat above the mentioned price level so as to maximize the odds of exiting the trade before the rebound takes place.
Summing up, it seems that the final bottom for this short-term decline is not yet in, and that we might see even lower crude oil prices in the following days and/or hours.
We encourage you to sign up for our daily newsletter- it's free and if you don't like it, you can unsubscribe with just 2 clicks. If you sign up today, you'll also get 7 days of free access to our premium daily Oil Trading Alerts as well as our other Alerts. Sign up for the free newsletter today!
Thank you.
Nadia Simmons
Day Trading and Oil Trading StrategistPrzemyslaw Radomski, CFA
Editor-in-chief, Gold & Silver Fund Manager -
Crude Oil's Slide to New Lows Once Again
February 28, 2020, 5:50 AMAvailable to premium subscribers only. Our trading positions - while relatively new - are already about $5.50 "in the green".
-
Oil Bulls - Just Where Are They These Days?
February 26, 2020, 10:05 AMAvailable to premium subscribers only.
-
Now, There Are Even More Reasons to Ride Our Profitable Open Position
February 25, 2020, 10:33 AMNot only has crude oil opened with a profound bearish gap, it did slide during most of the session. As part of the intraday losses were reversed before the closing bell, does it offer a glimmer of hope for the bulls?
Let's start with the daily chart examination (charts courtesy of http://stockcharts.com and http://stooq.com ).
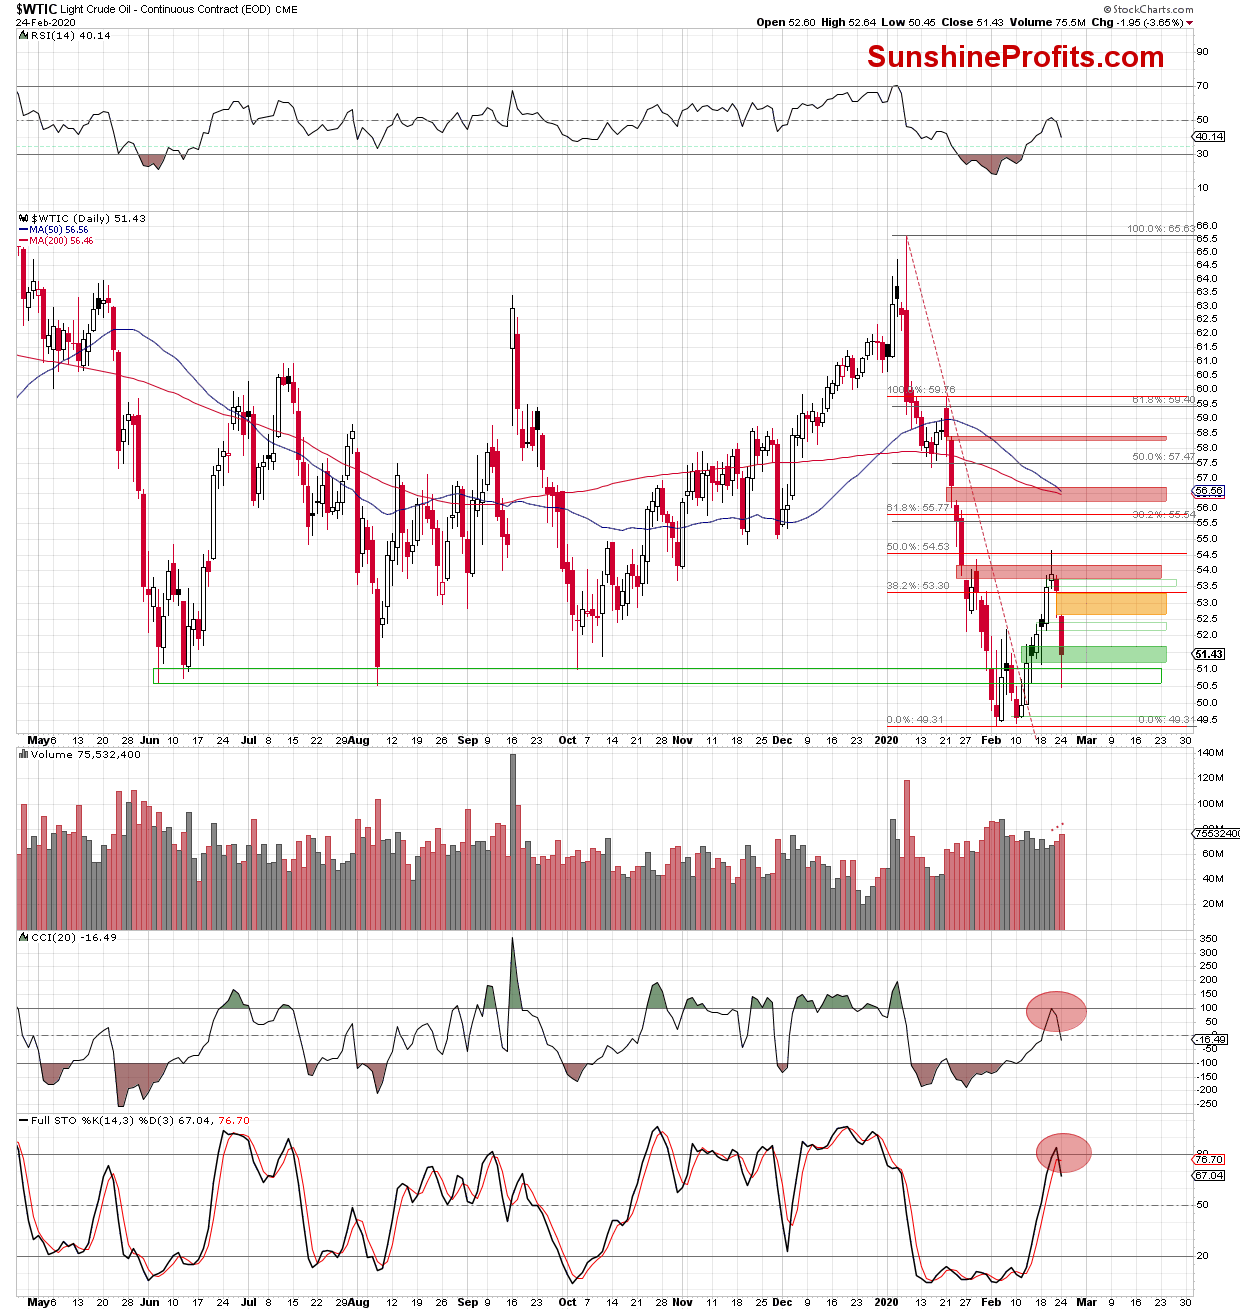
The first thing that catches the eye, is yesterday's notable orange bearish gap. Such a sizable setback for the bulls encouraged the sellers to follow through in the coming hours. As a result of that deterioration, the bullish gap created on January 18 was closed.
Additionally, the CCI and the Stochastic Oscillator generated their sell signals, giving the bears even more reasons to act. The volume of yesterday's decline increased, confirming the sellers' commitment to yesterday's downswing.
How did yesterday's slide affect investors' moods before today's open? The chart below answers that.
Crude oil opened Tuesday with another bearish gap. Coupled with the sell signals generated by the indicators, it means that our yesterday's observations are up-to-date also today:
(...) Will we see further deterioration?
Taking all the above into account and combining it with the sell signals generated by the CCI and the Stochastic Oscillator (in the case of crude oil futures), we think that lower values of the futures and the black gold are just a question of time.
How low could they go?
In our opinion, the first downside target for the sellers will be around $51.39-$51.56. This is where the nearest support area created by the mid-February lows and the 61.8% Fibonacci retracement based on the entire February rebound, is.
However, if this zone is broken, the way to the February lows or even the realization of the bearish scenario about which we wrote in our February 12 Oil Trading Alert, will be likely open:
(...) Additionally, another move to the downside and a fresh 2020 low would be in line with the Elliott Wave Theory.
Summing up, the outlook for crude oil remains bearish and the corrective upswing definitely appears to be over. The bearish gaps and volume examination support more downside to come. The short position remains justified from the risk-reward perspective.
If you enjoyed the above analysis and would like to receive daily premium follow-ups, we encourage you to sign up for our Oil Trading Alerts to also benefit from the trading action we describe - the moment it happens. The full analysis includes more details about our current positions and levels to watch before deciding to open any new ones or where to close existing ones.
Thank you.
Nadia Simmons
Day Trading and Oil Trading StrategistPrzemyslaw Radomski, CFA
Editor-in-chief, Gold & Silver Fund Manager
Free Gold & Oil Newsletter
with details not available
to 99% investors
+ 7 days of Gold Alerts
+ Mining Stock Rankings
Gold Alerts
More-
Status
New 2024 Lows in Miners, New Highs in The USD Index
January 17, 2024, 12:19 PM -
Status
Soaring USD is SO Unsurprising – And SO Full of Implications
January 16, 2024, 8:40 AM -
Status
Rare Opportunity in Rare Earth Minerals?
January 15, 2024, 2:06 PM
Metals charts


