

-
Is This the Start of Oil Price Recovery?
March 11, 2020, 8:11 AMIt can't be denied that the bulls moved prices higher yesterday, but how far have they made it? Does it really change anything, is the short-term outlook any clearer now?
Let's take a closer look at the charts below (charts courtesy of http://stockcharts.com and www.stooq.com ).
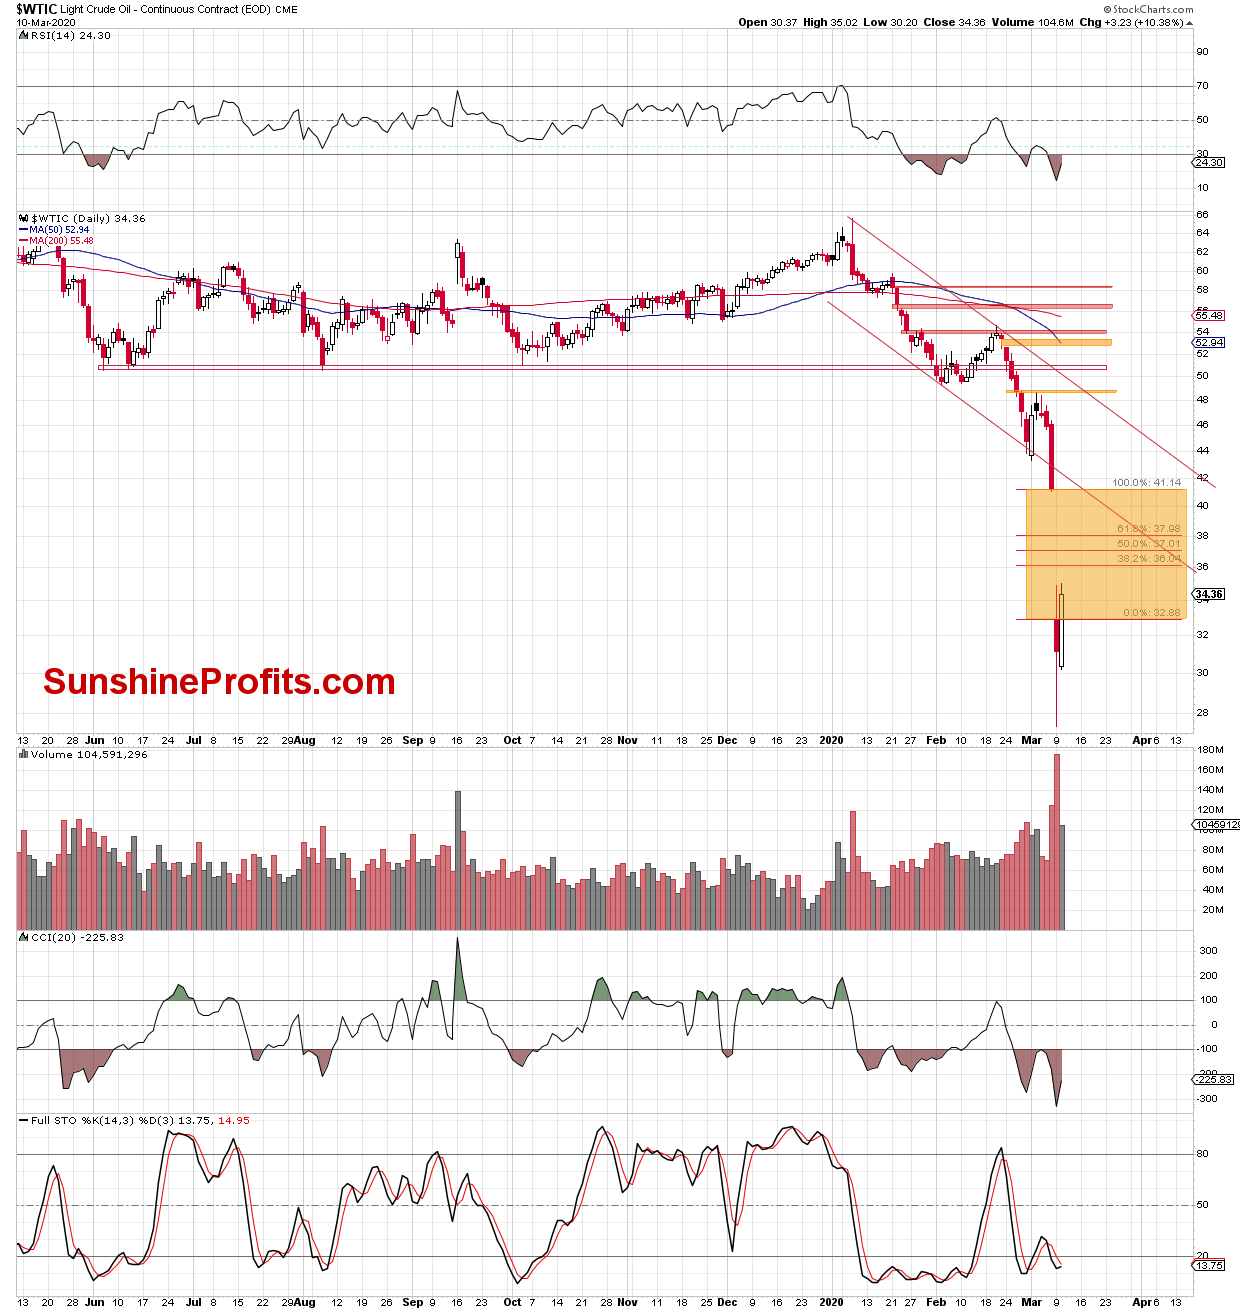
The daily chart reveals that oil moved higher during yesterday's session, erasing over 10% of the recent sharp declines. Despite this increase, the price of black gold didn't close the day above yesterday's high, and is still trading well below the upper border of the huge orange gap created on Monday. Both of these factors don't really confirm the bulls' strength.
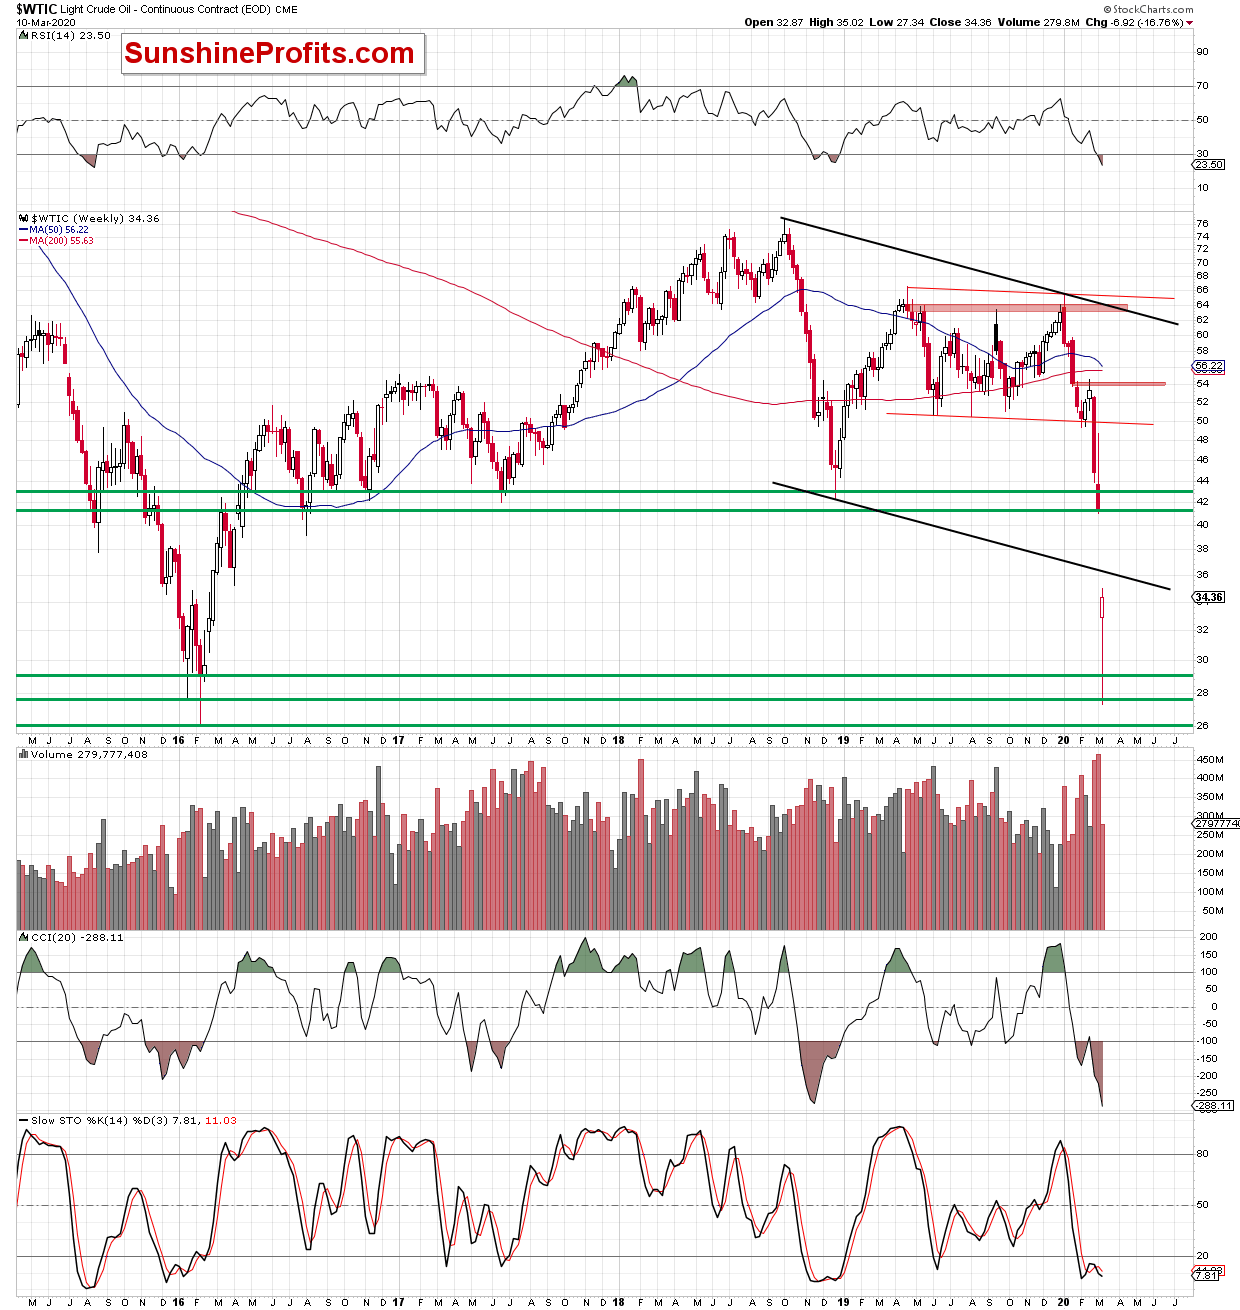
Let's zoom out and examine the weekly picture. Although light crude rebounded in recent days, the commodity still trades below the lower border of the black declining trend channel on the below chart.
How did all these factors affect investors' moods earlier today? Let's check the oil futures chart to find out.
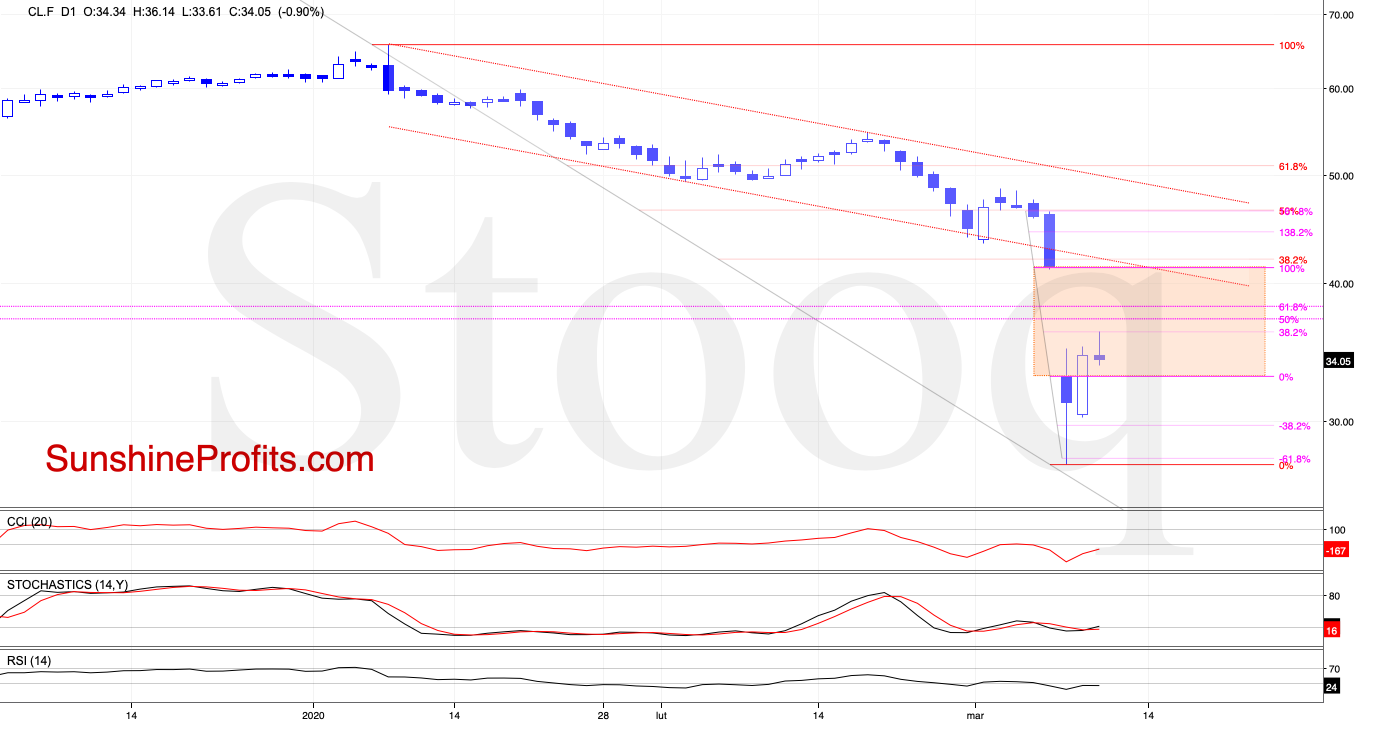
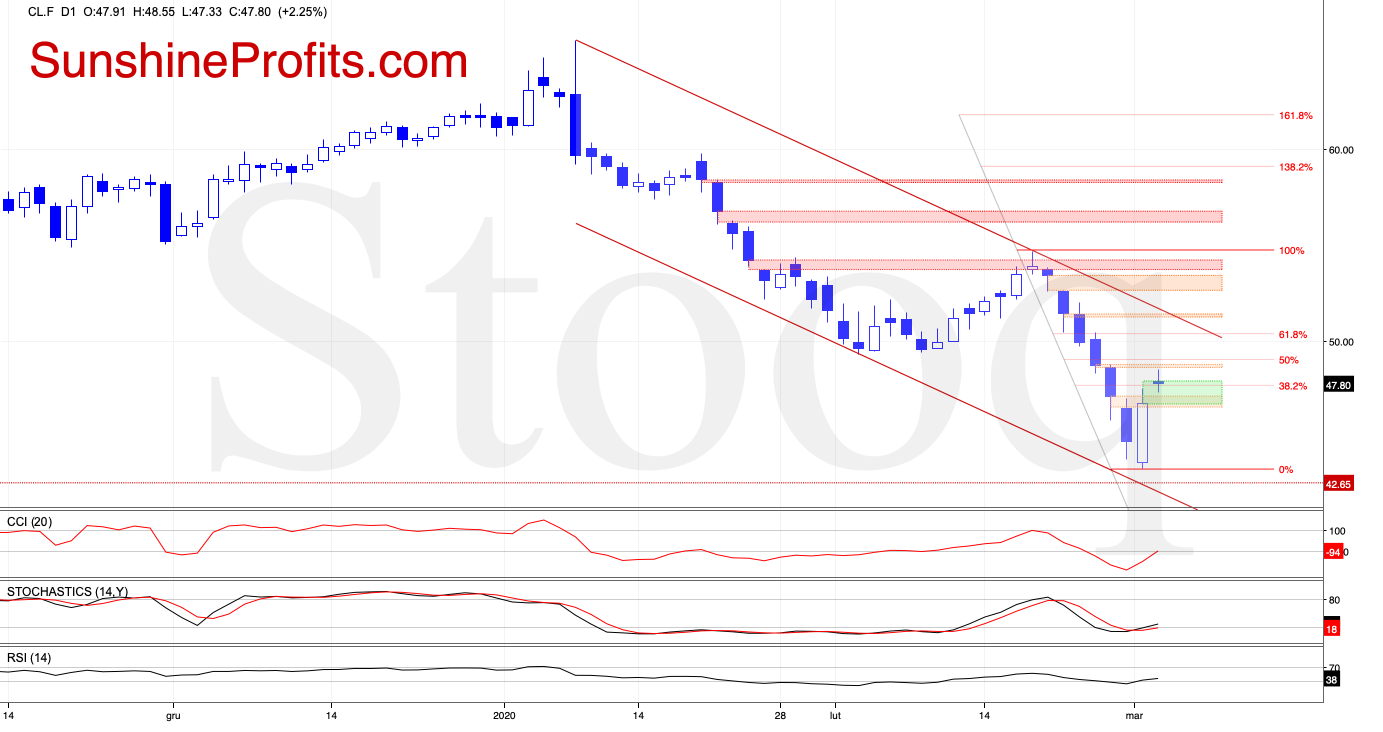
Here, we see that the futures extended gains earlier today and climbed to the 38.2% Fibonacci retracement that is based on the orange resistance gap. As it turned out, this resistance was strong enough to stop the bulls, which triggered a pullback and a comeback to levels around yesterday's close in the following hours.
What does it mean for the futures and the commodity itself?
In our opinion, further deterioration coupled with at least a retest of the psychological level of $30 may be just around the corner. Nevertheless, before we see such price action another attempts to move higher can't be ruled out - especially when we take into account today's EIA report, which could increase volatility in the oil market later in the day.
How high could the futures go if the EIA positively surprise market participants? For example, what if it showed a smaller increase in crude oil stocks compared to yesterday's API report, which said that crude inventories rose by 6.4 million barrels in the week to March 6 to 453 million barrels, missing analysts' expectations for a build of 2.3 million barrels?
We are of the opinion that the quote from our yesterday's Alert will be the best answer to this question:
(...) the buyers may try to push the futures higher.
Should we see such price action, we can expect a dead cat bounce pattern - a small, short-lived recovery in the price, which could take crude oil futures to the 50% ($37.09) or even the 61.8% ($38.07) Fibonacci retracement (based on the gap range) in the following day(s). At this point, it is also worth noting that the greater the decline, the greater the rebound we can expect, which means that an attempt to close the orange gap cannot be ruled out.
Nevertheless, if today's report confirms a bigger-than-expected increase in black gold inventories with simultaneously disappointing data on gasoline and distillate stocks, the bearish scenario will be likely in play.
Summing up, the situation continues to be too unclear to justify any trading positions at this time. The profits that we took off the table recently were huge, but given this kind of volatility, it might be easy to erase them if one is not careful. And we care about your capital too much to put it at risk during unclear times, and that means that capital preservation rules right now. Naturally, we'll keep you informed should the outlook clarify.
If you enjoyed the above analysis and would like to receive daily premium follow-ups, we encourage you to sign up for our Oil Trading Alerts to also benefit from the trading action we describe - the moment it happens. The full analysis includes more details about our current positions and levels to watch before deciding to open any new ones or where to close existing ones.
Thank you.
Nadia Simmons
Day Trading and Oil Trading StrategistPrzemyslaw Radomski, CFA
Editor-in-chief, Gold & Silver Fund Manager -
The Great Oil Plunge We Made Money On
March 10, 2020, 12:55 PMAvailable to premium subscribers only.
-
Oil and the Surprise Fed Rate Cut
March 4, 2020, 7:45 AMDespite the surprise Fed rate cut announcement, crude oil sold off later on. Yet it's rallying as we speak. What's in store for black gold in the days ahead?
Let's take a closer look at the charts below (charts courtesy of http://stockcharts.com and www.stooq.com ).
Both the above charts reveal that the overall situation in either the short or very short term hasn't changed much as crude oil and its futures keep trading below both the orange gap created on February 27 and the 50% Fibonacci retracement.
Therefore, our yesterday's Oil Trading Alert is up-to-date also today.
Summing up, it seems that the final bottom for this short-term decline is not yet in, and that we might see even lower crude oil prices in the following days and/or hours.
We encourage you to sign up for our daily newsletter- it's free and if you don't like it, you can unsubscribe with just 2 clicks. If you sign up today, you'll also get 7 days of free access to our premium daily Oil Trading Alerts as well as our other Alerts. Sign up for the free newsletter today!
Thank you.
Nadia Simmons
Day Trading and Oil Trading StrategistPrzemyslaw Radomski, CFA
Editor-in-chief, Gold & Silver Fund Manager -
Is Oil Firmly on the Upswing Now?
March 3, 2020, 10:01 AMOil has scored strong gains yesterday, and that could carry over into today's session perhaps as well. How likely is that to turn out true?
Let's take a closer look at the charts below (charts courtesy of http://stockcharts.com and www.stooq.com ).
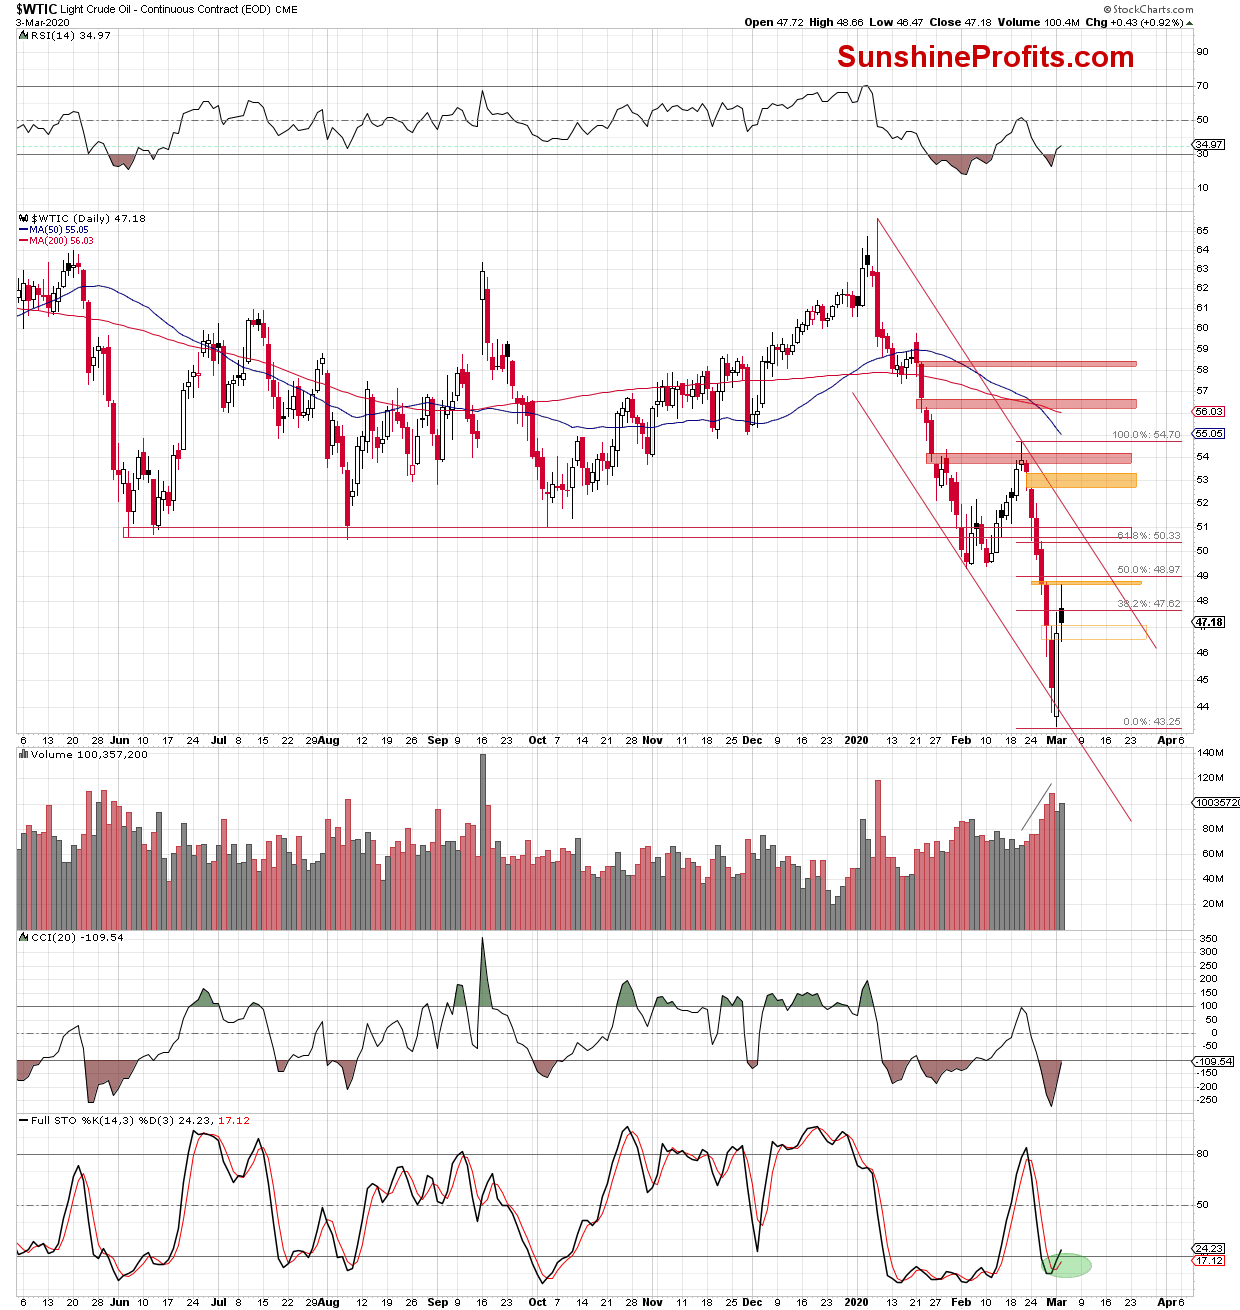
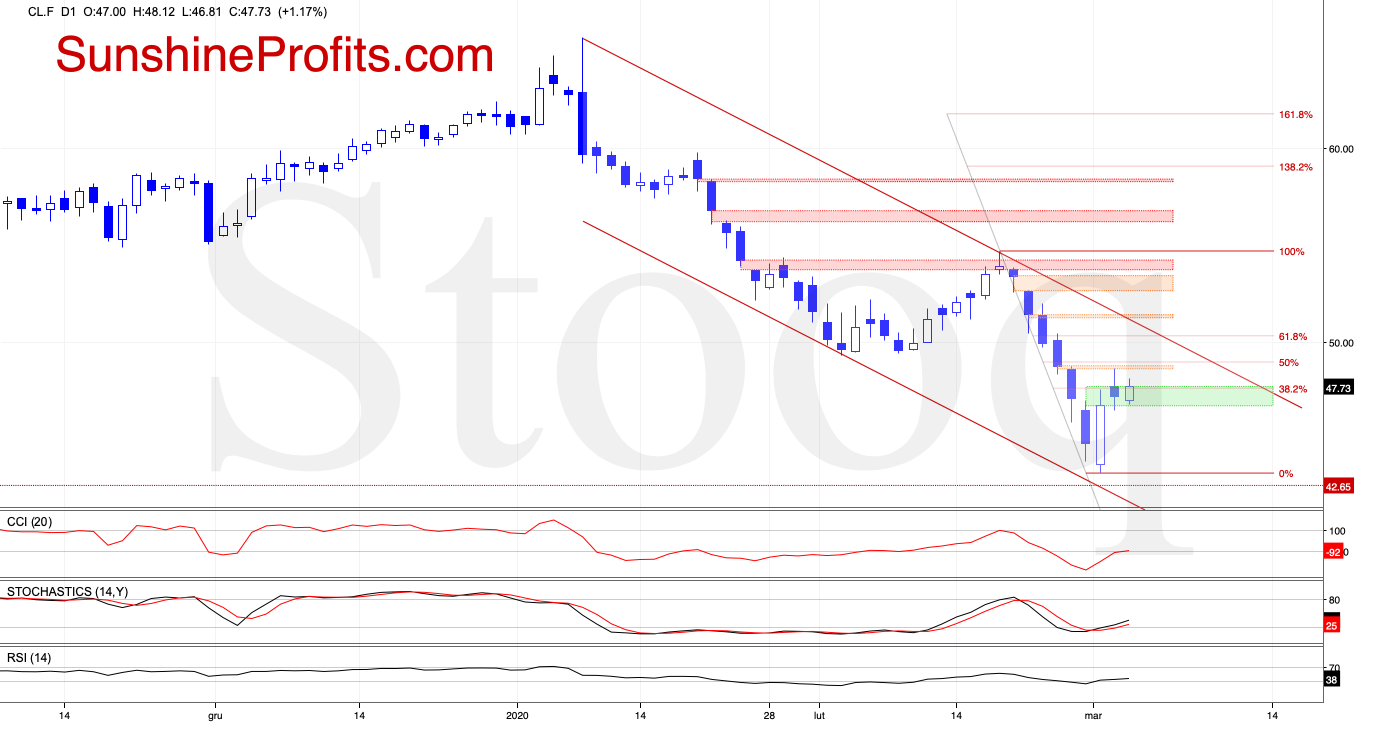
The daily chart shows that although crude oil opened Monday's session below the lower border of the declining red trend channel, the bulls stepped in. As prices moved higher, the earlier breakdown was invalidated.
This positive development triggered further improvement in the following hours, and the first orange gap was tested. Thanks to yesterday's upswing, black gold also reached the 38.2% Fibonacci retracement based on the February 20- March 2 downward move.
As you can see on the above chart, the combination of these two resistances stopped the buyers and translated into a pullback before the closing bell. In this way, the bulls failed to close the gap. Coupled with the above-mentioned retracement, the gap thus continues to serve as the nearest resistance.
Additionally, we should keep in mind that yesterday's white candlestick materialized on smaller volume than the red candles that we saw in the previous week. This suggests that the bulls may be still weaker than their opponents.
On the other hand, the Stochastic Oscillator flashed its buy signal, further supporting the bulls. How did they use this advantage before today's market open?
Let's take a look at the crude oil futures to find out.
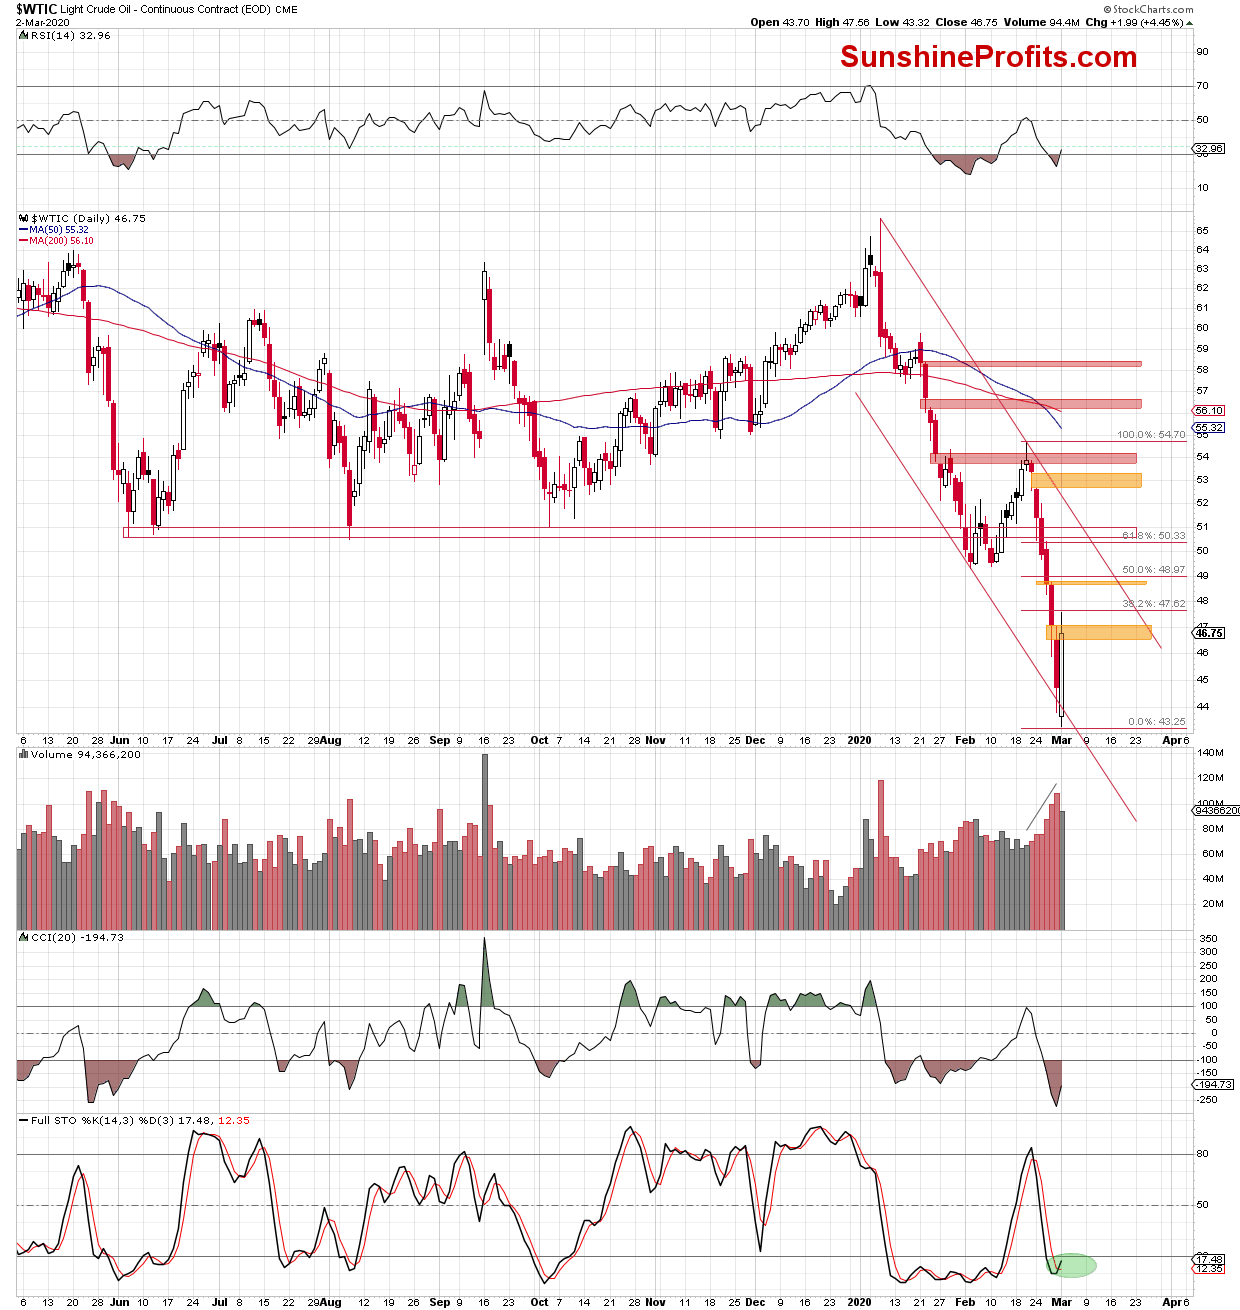
As we can see, the futures opened with a green gap, which triggered further improvement in the following hours. Despite this upswing, prices remain below the nearest orange gap and the 50% Fibonacci retracement, which serve as the nearby resistances.
As long as they remain on the cards, the way to the upper border of the declining red trend channel is closed, and a reversal in the very near future should not surprise us.
If this is the case and the futures and black gold turn south, we could see not only a test of yesterday's low, but also a fresh 2020 low.
How low could the commodity and its futures go?
We think that the best answer lies in the quote from our yesterday's Alert:
(...) In our opinion, the commodity could move even lower and drop to around $42.20 (...) Additionally, there is also the December 2018 low slightly above this level, which increases the likelihood that we'll see a test of this support in the coming week.
Summing up, it seems that the final bottom for this short-term decline is not yet in, and that we might see even lower crude oil prices in the following days and/or hours.
We encourage you to sign up for our daily newsletter- it's free and if you don't like it, you can unsubscribe with just 2 clicks. If you sign up today, you'll also get 7 days of free access to our premium daily Oil Trading Alerts as well as our other Alerts. Sign up for the free newsletter today!
Thank you.
Nadia Simmons
Day Trading and Oil Trading StrategistPrzemyslaw Radomski, CFA
Editor-in-chief, Gold & Silver Fund Manager
Free Gold & Oil Newsletter
with details not available
to 99% investors
+ 7 days of Gold Alerts
+ Mining Stock Rankings
Gold Alerts
More-
Status
New 2024 Lows in Miners, New Highs in The USD Index
January 17, 2024, 12:19 PM -
Status
Soaring USD is SO Unsurprising – And SO Full of Implications
January 16, 2024, 8:40 AM -
Status
Rare Opportunity in Rare Earth Minerals?
January 15, 2024, 2:06 PM
Metals charts


