
tools spotlight

-
Since the Momentary GDXJ Bounce Wasn’t Bullish, What Awaits Gold Stocks?
September 27, 2022, 8:21 AMAlthough small corrections in the gold and silver markets do happen, they will not cover up the bearish outlook for them, especially junior miners.
As you read in yesterday’s analysis, the massive decline in the precious metals sector (especially in junior mining stocks) is here. After reading it, your profits on the short position in junior miners increased once again – congratulations!
At the moment of writing these words, gold is after/during a small correction, which is completely normal. Just because the market is likely to move somewhere it doesn’t mean that it’s likely to move there immediately. Wherever it moves, there will likely be corrections along the way, even if we just see them on an intraday basis.
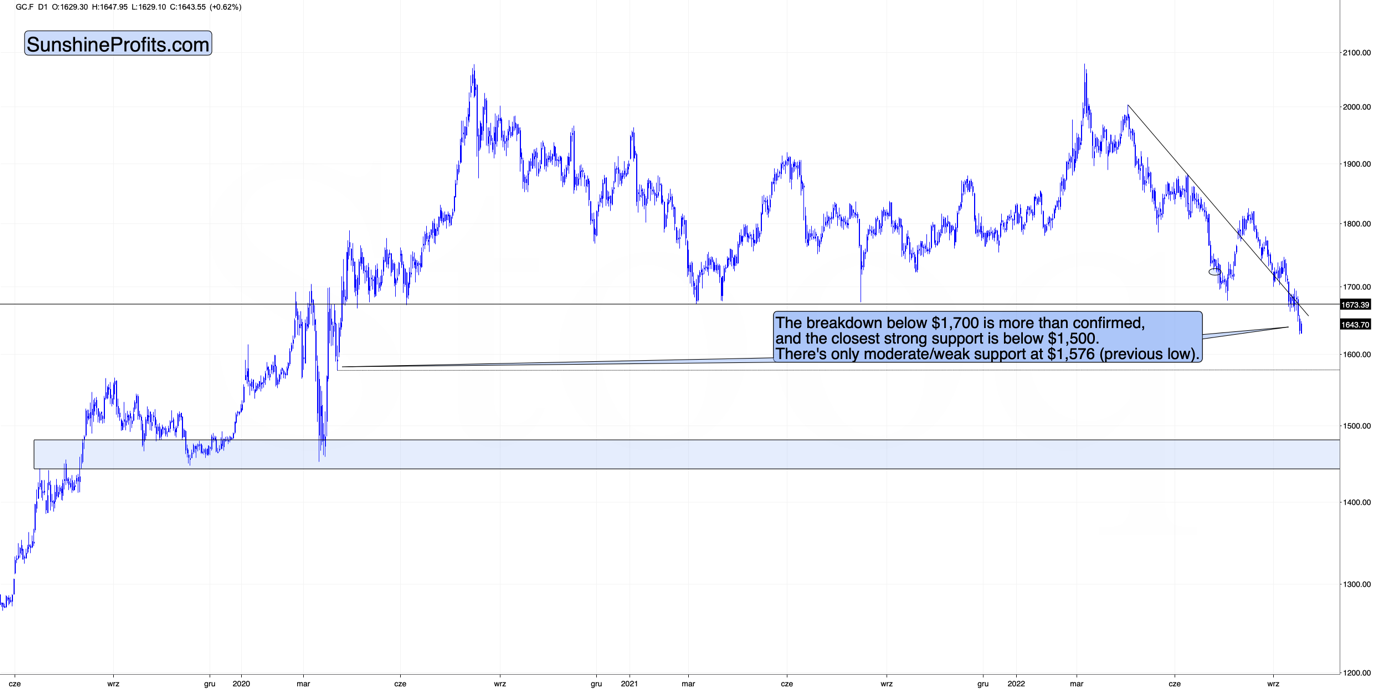
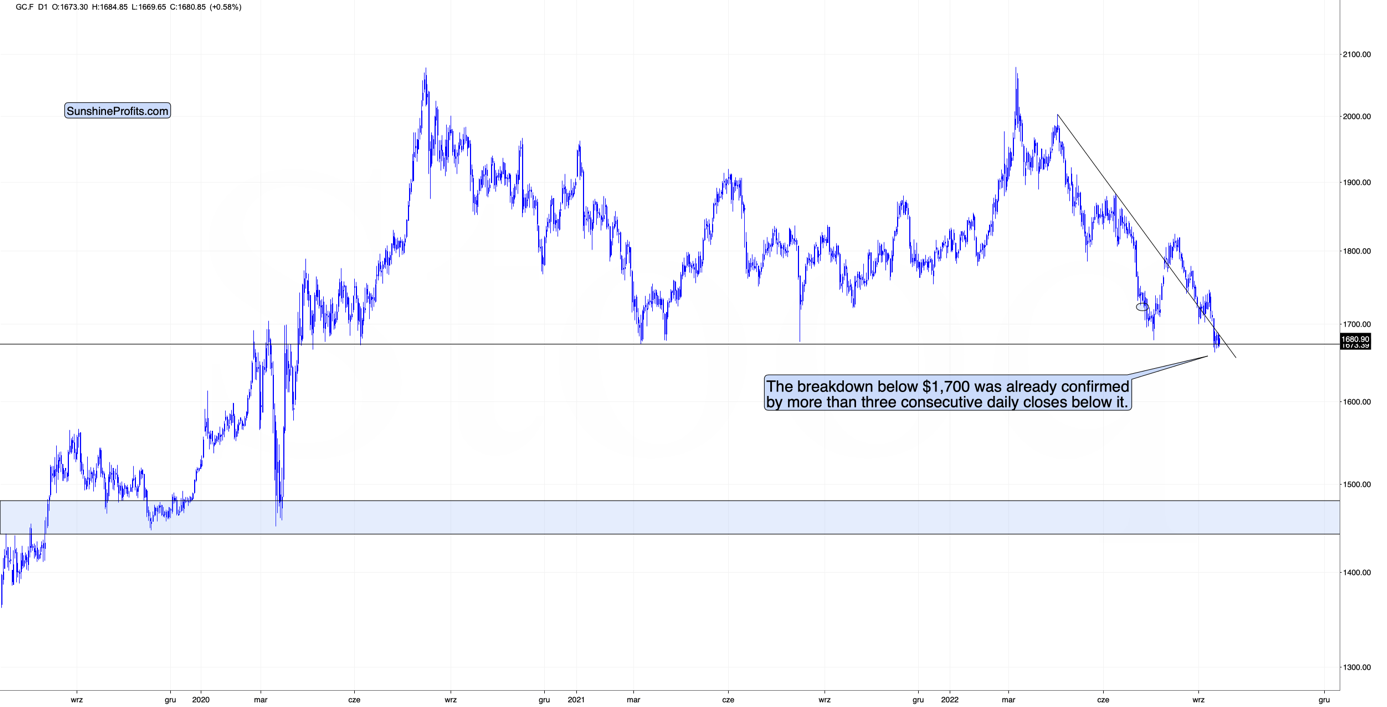
Gold is after a clear and confirmed breakdown below $1,700 – something that it hasn’t been able to do for many months. The above-mentioned level was a very strong support as it worked multiple times (also as resistance).
Because this strong support was broken and the breakdown was verified, it tells us that the force of the bears is even stronger! This, in turn, means that gold is unlikely to decline just a little now.
No.
It’s likely to slide.
There’s practically no strong support until gold’s price declines below $1,500. Since gold futures are trading at about $1,643 at the moment of writing these words, it seems that gold has a lot of room to decline in the near future.
Now, the above doesn’t mean that gold “has to decline immediately, every single day”. There might be small corrections along the way.
So what’s the point of writing about the strong support being so far, if there could be corrections earlier, anyway?
Because those small corrections are too small to be tradable in my opinion. They can – in my view – simply be ignored. I want you to know that a tiny rebound doesn’t invalidate the entire concept of this huge decline.
There is moderate/weak support at about $1,576 (the previous low), but I doubt that it would trigger a move that’s meaningful enough for us to care about it. If stocks move to an important support at that time, or the USD Index moves to an important resistance, then I might consider making adjustments to the very short-term outlook (and the trading position), but it seems unlikely at this point.
What appears likely is a move a bit below $1,500 and a rebound from there.
So, yes, I continue to expect gold’s next important bottom to form close to its 2020 low.
There’s a very good reason not to try to time every possible correction right now – the analogy to 2013 that’s been so useful in recent weeks and months.
The Sep. 2012 – Mar. 2013 decline seems analogous to the Apr. 2022 – Jul. 2022 decline.
The Mar. 2013 rally appears analogous to the Jul. – Aug. 2022 rally.
And the early Apr. 2013 rally seems analogous to the Sep. 2022 rally.
Moreover, I wrote about this link earlier this month. Quoting my Sep. 13, 2022 Gold & Silver Trading Alert:
What about junior mining stocks?
They moved higher as they were practically forced to by rallying gold, but please note that they ended the day only 2% higher, which is very little compared to silver’s almost 6% rally.
Plus, please note that junior miners reversed some of their earlier gains before the end of the session.
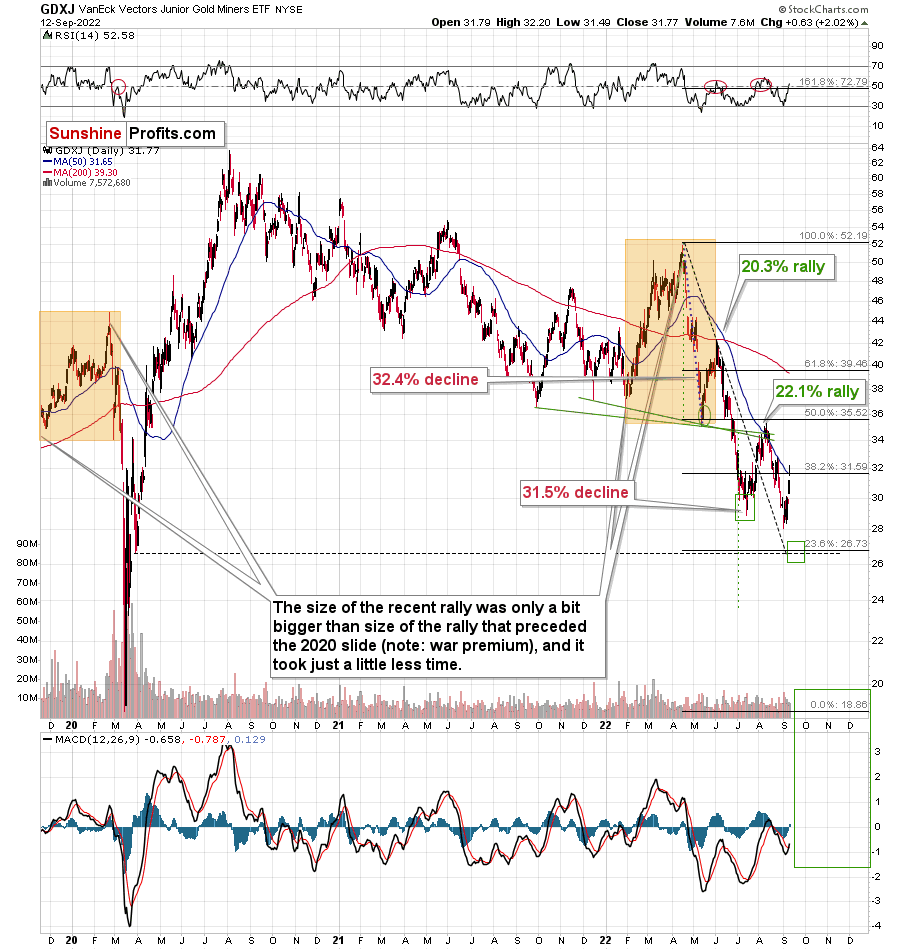
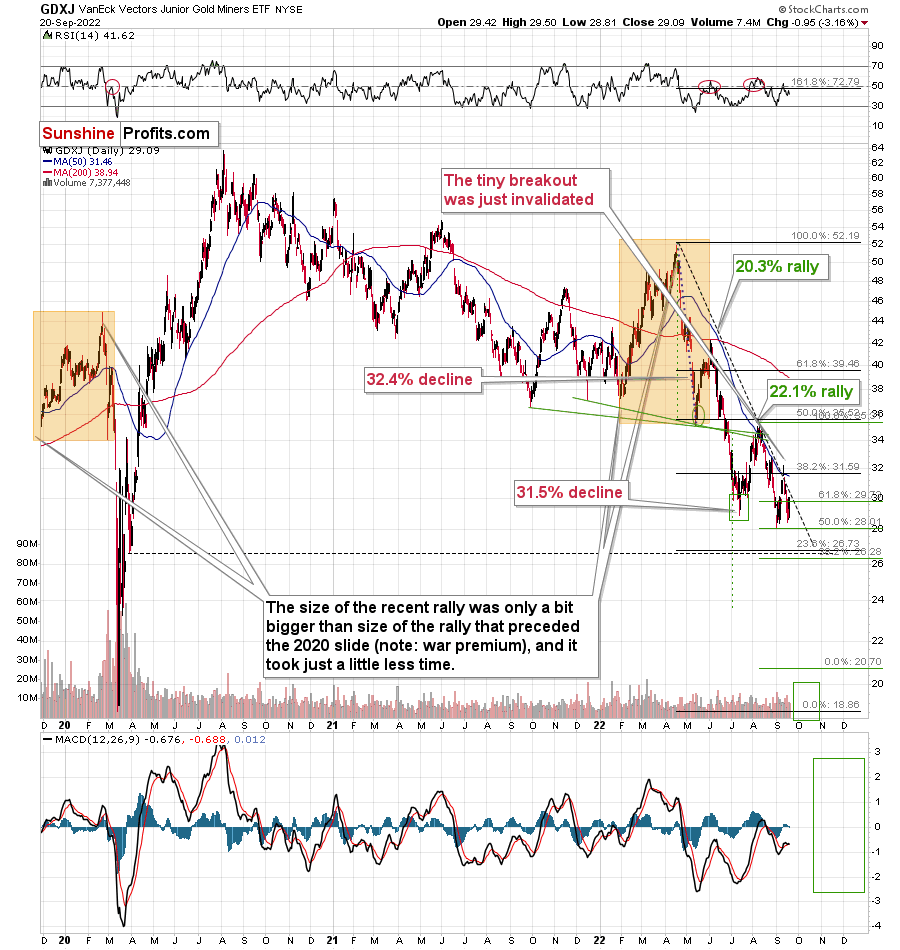
Interestingly, the GDXJ just approached its 50-day moving average, which means the end of previous counter-trend rallies ever since the April 2022 top.
This ~$4 rally fits the final counter-trend rally that we saw in 2013.
The GDXJ rallied by about 14.7% from its recent low.
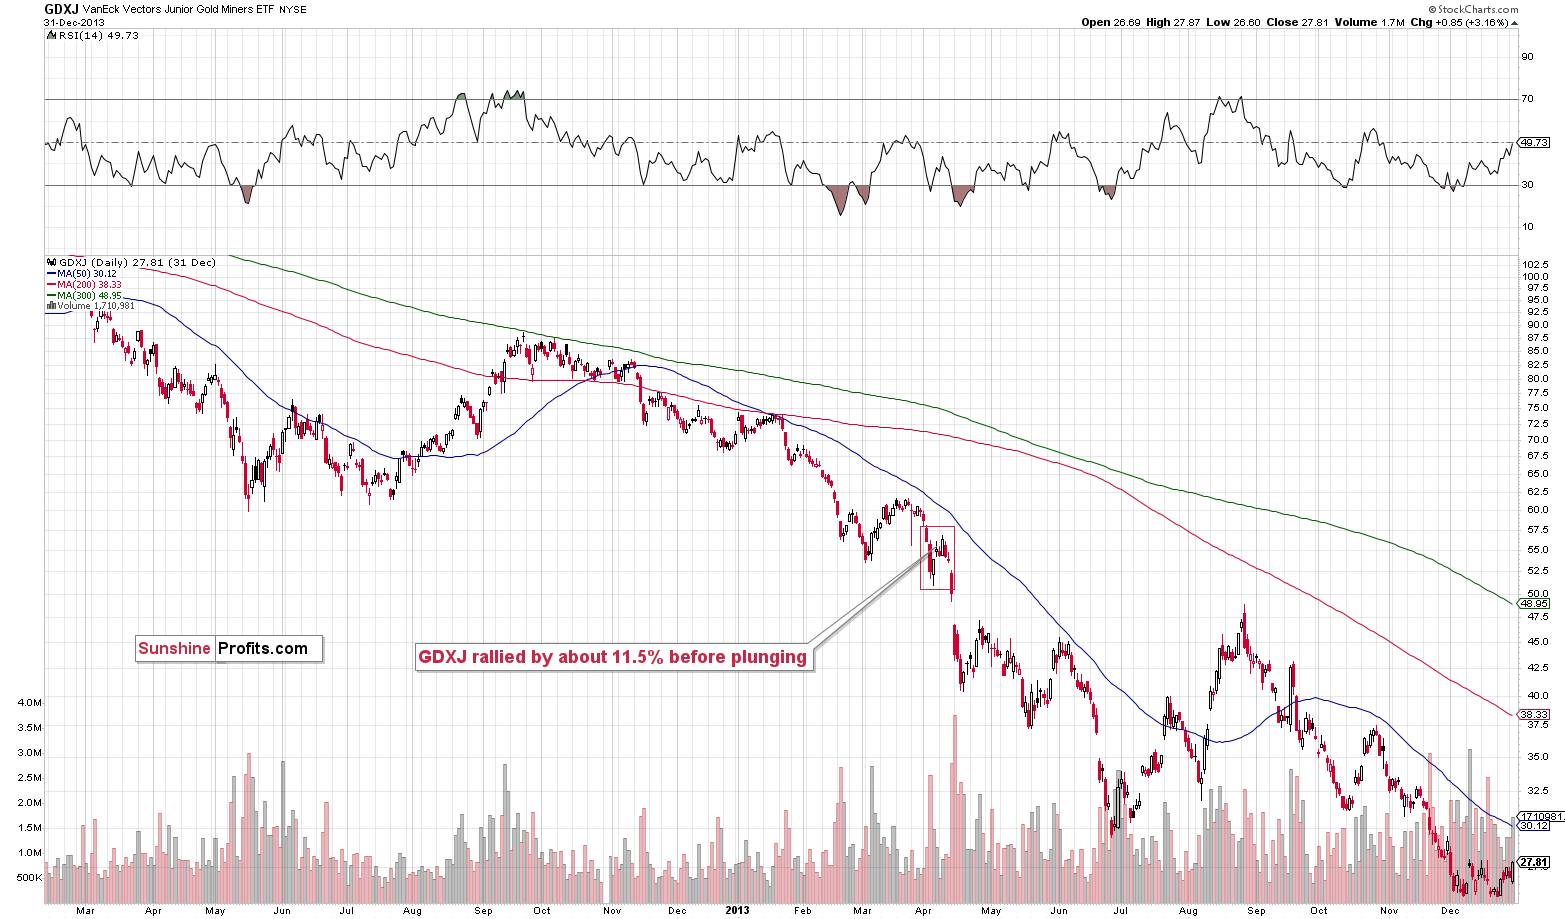
Back in 2013, the GDXJ rallied by about 11.5% before plunging.
This time, the corrective rally is bigger, but please note that the decline that we saw beforehand was sharper than what we saw in 2013. Consequently, a bigger bounce is normal.
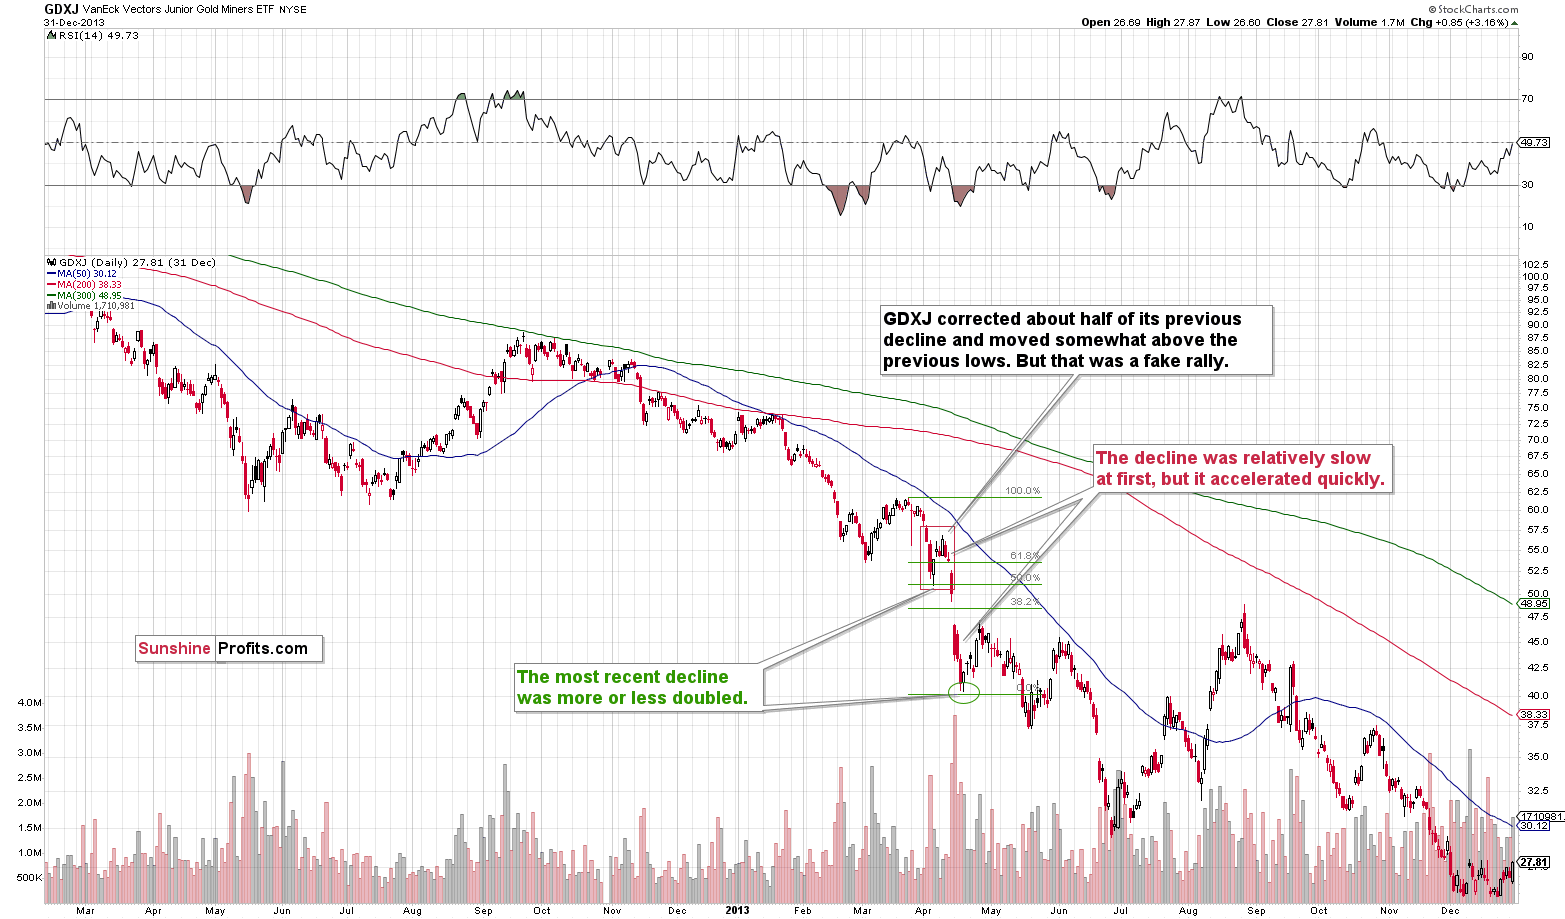
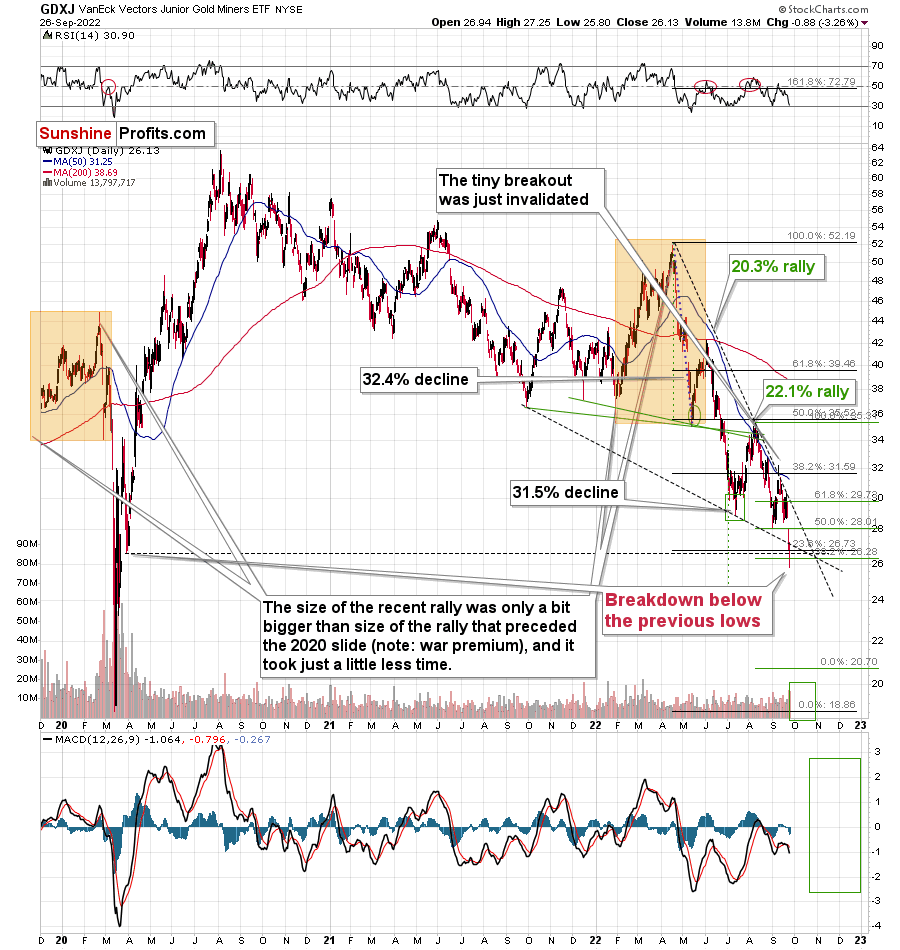
It’s even more interesting to compare the rally to the previous price movement. In both bases, the GDXJ corrected about half of the preceding short-term rally, and it moved above the most recent short-term low. This is exactly what we saw recently.
This is yet another indication that what we’re seeing right now is a part of a bigger pattern that’s very bearish.
One might focus on the last few days on a stand-alone basis and claim that “the rally is bullish,” but in my opinion, this narrow focus might be very costly.
Indeed, the GDXJ declined shortly thereafter.
What does it mean? It means that if the analogy is to continue (and it’s likely), then we are now likely to see a big decline without visible corrections. That’s how GDXJ declined back in April 2013.
As the GDXJ doubled its initial decline in 2013, it’s quite likely to do something similar again this time. I marked this with green lines, and this technique currently points to a target below $21.
Yes, in my view, the GDXJ has some sizable decline ahead of it, and (also, just my opinion), a very profitable one, too – at least to those who are positioned correctly.
Thank you for reading our free analysis today. Please note that the above is just a small fraction of the full analyses that our subscribers enjoy on a regular basis. They include multiple premium details such as the interim targets for gold and mining stocks that could be reached in the next few weeks. We invite you to subscribe now and read today’s issue right away.
Sincerely,
Przemyslaw Radomski, CFA
Founder, Editor-in-chief -
Gold Waved the White Flag and Began Its Great Decline
September 26, 2022, 9:39 AMIt’s happening! The massive upswing in the USD Index and the slide in the precious metals market are here.
As predicted, the dollar grows stronger while gold goes in the opposite direction. Can we expect a temporary correction next?
Just like you knew in advance. I’m receiving multiple messages where you’re sharing your gratitude with me, and I’m extremely happy that you’re enjoying the results that you were able to get thanks to my help.All right, what’s next?
First of all, I would like you to keep perspective.
The huge slide that we saw on Friday is most likely just a first step lower. A big step, but just the first one, nonetheless.
Here’s how the situation looks from a long-term point of view.
The Big Picture
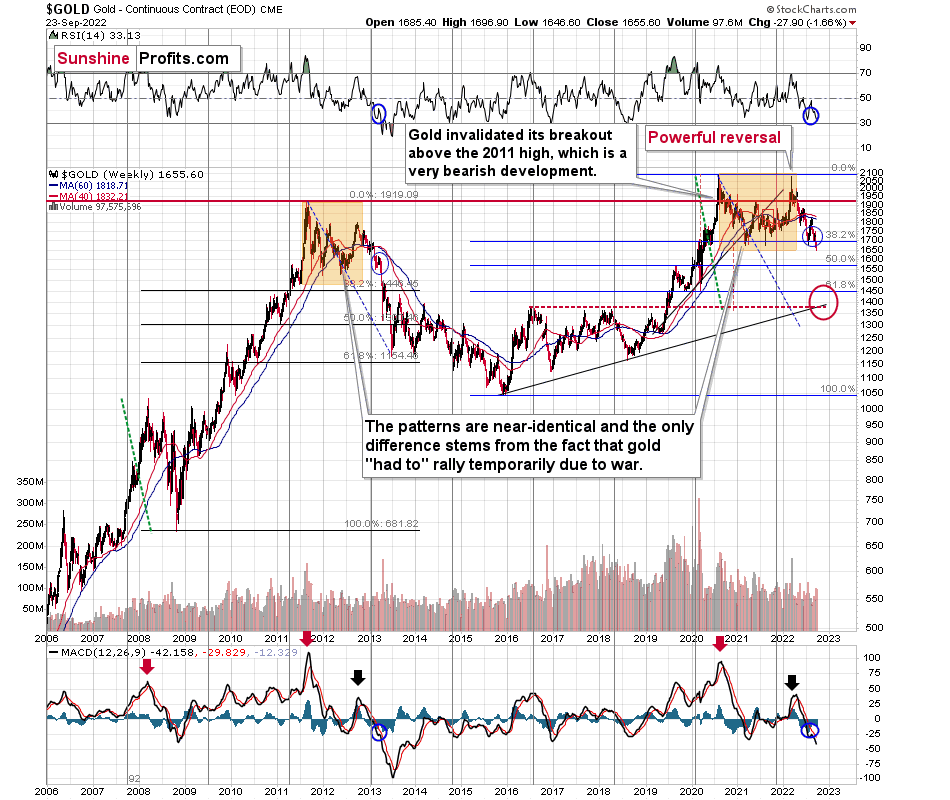
Gold is below its previous lows but not significantly so. Neither the RSI nor MACD indicators suggest that the decline is over – based on the analogy to 2013 that I described more thoroughly on Friday (and in many previous analyses – you knew about this analogy’s existence for months).
Here’s what the situation looks like in the case of the HUI Index – a proxy for gold stocks.
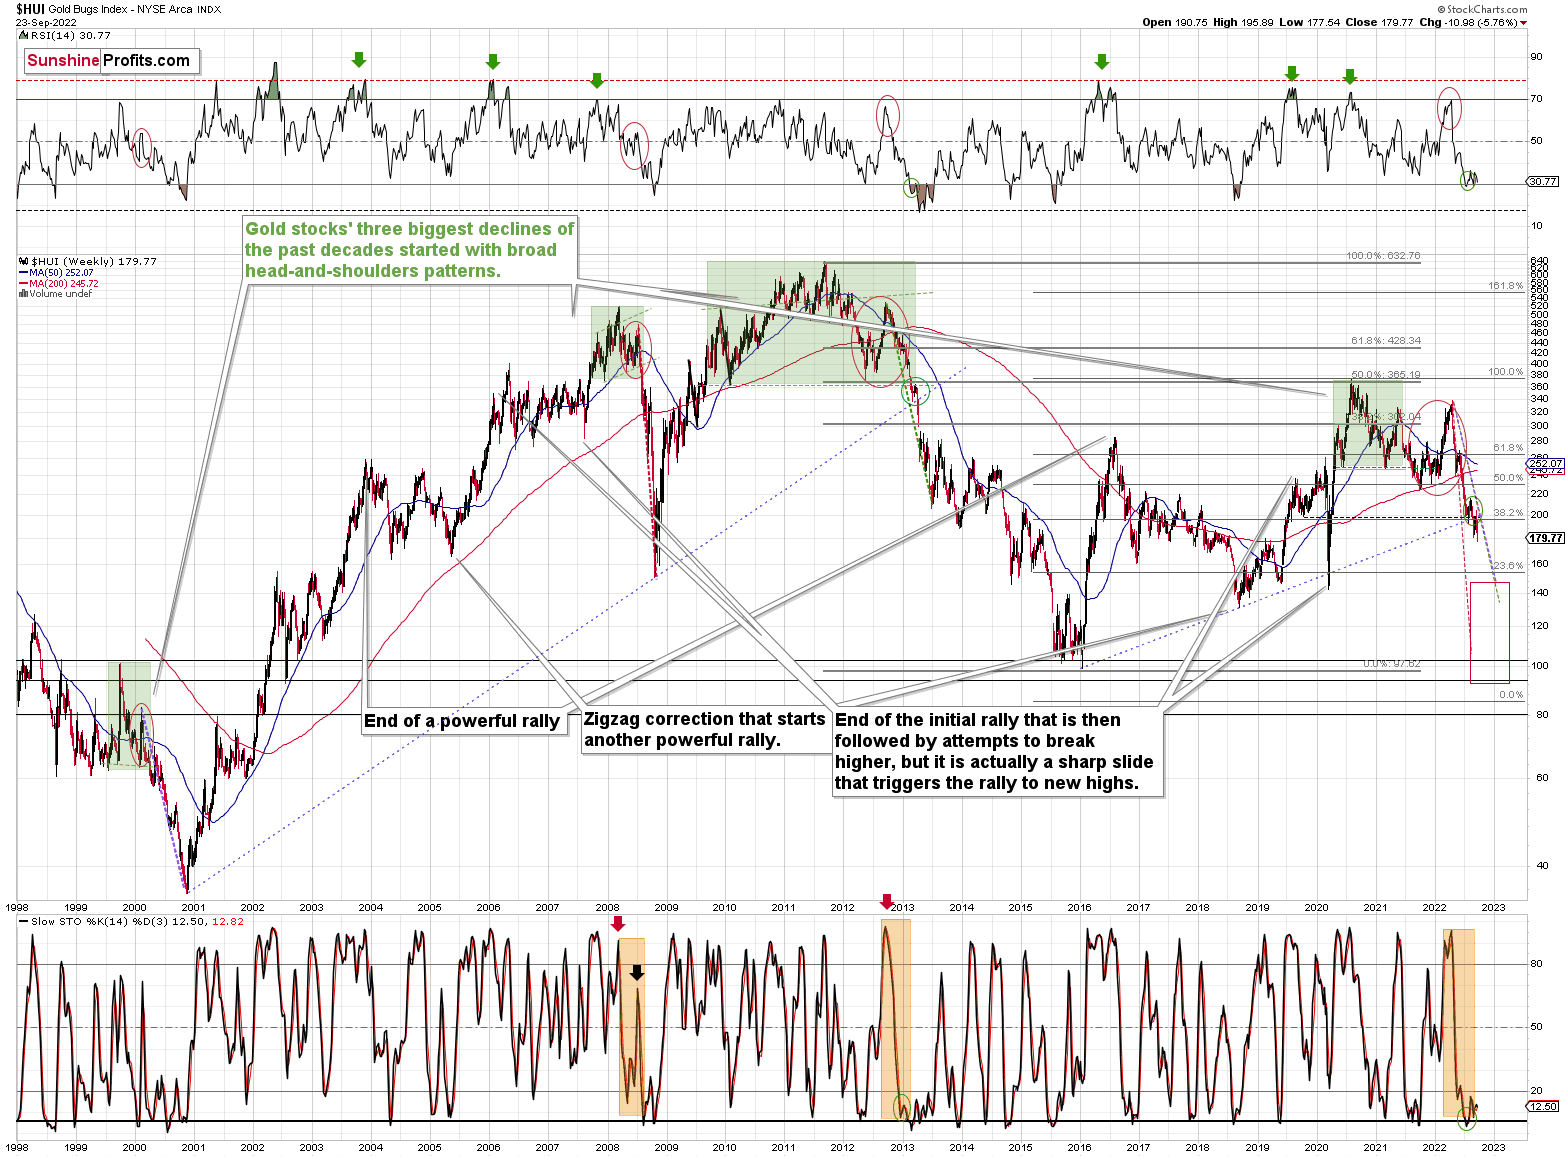
After the breakdown below the long-term support line (based on the 2016 and 2020 bottoms), gold stocks consolidated a bit. This means that the breakdown was verified. This, in turn, opened the door wide open for more significant declines.
Therefore, the fact that miners just declined significantly on Friday – and moved to new yearly lows – is not surprising. It’s a perfectly normal consequence of the breakdown, and something that’s in perfect tune with the analogy to 2013 (and to a smaller extent with the analogy to 2008).
As we zoom in, you can see how big Friday’s daily decline really was.
The Little-Huge Detail

Will we get a temporary correction from the current levels?
We might, or we might not. I previously planned to take profits at – more or less – current price levels, but I dropped this idea based on the fact that we’ve already seen two corrective upswings from below $30 in the GDXJ.
Without those two previous corrections, seeing a correction now would have been very likely. However, they did happen, so now it’s relatively unclear if we’re going to see a corrective bounce or not.
There’s an old Wall St. saying “when in doubt, stay out,” but what most people miss about this saying is that it makes sense as long as one is thinking about a single time-frame. In this case, it is the very short-term outlook that is unclear (next several days or so), and as a consequence, I’m not participating in a very short-term trade.
However, the short-term / medium-term oriented trade – the one that’s based on the likely biggest part of the current decline in the precious metals market is very likely to continue. Consequently, I’m remaining on the short side of the precious metals market, and even if we see a corrective upswing here, I won’t mind that.
Not every correction / price move is worth trading – only those with very favorable risk-to-reward ratios. In this case, the corrective bounce ratio is not that favorable. Our profits this year are already huge, so waiting out a relatively short period before they increase even more (of course, I’m not promising any kind of performance) should be rather easy.
Instead of a small corrective upswing, we might see a sharp drop to $20. Missing huge profits on the latter would be much worse than having to wait out a very short-term correction.
Thank you for reading our free analysis today. Please note that the above is just a small fraction of the full analyses that our subscribers enjoy on a regular basis. They include multiple premium details such as the interim targets for gold and mining stocks that could be reached in the next few weeks. We invite you to subscribe now and read today’s issue right away.
Sincerely,
Przemyslaw Radomski, CFA
Founder, Editor-in-chief -
How Long Will Gold Defend Itself From the Strong Dollar Impact?
September 23, 2022, 8:08 AMWhile the GDXJ suffered after the FOMC meeting, gold and silver held their ground. How long will they last in the face of a stronger USDX?
The PMs were divided on Sep. 22, as gold and silver rallied by 0.32% and 0.70%, respectively, while the GDX and GDXJ ETFs declined by 0.38% and 1.20%. Moreover, with the S&P 500’s 0.84% decline supporting the latter’s movements, mining stocks fell alongside the U.S. equity benchmark.
Conversely, the USD Index and the U.S. 10-Year real yield hit new 2022 highs, which are ominous developments for the PMs. As such, the price action across asset classes largely unfolded as expected.
Yields Unhinged
With the S&P 500 and the GDXJ ETF suffering in unison on Sep. 22, hawkish realities continue to upend risk assets. Moreover, while gold and silver were relative outperformers, the implications of higher nominal and real interest rates should prove problematic in the months ahead.
Please see below:
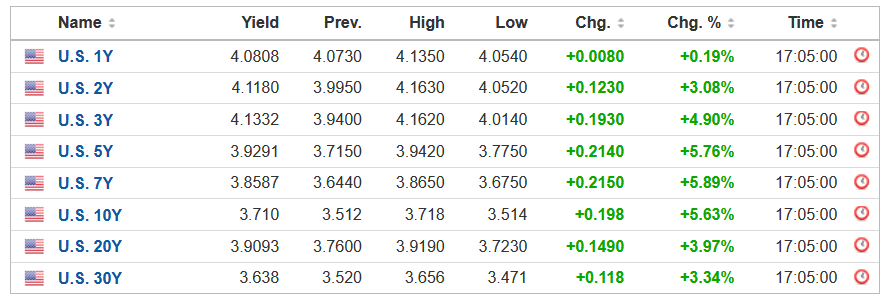 Source: Investing.com
To explain, the U.S. yield curve remains on fire, as Treasury yields rose sharply on Sep. 22. Furthermore, with the U.S. 10-Year Treasury yield ending the session at 3.70% (StockCharts' data), the benchmark has rallied by more than 100 basis points from its August low.
More importantly, with the U.S. 10-Year breakeven inflation rate ending the Sep. 22 session at 2.41%, the U.S. 10-Year real yield soared to 1.29%, its highest level since 2011. As a result, financial conditions continue to tighten, and the ramifications are profoundly bearish for gold, silver and mining stocks.
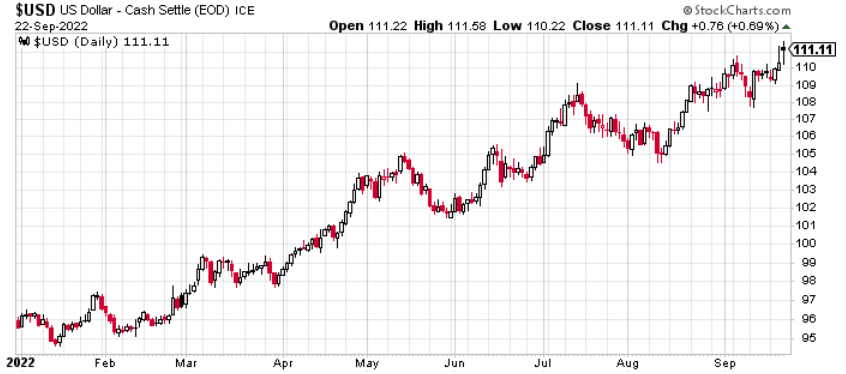
In addition, the USD Index hit new 2022 intraday and closing highs on Sep. 22, and the dollar basket remains poised for further gains. Therefore, the PMs' main fundamental adversaries continue to perform as expected, and their medium-term outlooks are bright as inflation keeps the Fed's foot on the hawkish accelerator.
Please see below:
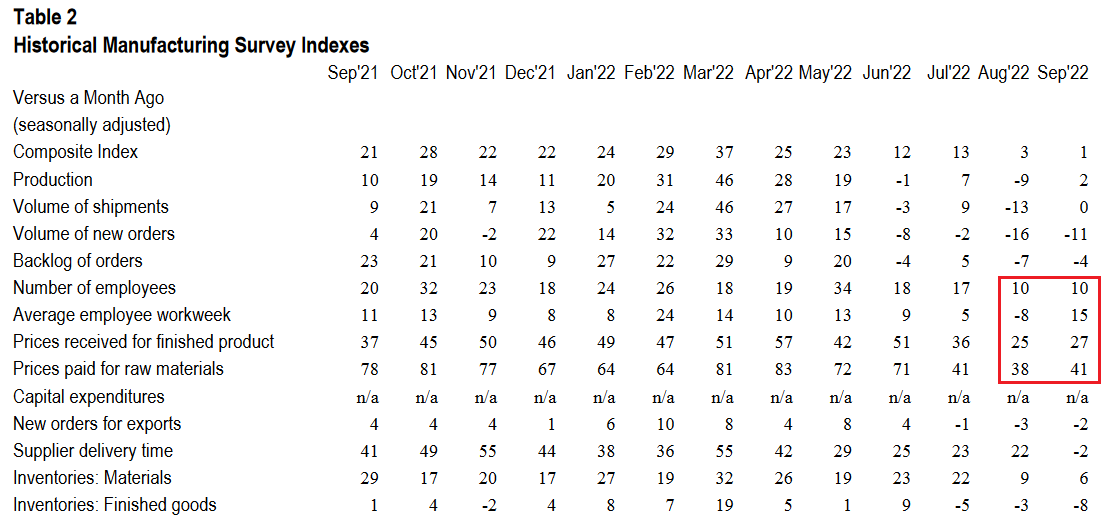
To that point, the Kansas City Fed released its Tenth District Manufacturing Activity Survey on Sep. 22. The headline index decreased from 3 in August to 1 in September. However, the report revealed that “most month-over-month (MoM) indexes increased in September, except for supplier delivery time, materials inventories, and finished goods inventories.”
Also, the data showed that inflation and employment remained resilient, which is profoundly bullish for future Fed policy.
Please see below:
 Source: KC Fed
To explain, the table above tracks the monthly readings for all of the KC Fed's manufacturing indexes. If you analyze the red box on the right side, you can see that prices paid, prices received and the average employee workweek all increased MoM.
Thus, KC manufacturing firms experienced higher inflation and increased their operating hours in September versus August. Similarly, the number of employees index remained constant at 10, which signals that KC firms are not laying off their workers as the U.S. labor market remains tight.
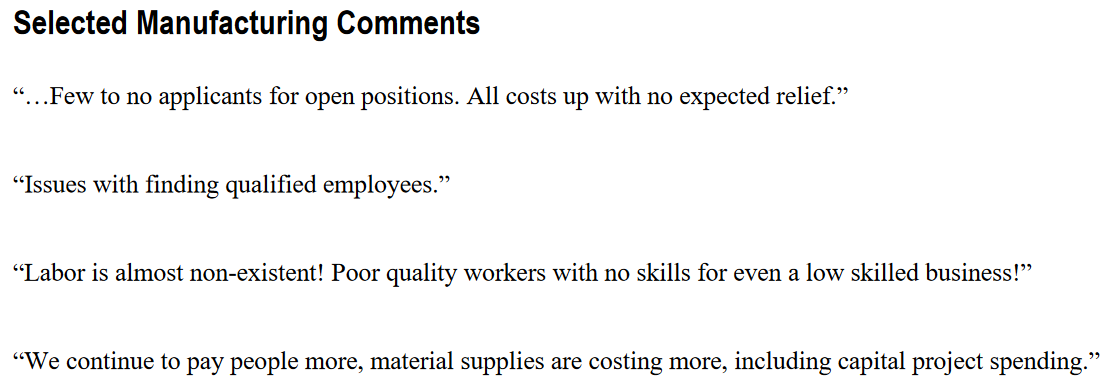
As evidence, KC firms' anecdotal comments highlight why wage inflation is unlikely to abate anytime soon.
Please see below:
 Source: KC Fed
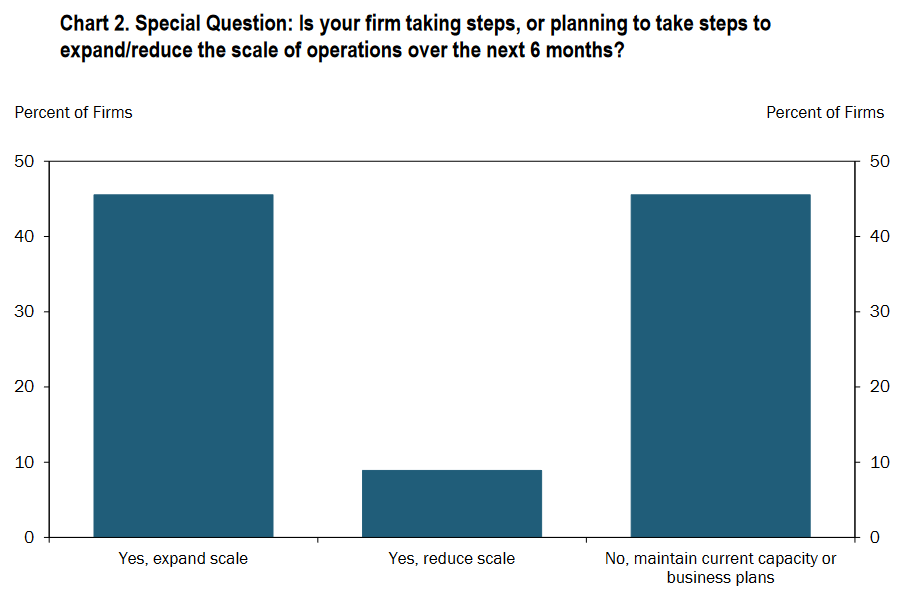
On top of that, the overwhelming majority of KC firms plan to increase or maintain their current capacity over the next six months. As such, the demand destruction needed to alleviate inflation still awaits us. The report stated:
“In September, nearly half of firms reported they were taking steps, or planning to take steps, to expand the scale of operations over the next six months, while only a handful expected to decrease capacity. The steps firms reported to expand scale included adding to workforce size, capital expansion, and expanding into new or existing markets.”
Please see below:
 Source: KC Fed
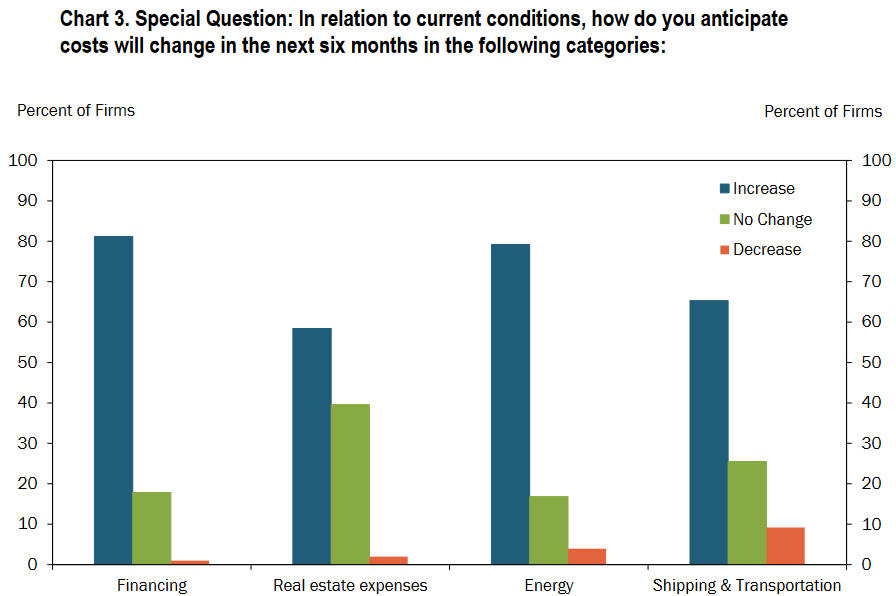
In addition:
“In relation to current conditions, a majority of firms anticipated costs will increase in the next six months across all categories, especially for financing and energy related costs.”
Please see below:
 Source: KC Fed
Thus, with most KC firms struggling to find qualified workers and also expecting other input costs to increase over the next six months, the inflationary findings are bullish for future rate hikes. Likewise, with more than 90% of KC firms either expanding or maintaining their operations over the next six months, we’re far from the demand destruction that would allow the Fed to pivot.
As such, more rate hikes should commence in the coming months, and the liquidity drain is profoundly bearish for gold, silver, and mining stocks.
More Hawkish Data
While the consensus continuously cites supply-chain disruptions, I’ve warned on numerous occasions that demand is much stronger than the crowd realizes. Therefore, resilient consumer spending keeps inflation uplifted and requires a higher U.S. federal funds rate (FFR) to normalize the pricing pressures.
To that point, while the fall season has arrived and pent-up demand should be in the rearview, Americans remain eager to spend their money.
Please see below:
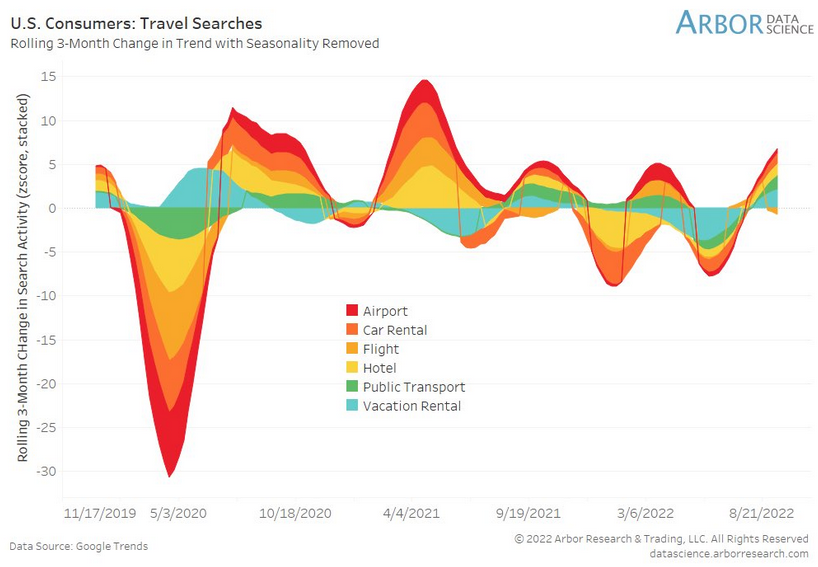
To explain, the shaded areas above track the z-score of the three-month rolling change in Americans’ Google Search activity for travel-related items. For context, these include flights, hotels, car rentals, etc.
If you analyze the right side of the chart, you can see that overall search activity remains decidedly elevated. Thus, despite higher inflation, Americans are still planning vacations, and material wage growth affords them this ability. Moreover, with households’ checkable deposits hitting a record high in Q2, Americans’ ability and willingness to spend makes the Fed’s inflation fight extremely difficult.
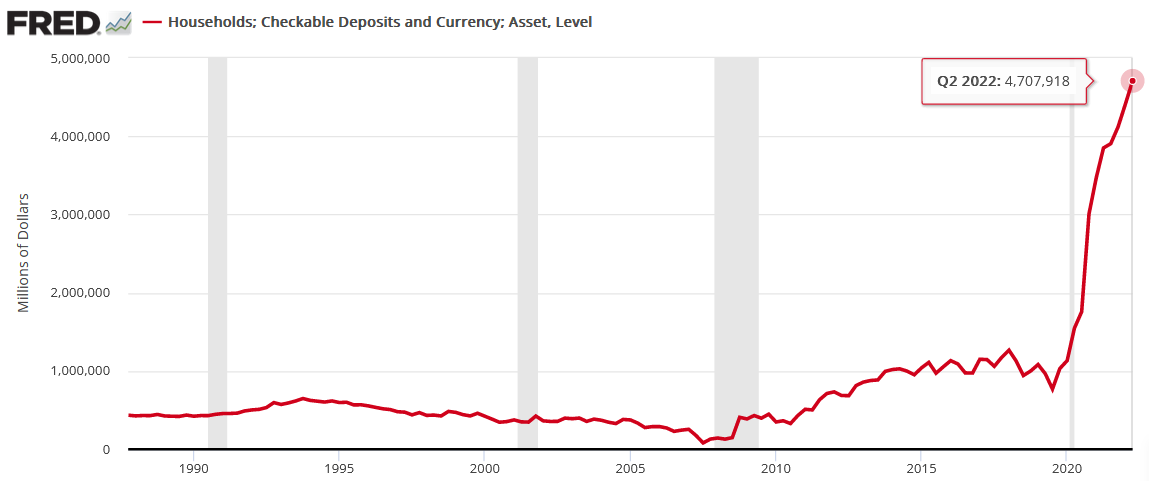
To explain, I wrote on Sep. 19:
The Fed updated the data on Sep. 9; and with the metric hitting another all-time high, American households have nearly $4.708 trillion in their checking accounts (as of Q2), a 357% increase from Q4 2019. Furthermore, the Q2 figure is 6.7% higher than Q1.
Please see below:
Also noteworthy, General Mills released its first-quarter earnings on Sep. 21. For context, it has a nearly $50 billion market cap and is one of the largest food & beverage companies in the U.S. CFO Kofi Bruce said during the Q1 earnings call:
“We are modestly higher on inflation in the front half and modestly is probably appropriate. But I think on balance, it is still a relatively balanced year in terms of our inflation call between 14% and 15%.”
Moreover, CEO Jeff Harmening added that price increases are the necessary cure:
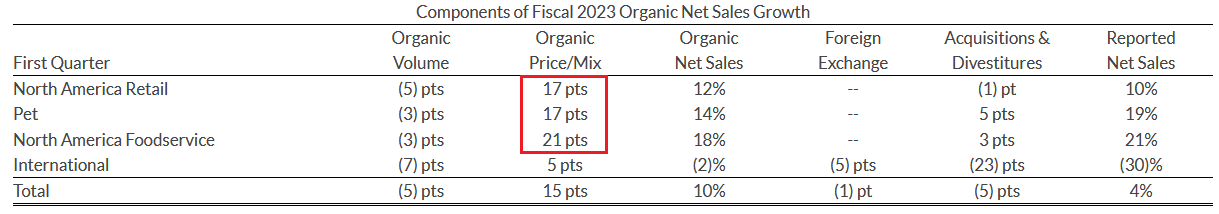
“We will start to roll over more meaningful pricing in the back half of this year; and obviously, we saw a strong price/mix come through in Q1 that's likely similar in Q2 and then it decelerates as we start comparing more meaningful step-ups last year.”
Please see below:
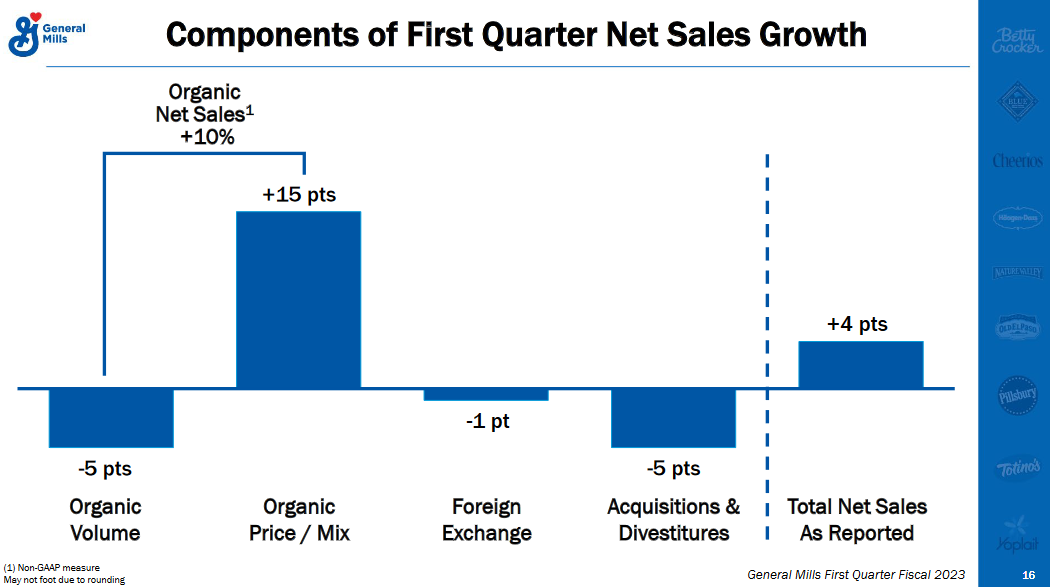
To explain, General Mills broke down its organic net sales, which excludes the impact of acquisitions, divestitures and FX. If you analyze the left side of the chart, you can see that organic volume declined by 5% in Q1. However, organic net sales were up by 10% on the back of a 15% increase in price/mix. As a result, the company increased its prices by up to 15% in Q1.
But if we ignore General Mills’ international segment and focus on North America, the organic price increases were higher than the 15% consolidated figure.
Please see below:
 Source: General Mills
To explain, the red box above shows how General Mills' North American retail, foodservice, and pet segments enjoyed organic price/mix increases of 17%, 21%, and 17%, respectively.
Moreover, with volume down across all segments, the data highlights how price increases were the primary driver of General Mills' top-line organic growth. Therefore, the Fed is still miles away from solving its inflation conundrum.
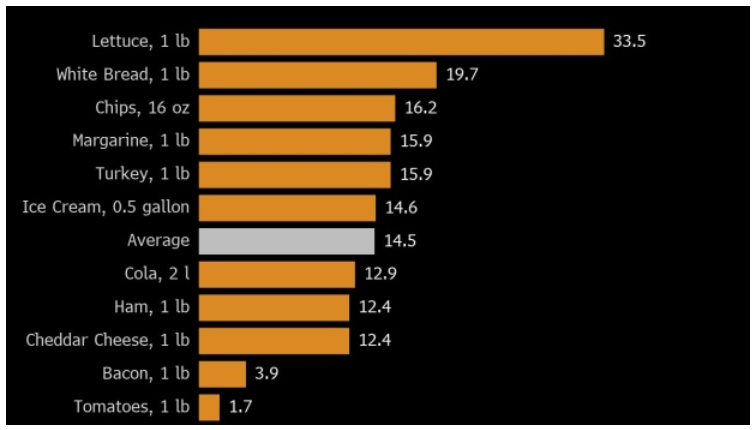
Finally, Bloomberg revealed on Sep. 22 that its American Diner Index increased by 13% year-over-year (YoY). For context, the index "includes ingredients for the tooth-picked club sandwich, as well as the accompanying potato chips, ice cream, and soda." In addition, its purpose is to gauge "how much more expensive it's become to assemble a basic meal." Thus, the food inflation story stretches far beyond General Mills.
 Source: Bloomberg
 The Bottom Line
With the bond market sell-off intensifying on Sep. 22, the S&P 500 continues to suffer. However, while the PMs have been relative outperformers recently, the impact of higher real yields and a stronger USD Index should weigh heavily on their performance over the medium term. Furthermore, while the general stock market’s decline has been rather orderly, a true bout of panic could intensify the pace of the PMs’ likely drawdowns – especially silver and mining stocks.
In conclusion, the PMs were mixed on Sep. 22, as mining stocks followed the S&P 500 lower. Likewise, with the fundamental pain poised to persist, the implications of rapidly rising interest rates are far from priced in. As a result, gold, silver, and mining stocks’ medium-term outlooks remain profoundly bearish.
Thank you for reading our free analysis today. Please note that the above is just a small fraction of the full analyses that our subscribers enjoy on a regular basis. They include multiple premium details such as the interim targets for gold and mining stocks that could be reached in the next few weeks. We invite you to subscribe now and read today’s issue right away.
Sincerely,
Przemyslaw Radomski, CFA
Founder, Editor-in-chief -
The USD Soared on the Fed’s Hawkish Wings After the Rate Hike
September 22, 2022, 9:05 AMAvailable to premium subscribers only.
Thank you for reading our free analysis today. Please note that the above is just a small fraction of the full analyses that our subscribers enjoy on a regular basis. They include multiple premium details such as the interim targets for gold and mining stocks that could be reached in the next few weeks. We invite you to subscribe now and read today’s issue right away.
Sincerely,
Przemyslaw Radomski, CFA
Founder, Editor-in-chief -
Gold Confirmed Its Breakdown by Not Returning Above 1,700 USD
September 21, 2022, 6:53 AMGold has just clearly confirmed the descent to the 2020 lows, and this means that it’s ready to fall further. Will it happen during the FOMC conference?
In short, yesterday’s session developed practically exactly in tune with my yesterday’s analysis. PMs declined, but not substantially so. The back-and-forth movement simply continued.
What didn’t happen in the gold market is most important. Namely, gold didn’t move back above $1,700. This breakdown is now more than verified for the first time since mid-2020.
This means that gold is now very likely to slide. It probably hasn’t declined yet because the markets are waiting for the Fed. Either way, after the rate hike is announced, after/during the press conference, or once the dust settles (so in a few days), gold is likely to plunge – similarly to how it declined in 2013.
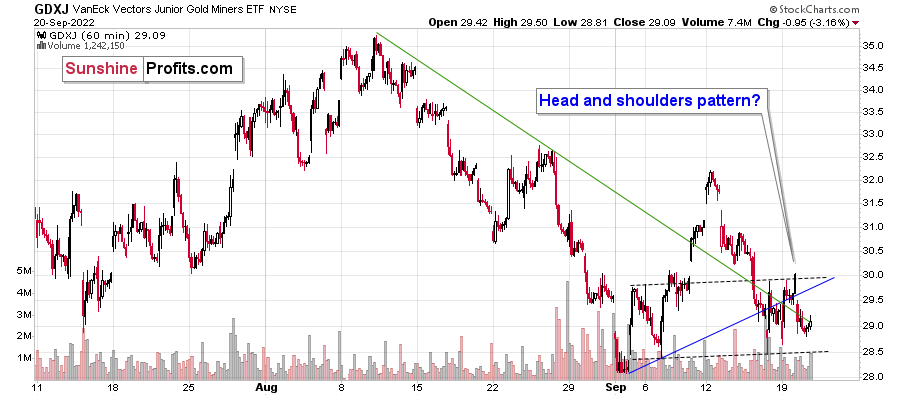
In yesterday’s analysis, I wrote that juniors (the GDXJ ETF) are now moving sideways and that they might create a head-and-shoulders pattern once they break below $28.5. Based on yesterday’s decline, they are now quite close.
The above will imply a decline to at least $25. The emphasis here is on “at least,” because there’s strong support at the 2020 lows. Such a move would likely correspond to a move to the 2020 low in gold.
If the self-similarity to 2013 continues, then it seems that we won’t have to wait much longer for this kind of sharp decline.
All in all, the profits on our short positions in the junior mining stocks are likely to increase profoundly in the coming weeks.
Thank you for reading our free analysis today. Please note that the above is just a small fraction of the full analyses that our subscribers enjoy on a regular basis. They include multiple premium details such as the interim targets for gold and mining stocks that could be reached in the next few weeks. We invite you to subscribe now and read today’s issue right away.
Sincerely,
Przemyslaw Radomski, CFA
Founder, Editor-in-chief


Gold Investment News
Delivered To Your Inbox
Free Of Charge
Bonus: A week of free access to Gold & Silver StockPickers.
Gold Alerts
More-
Status
New 2024 Lows in Miners, New Highs in The USD Index
January 17, 2024, 12:19 PM -
Status
Soaring USD is SO Unsurprising – And SO Full of Implications
January 16, 2024, 8:40 AM -
Status
Rare Opportunity in Rare Earth Minerals?
January 15, 2024, 2:06 PM

