
tools spotlight

-
Gold, Silver, and Mining Stocks Leave No Room for Bullish Hopes
October 17, 2022, 7:50 AMPrecious metals have probably resumed their medium-term downward trend. Are they ready to hit new lows?
Gold, silver, and miners all declined heavily on Friday, and the medium-term decline appears to be back.
This means that practically everything that I wrote previously has either already become a reality or remains up-to-date as a forecast. Consequently, the technical part of today’s analysis will be rather brief – I have very little new to add to Friday’s big analysis.
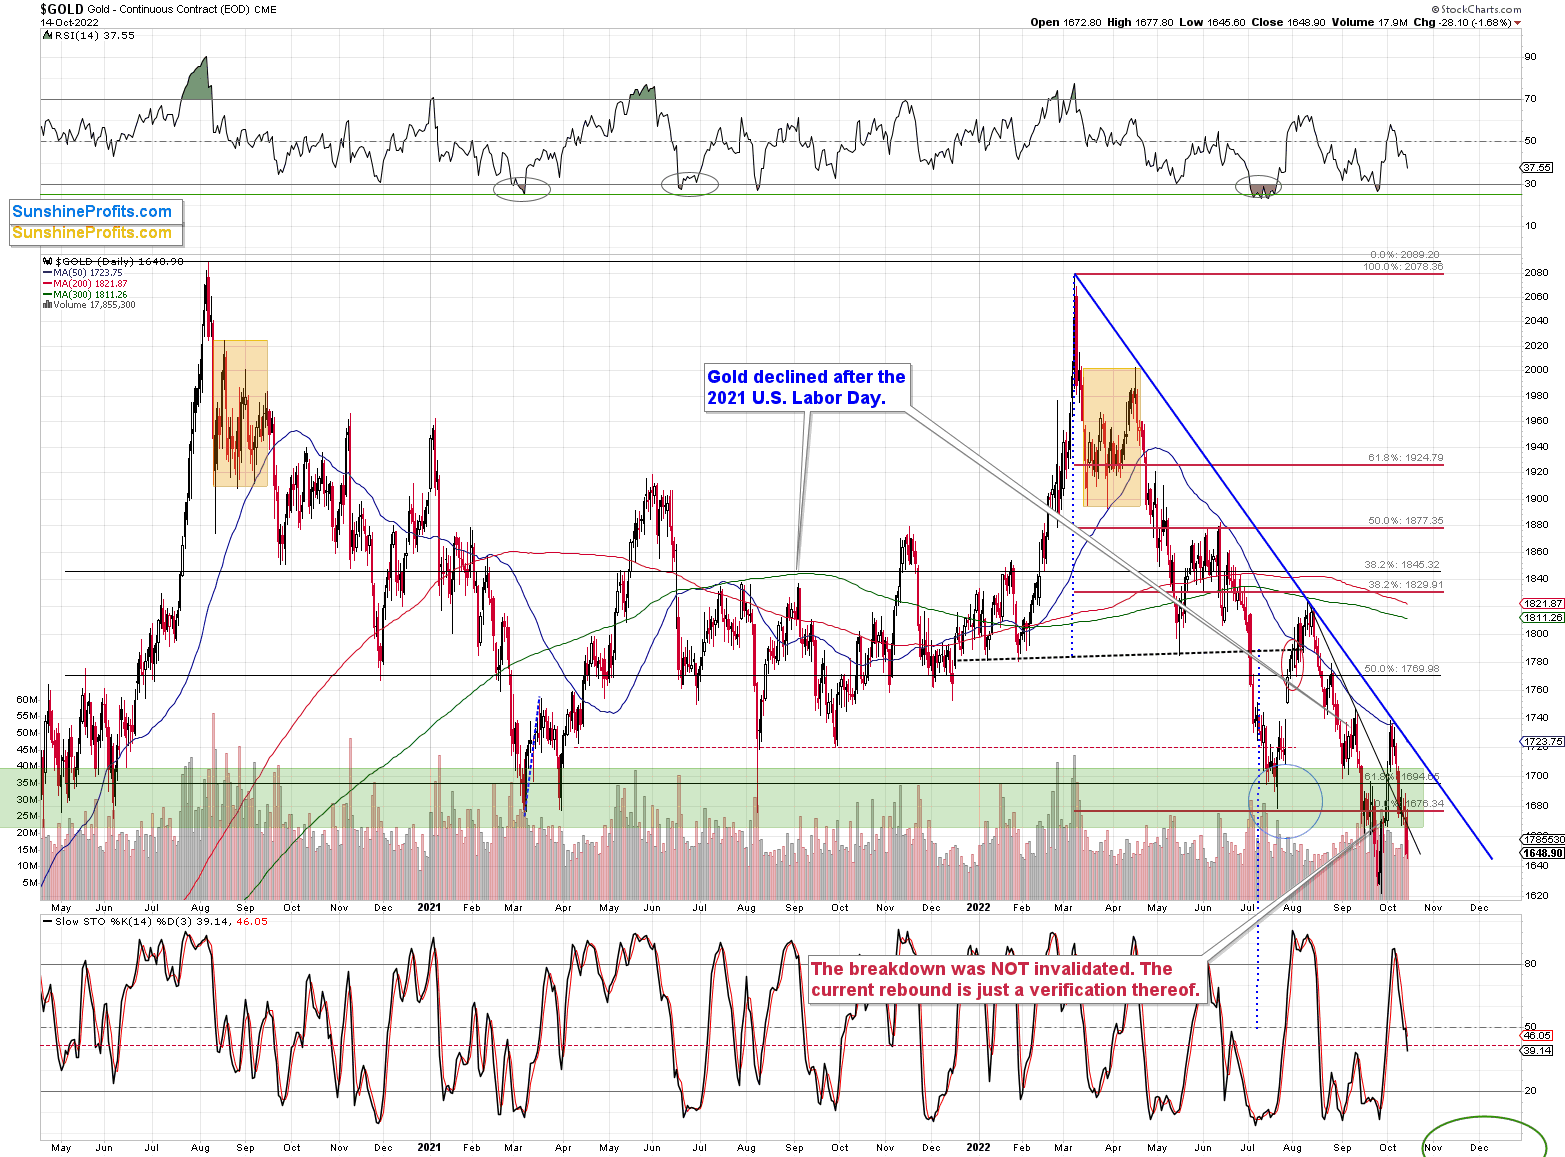
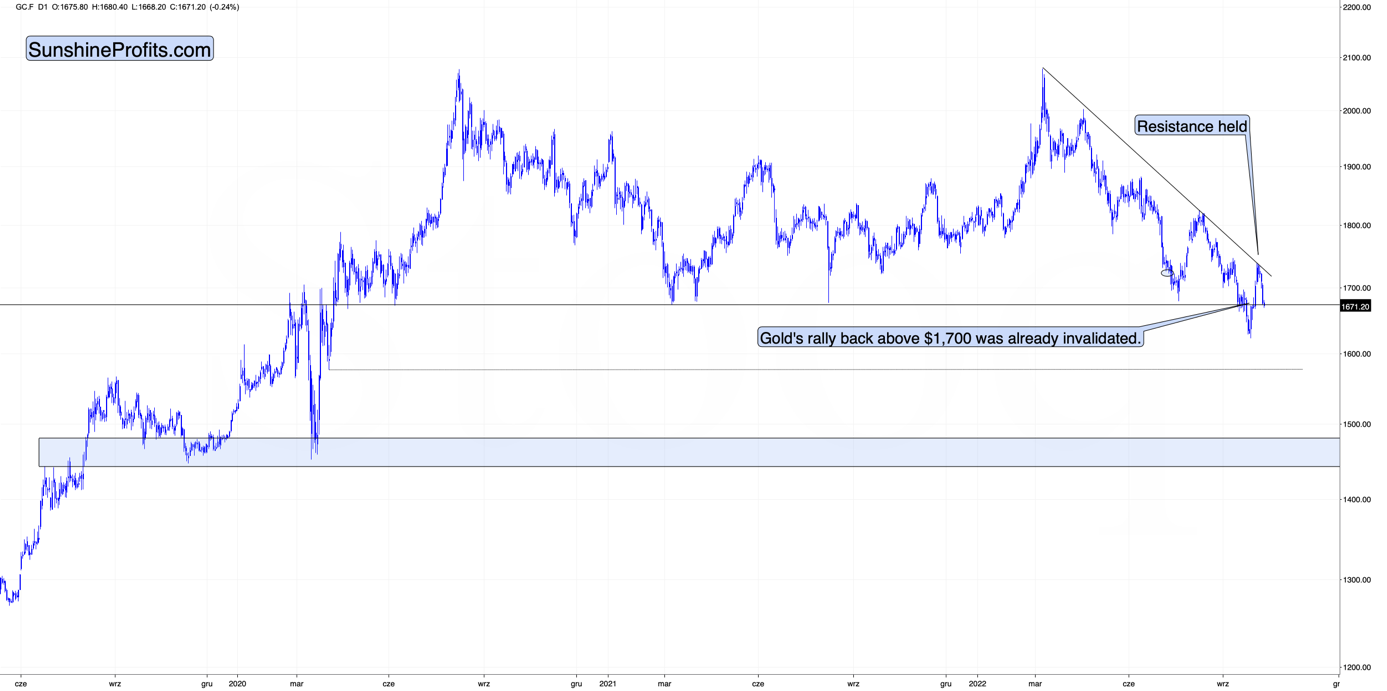
Gold is down, and it’s once again visibly below the green support area. Even though gold moved very briefly above it, one can say that overall, this area worked as resistance.
This means that gold can, and is now likely to fall further.

Just like gold, silver declined strongly, and permabulls’ dream of silver’s immediate comeback appears to have been crushed. Last week’s close was the second lowest weekly close that we have seen this year.
The back-and-forth trading pattern that started in July could be viewed as a flag pattern, and the moves that follow flags (which is a continuation pattern on its own) tend to be similar to the moves that preceded them.
In this case, the move that preceded the pattern was a big ~$10 decline, so it seems that silver is about to slide profoundly. It might not be a $10 move lower in this case, as the moves could be similar in percentage terms but not in dollar terms. Still, silver is likely to fall significantly before it bottoms.
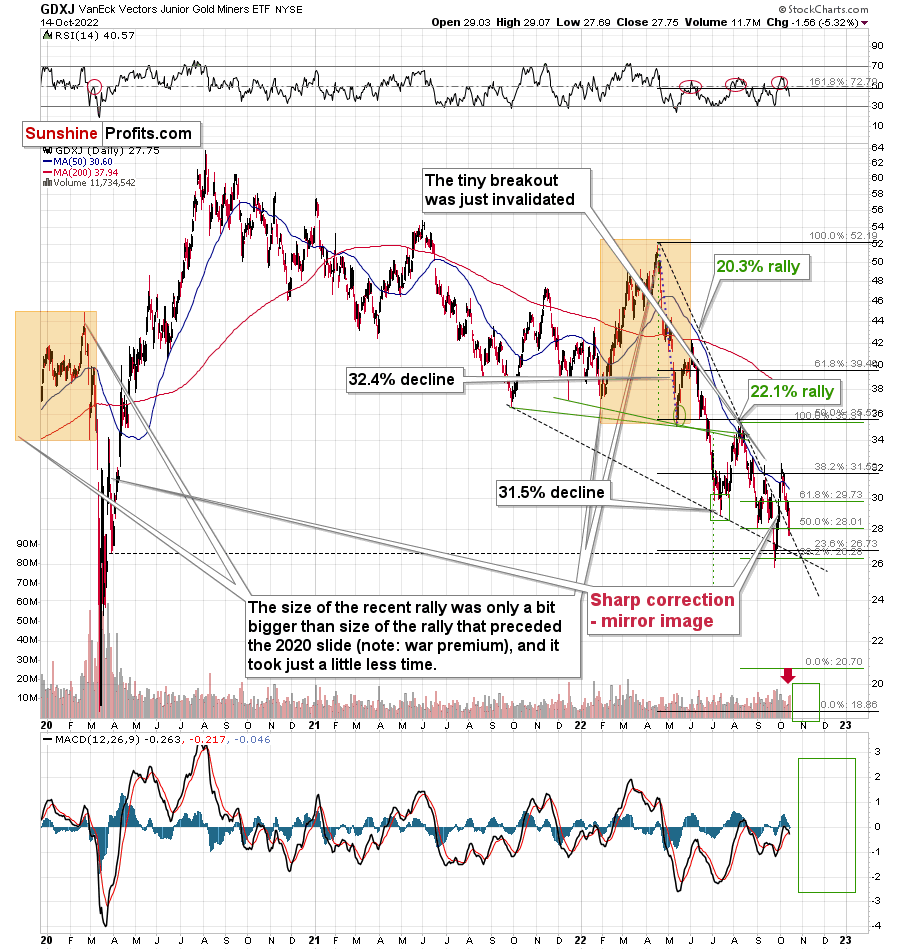
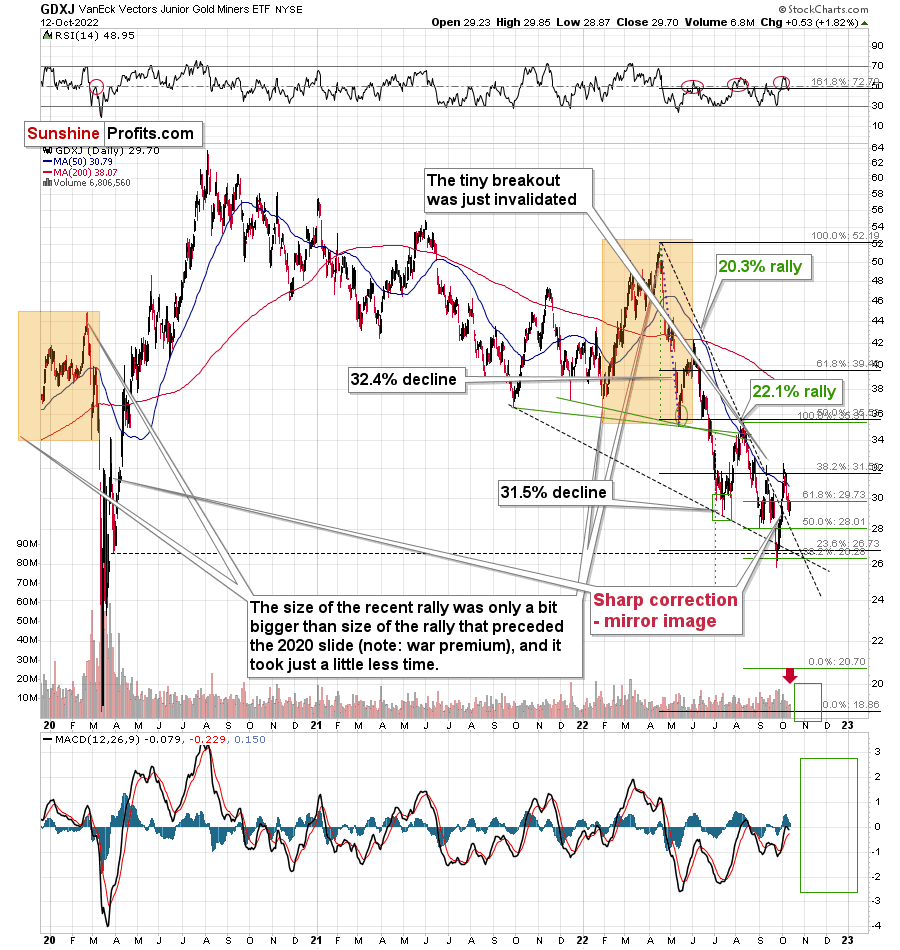
The decline in junior miners is clearly visible as well, and now there’s little doubt about the fake nature of the recent upswing.
The GDXJ ETF is not yet at new yearly lows, but it seems likely that when it moves to new lows (which means a breakdown below the support at about $26), it will decline very fast.
The reason is the lack of strong support between $26 and the 2020 low that’s just below $20.
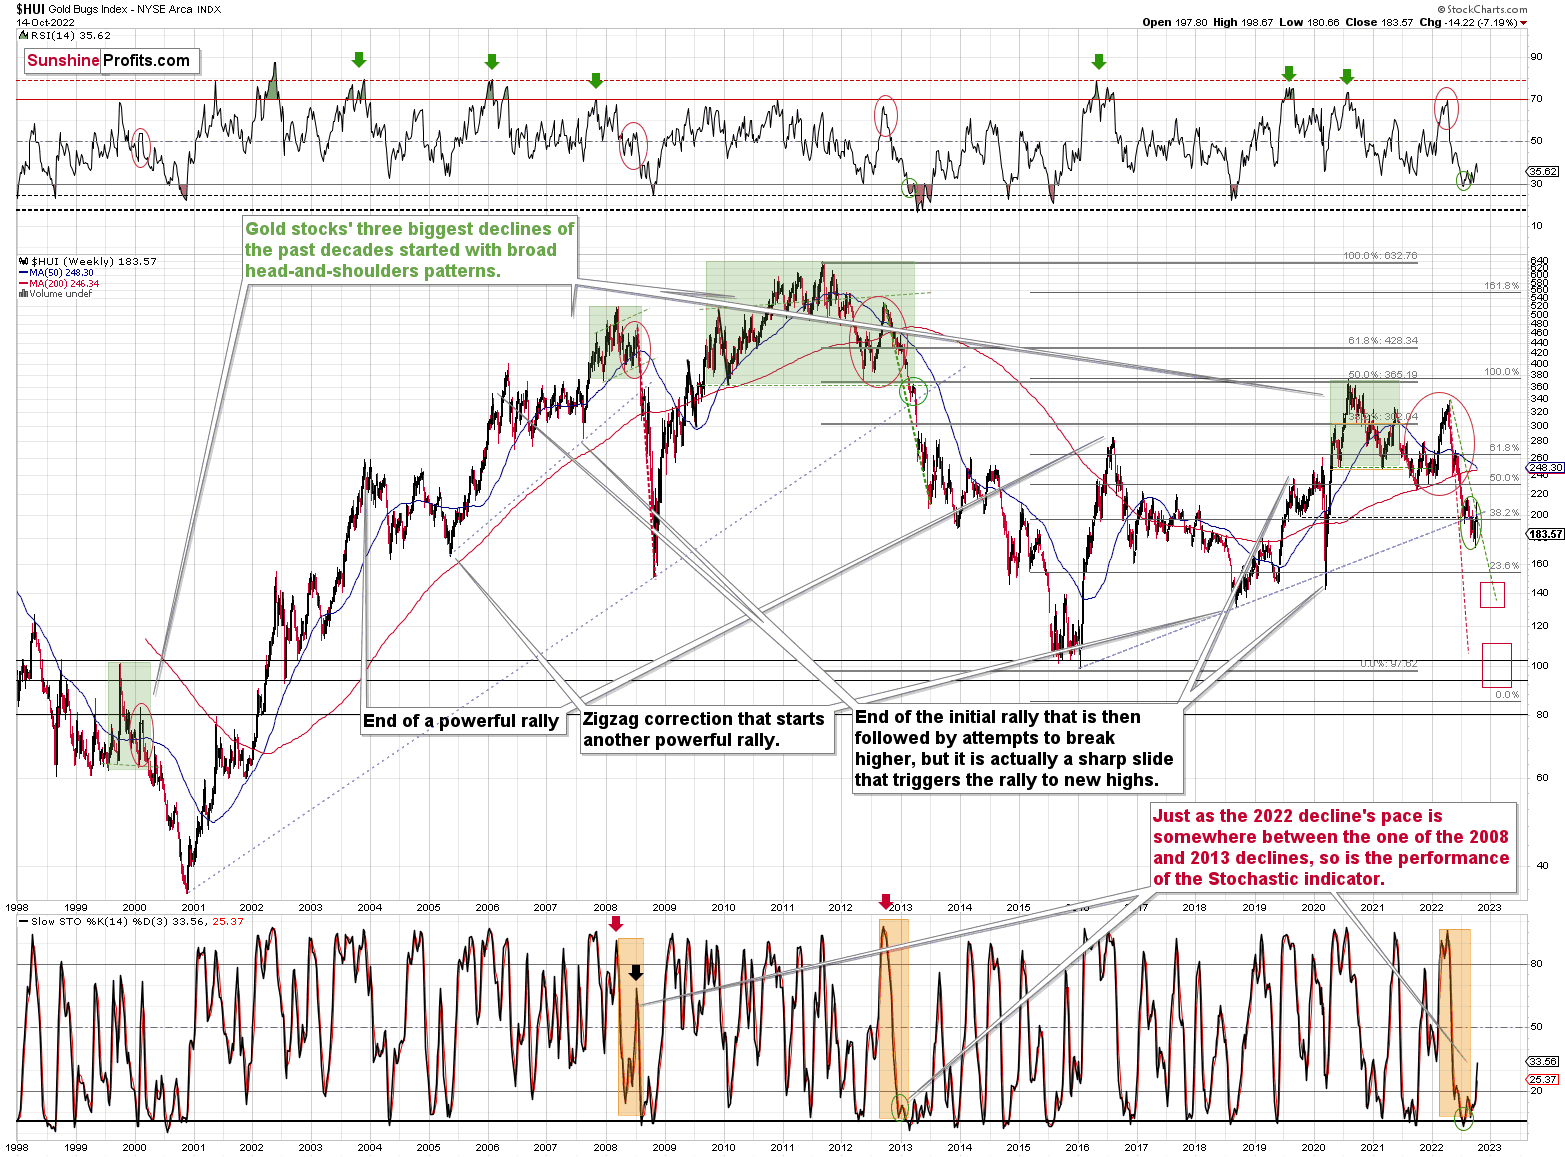
From the long-term point of view, it’s crystal-clear that gold stocks broke below the rising medium-term support line and they verified this breakdown.
After the same thing happened in 2008 and 2013, a huge decline followed.
The implications are extremely bearish, and while I can’t promise anything regarding performance, it seems that profits on our short position in junior miners will increase substantially.
Thank you for reading our free analysis today. Please note that the above is just a small fraction of the full analyses that our subscribers enjoy on a regular basis. They include multiple premium details such as the interim targets for gold and mining stocks that could be reached in the next few weeks. We invite you to subscribe now and read today’s issue right away.
Sincerely,
Przemyslaw Radomski, CFA
Founder, Editor-in-chief -
Gold’s Corrective Upswing Seems Over – The Best Time to Go Short?
October 14, 2022, 9:25 AMAvailable to premium subscribers only.
Thank you for reading our free analysis today. Please note that the above is just a small fraction of the full analyses that our subscribers enjoy on a regular basis. They include multiple premium details such as the interim targets for gold and mining stocks that could be reached in the next few weeks. We invite you to subscribe now and read today’s issue right away.
Sincerely,
Przemyslaw Radomski, CFA
Founder, Editor-in-chief -
Gold and the Dollar Went in Opposite Directions Again
October 13, 2022, 8:47 AMThe situation in the precious metals market remains bearish, as expected. In contrast, the dollar index resumed its rally after the breakout was confirmed.
The stock market declined only slightly yesterday, so everything that I wrote about it and about the implications of the situation remains up-to-date [quote is unchanged, but I’m uploading new charts]:
We’re almost there.
We’re almost at the point where stock market investors give up and let the big plunge unfold. I wrote about the link between the general stock market and the precious metals market previously, but as a quick reminder, they are likely to decline together, at least initially, and junior mining stocks are likely to feel the biggest pain.
For broader context, please take a look at the analysis from Oct. 10, if you haven’t had the chance to do so yet.
If you’re familiar with it, let’s take a closer look at the S&P 500 futures.
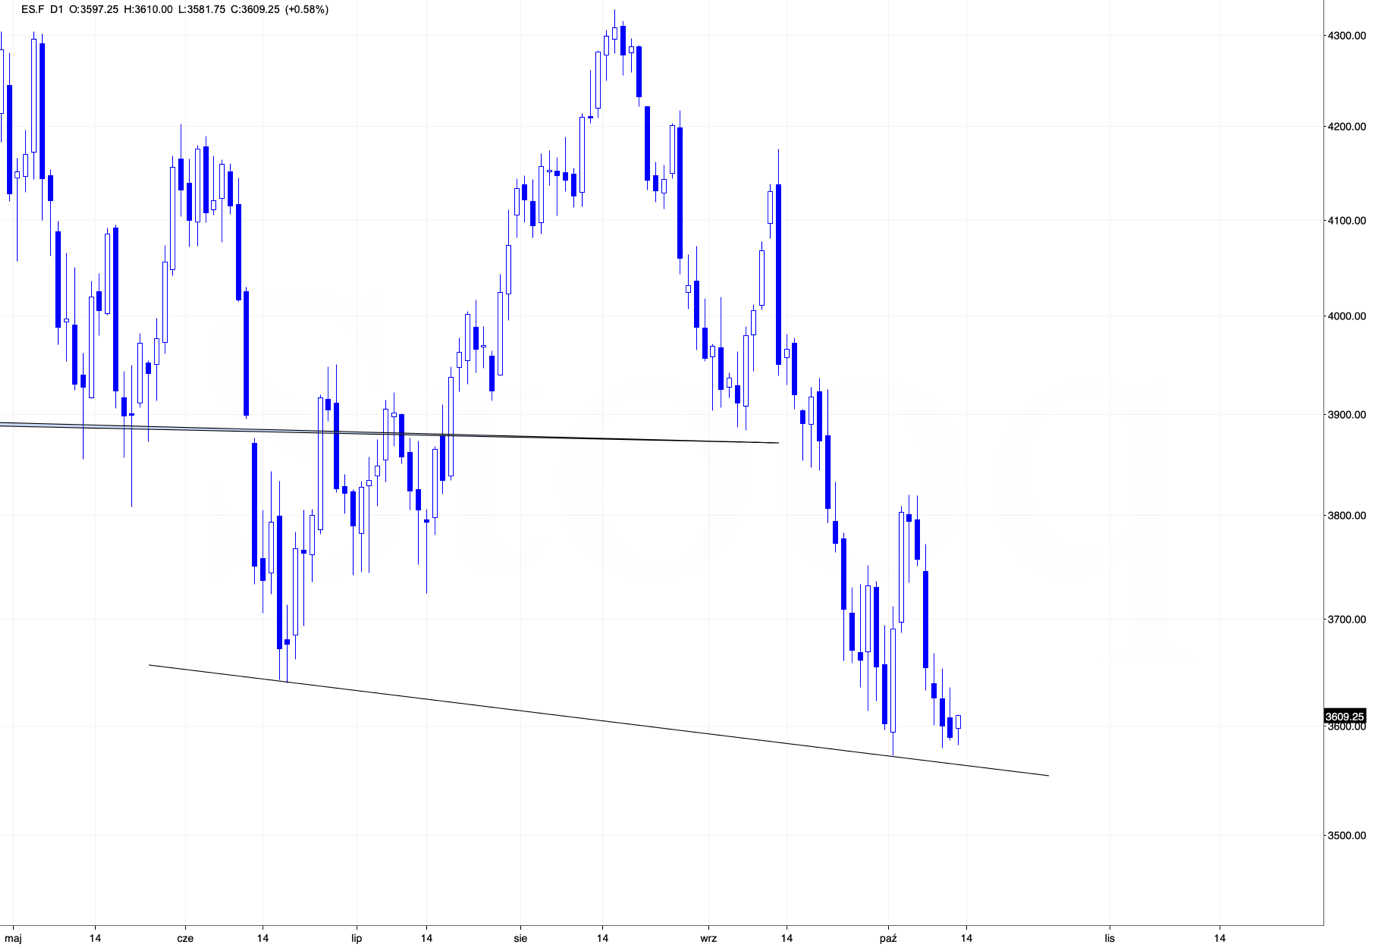
Even though it might not be clear at first sight, stocks actually made a new yearly low yesterday, which, of course, is something important.
They moved back up in today’s pre-market trading, but the breakdown could really be confirmed this time. We already saw a corrective rally earlier this month, and it failed to ignite a trend reversal. It's no surprise that interest rates are rising and inflation has yet to abate. History shows that rates need to climb much higher for that to happen.
Anyway, if stocks decline further soon – and that appears likely – they will then break below the neck level of the head-and-shoulder formation that started in mid-June. Based on this formation, stocks are likely to move much lower – approximately repeating their August-September decline.
What if junior mining stocks also repeat their August-September decline?
Well, then they would be likely to fall significantly – to $22-24.
However, based on the link to 2013, and based on where the strong support levels are (there aren’t any really strong support levels between ~$26 and the 2020 lows), the GDXJ is likely to decline even more.
The GDXJ ETF ended yesterday’s session slightly higher, but please note that this move up materialized on low volume. This tells us that it’s just a pause within the decline.
So, all in all, my previous bearish comments on gold, silver, and mining stocks remain up-to-date, and there’s little new that I can add today that I haven’t already written about in recent days. Before moving to the fundamentals, I’d like you to take a look at the below USD Index chart, and appreciate how perfectly the monthly turning point worked recently.
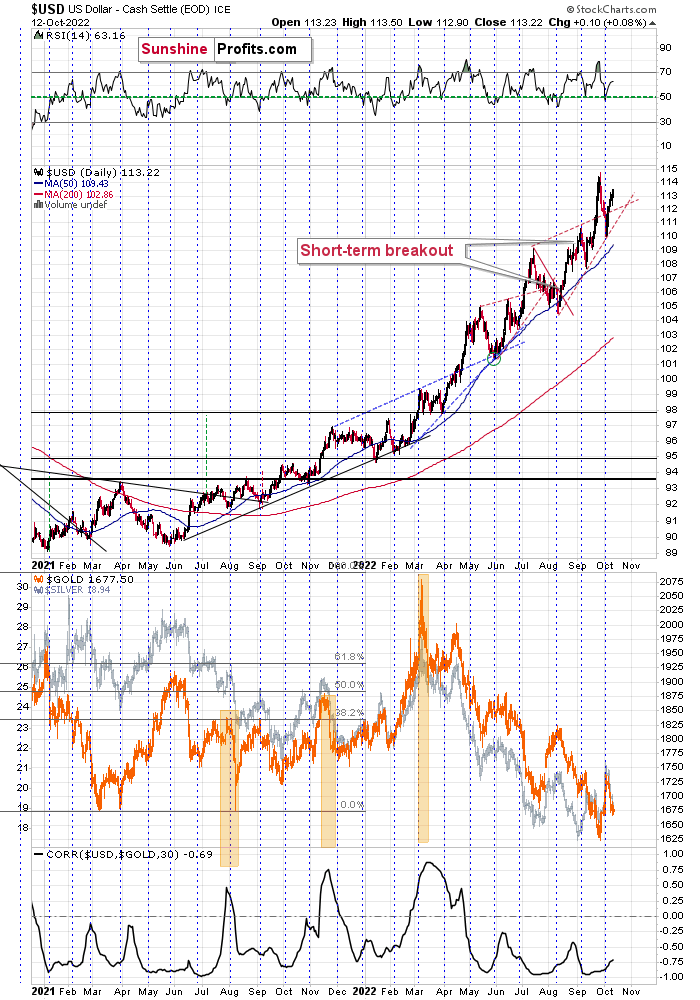
On Oct. 3, I wrote the following:
Nothing changed in the USD Index – it just verified the breakout above its rising support/resistance line. It declined close to the turn of the month, which is when it tends to reverse its course.
As the breakout held, the outlook for the U.S. dollar remains bullish, and given the above-mentioned monthly seasonality for the dollar, it seems that the rally is likely to resume any day now.
Indeed, the USD Index’s rally resumed just a few days later.
Thank you for reading our free analysis today. Please note that the above is just a small fraction of the full analyses that our subscribers enjoy on a regular basis. They include multiple premium details such as the interim targets for gold and mining stocks that could be reached in the next few weeks. We invite you to subscribe now and read today’s issue right away.
Sincerely,
Przemyslaw Radomski, CFA
Founder, Editor-in-chief -
How Will the New CPI Data Affect the Gold Market?
October 12, 2022, 8:59 AMFresh inflation data is to be released tomorrow. While it may trigger daily fluctuations, the precious metals’ medium-term fundamentals remain bearish.
Stuck in Reverse
While risk assets attempted a daily rally on Oct. 11, Bank of England (BOE) Governor Andrew Bailey spoiled the party with his hawkish warning to U.K. pension funds. After restarting QE to curb the rapid rise in U.K. interest rates, he said:
“My message to the funds involved and all the firms is you’ve got three days left now. You’ve got to get this done. The essence of financial stability is that [intervention] is temporary. It’s not prolonged.”
Thus, while gold bucked the trend, it was another down day for silver, mining stocks and the S&P 500. Furthermore, with Fed officials undeterred by the financial market volatility, Cleveland Fed President Loretta Mester said on Oct. 11:
“Unacceptably high and persistent inflation remains the key challenge facing the U.S. economy. Despite some moderation on the demand side of the economy and nascent signs of improvement in supply-side conditions, there has been no progress on inflation.”
She added:
“Given current economic conditions and the outlook, at this point the larger risks come from tightening too little and allowing very high inflation to persist and become embedded in the economy.”
As a result, Mester reiterated that a dovish pivot is out of touch with fundamental reality.
Please see below:
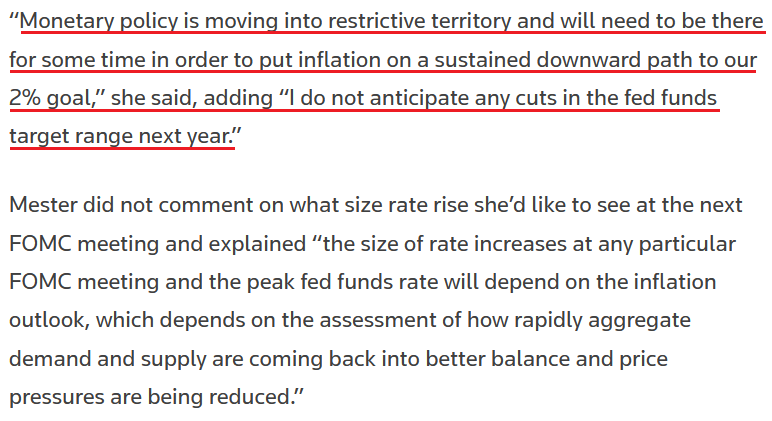 Source: Reuters
Therefore, with central bankers ignoring investors’ cries for help, suddenly, buying the dip isn’t so profitable anymore (you have been warned). However, with the Consumer Price Index (CPI) scheduled for release on Oct. 13, volatility could be amplified depending on the result. As such, while material intraday swings could be the norm for the foreseeable future, the PMs’ medium-term fundamentals remain profoundly bearish.
To that point, with Big Tech a major driver of the S&P 500’s performance, rate hikes and quantitative tightening (QT) should weigh on both. Likewise, since the GDXJ ETF is more correlated to the S&P 500’s movement than its precious metals peers, the junior miners are caught in the crossfire.
Please see below:
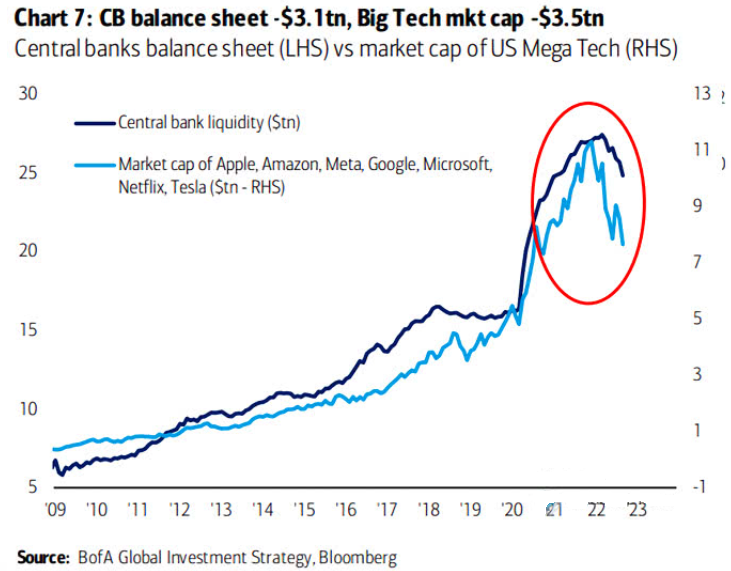
To explain, the dark blue line above tracks central bank liquidity, while the light blue line above tracks the combined market capitalization of Apple, Amazon, Meta Platforms, Alphabet, Microsoft, Netflix, and Tesla. If you analyze the relationship, you can see that quantitative easing (QE) and low interest rates were a boon for Big Tech post-GFC.
However, with the trend reversing, the Fed needs to remove liquidity to quell inflation, and the policy stance should continue to suppress Big Tech’s multiples, while the GDXJ ETF should underperform gold as the drama unfolds.
In addition, while investor sentiment remains highly depressed, the economic impact of the liquidity drain has been relatively minimal outside of the U.S. housing market. Moreover, with the Atlanta Fed projecting resilient real GDP growth in Q3 and demand outweighing supply in the U.S. labor market, the economic climate isn’t as bad as the daily price action suggests.
However, with more rate hikes needed to suppress demand, a sharp rise in bankruptcies could spark the next bout of panic.
Please see below:
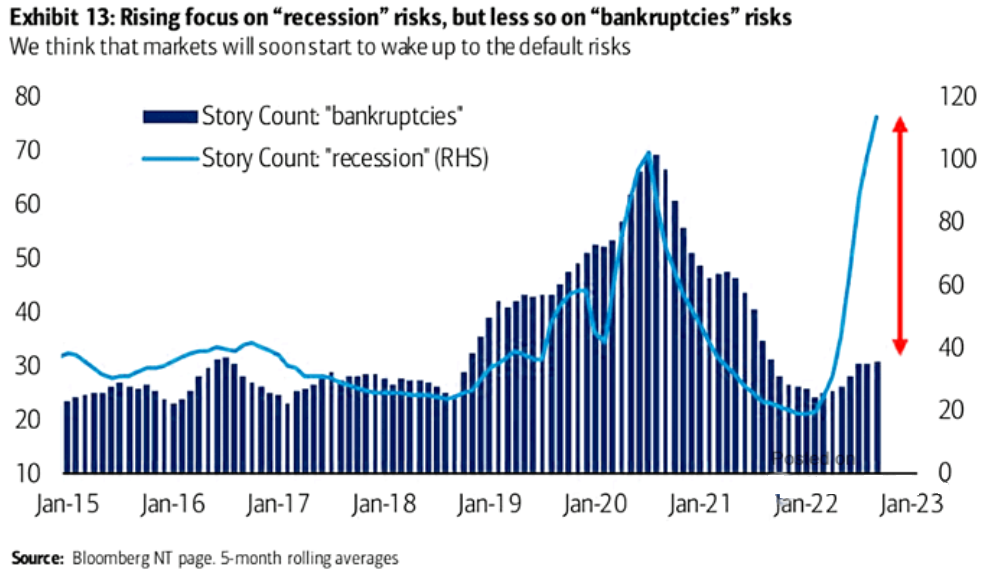
To explain, Bank of America counted recession (the light blue line) and bankruptcy stories (the dark blue bars). If you analyze the relationship, you can see that bankruptcies often move in lockstep with recessionary fears.
However, the right side of the chart shows how bankruptcy stories remain well below recession stories. Yet, that gap should close in the months ahead, as money-losing companies that rely on debt/equity financing to survive could be the next shoe to drop.
For context, I wrote on Oct. 10 that Minneapolis Fed President Neel Kashkari noted the issue on Oct. 6. He said:
“I fully expect that there are going to be some losses and there are going to be some failures around the global economy as we transition to a higher interest rate environment, and that’s the nature of capitalism.
“We need to keep our eyes open for risks that could be destabilizing for the American economy as a whole. But to me, the bar to actually shifting our stance on policy is very high. It should not be up to the Federal Reserve or the American taxpayer to bail people out.”
As a result, with Fed officials warning investors they're on their own until inflation subsides, a cold winter should confront risk assets.
More Employment Strength
I’ve long warned that a demand-driven U.S. labor market is bullish for Fed policy, and as long as the employment outlook remains constructive, the central bank should make life difficult for gold, silver, mining stocks, and the S&P 500. I added on Oct. 10:
While I stated on Sep. 22 that a resilient U.S. labor market gives the Fed the green light to hammer inflation, Waller made the point for me.
Please see below:
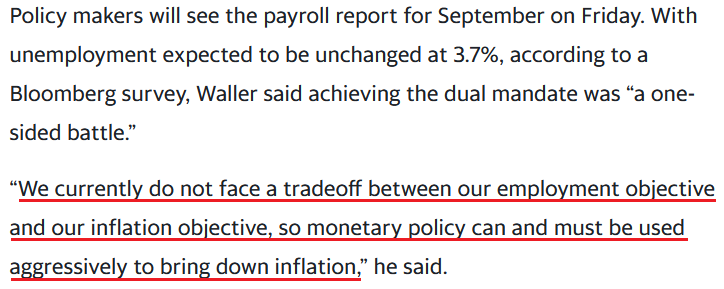 Source: Bloomberg
So with more supportive data hitting the wire recently, the results are bullish for the U.S. federal funds rate (FFR), the U.S. 10-Year real yield and the USD Index.
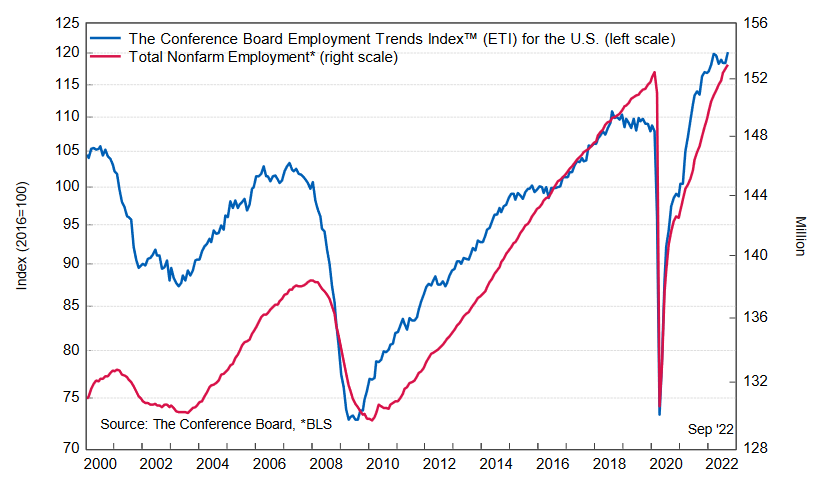
For example, the Conference Board released its Employment Trends Index (ETI) on Oct. 10. The headline index increased from 118.48 in August (a downward revision) to 120.17 in September. Frank Steemers, Senior Economist at The Conference Board, said:
“Some easing to labor shortages is expected as the demand for workers diminishes. However, recruitment and retention difficulties will not disappear as the unemployment rate is only projected to rise to around 4.5% in 2023 and labor supply remains challenged. In this environment, wage growth may also remain elevated. Companies will need to prepare for continued labor shortages and further improve their sourcing and retention strategies to remain competitive.”
Thus, while demand destruction is the perfect ingredient for a dovish pivot, we’re far from that scenario.
Please see below:
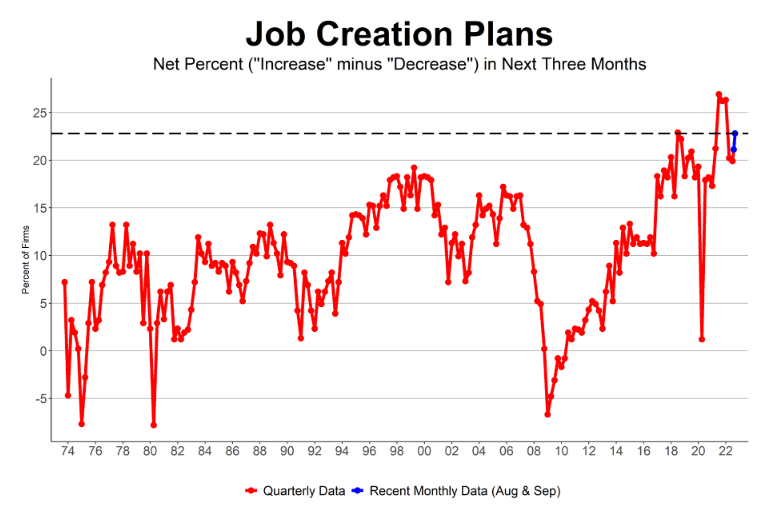
On top of that, the NFIB released its Small Business Optimism Index on Oct. 11. The headline index increased from 91.8 in August to 92.1 in September. Moreover, the NFIB’s jobs report (released on Oct. 6) revealed:
“64% reported hiring or trying to hire in September, up one point from August. Eighty-nine percent of those owners hiring or trying to hire reported few or no qualified applicants for their open positions. Twenty-seven percent of owners reported few qualified applicants for their open positions and 30% reported none.”
In addition:
“Small business owners’ plans to fill open positions remain high, with a seasonally adjusted net 23% planning to create new jobs in the next three months, up two points from August.”
Therefore, despite the Fed’s efforts, small business labor demand increased month-over-month (MoM).
Please see below:
 Source: NFIB
Also noteworthy, the percentage of small businesses with at least one unfilled job opening is closer to its all-time high than its pre-COVID-19 level.
Please see below:
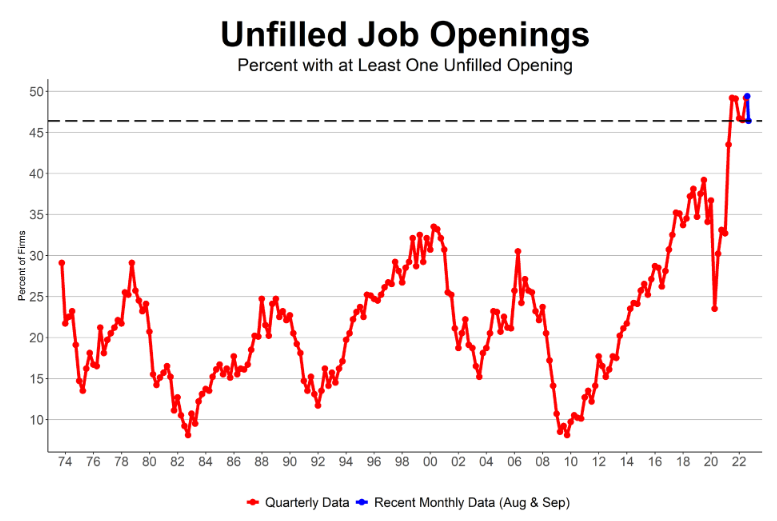 Source: NFIB
Add it all up, and the U.S. labor market remains on solid footing. Likewise, while Wall Street assumes its gloomy mood can influence Fed policy, the reality is that Main Street considers inflation more problematic than decelerating demand.
Please see below:
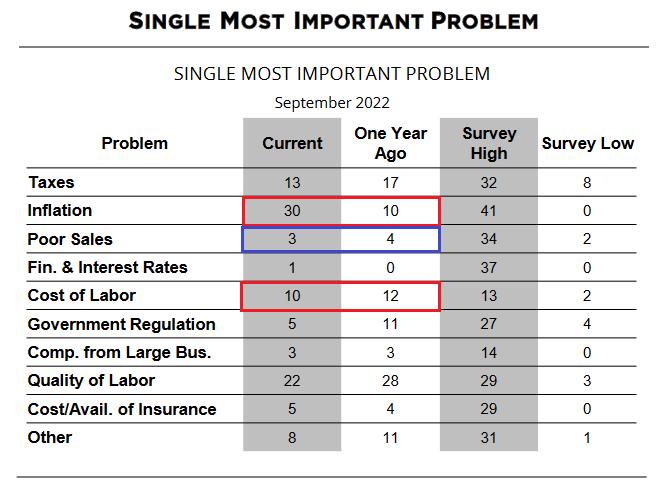 Source: NFIB
To explain, the red rectangles above show how inflation and the cost of labor are high on the list of small businesses' "single most important problem." In contrast, the percentage of respondents citing poor sales declined from 4% in September 2021 to 3% in September 2022, and the current reading is only 1% above its all-time low.
As such, the Fed still has plenty of room to raise the FFR before the U.S. labor market suffers, and a realization is profoundly bearish for gold, silver, and mining stocks.
The Bottom Line
With the ‘’good news is bad news’ mantra maiming the bulls, a resilient Main Street is highly bearish for Wall Street. Moreover, with the S&P 500 and the GDXJ ETF selling off mid-day on Oct. 11, anxiety is contagious. So while the CPI release could be a ‘sell the rumor, buy the news’ event, the PMs and the S&P 500’s fundamental issues are far from solved.
In conclusion, the PMs were mixed on Oct. 11, as gold ended the day in the green. Conversely, the U.S. 10-Year real yield ended the day flat, and the USD Index delivered a similar performance. However, the Fed’s inflation fight is bullish for both metrics, and they should hit higher highs in the months ahead.
Thank you for reading our free analysis today. Please note that the above is just a small fraction of the full analyses that our subscribers enjoy on a regular basis. They include multiple premium details such as the interim targets for gold and mining stocks that could be reached in the next few weeks. We invite you to subscribe now and read today’s issue right away.
Sincerely,
Przemyslaw Radomski, CFA
Founder, Editor-in-chief -
Gold May Not Need Another Correction Before a Further Decline
October 11, 2022, 8:26 AMGold has just hit its 2021 lows and the likelihood of a fall like a decade ago remains valid. Silver and mining stocks may drop along with it.
What rises, must come down, right?
Well, not necessarily. Once an object reaches second cosmic velocity, it escapes Earth’s gravitational pull, so wherever it goes next, it won’t go “down” in the classic sense of this word. Besides, what’s “up” and “down” in space?
Enough of the fancy nerd-speak for today. Let’s move on to something that just went up, and then came back down without a bigger delay – the precious metals sector.
At the moment of writing these words, gold is not only back below $1,700 – it’s also back below its 2021 lows, and yes - it’s as bearish as it sounds.
In fact, it’s even more bearish since gold broke below those lows just a few weeks ago, as now it’s right after a very short-term correction, which means that it can easily decline much lower without yet another correction.
The analogy to 2013 clearly supports it, and my yesterday’s comments on gold’s very long-term chart remain very much up-to-date:
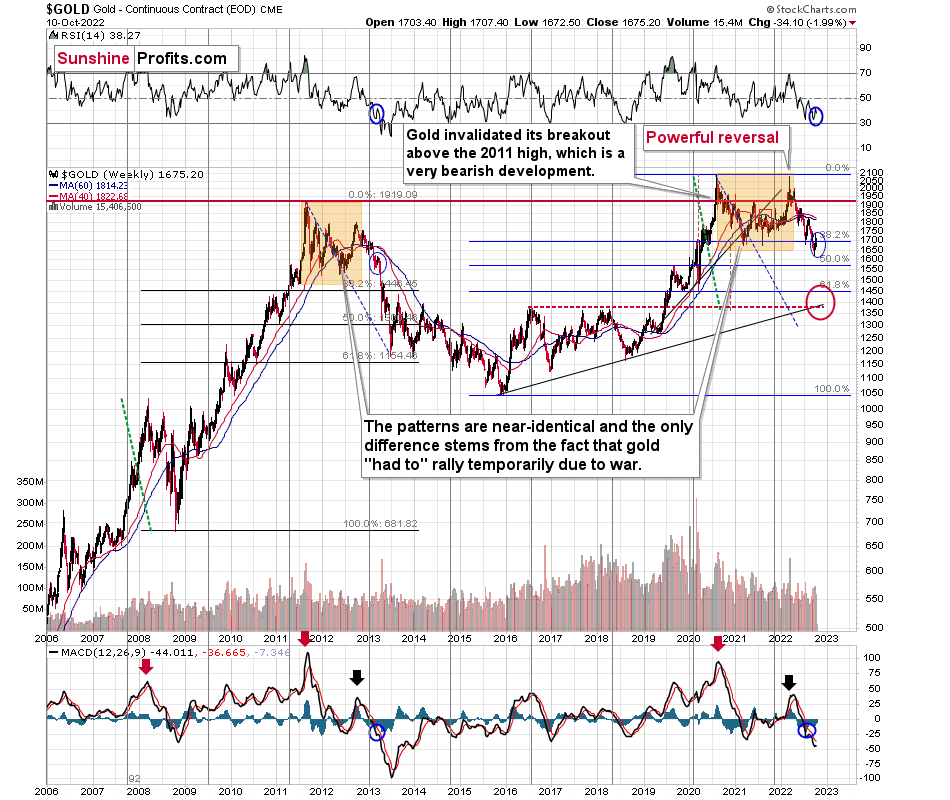
I’ve been writing about this important analogy for months, but if you haven’t read my previous analyses, please focus on the orange rectangles on the above chart – how the price behaved and what happened in the RSI and MACD indicators. The situations are near-perfectly aligned.
If you were monitoring the gold market back in April 2013, you might remember the overall feeling among gold investors and traders when gold rallied from the 2012 lows. Practically everyone and their brother were convinced that the bottom in gold is really in, and that it was about to soar to new highs.
Sort of like what we experienced recently.
However, it wasn’t the bottom. It wasn’t even the mid-point of the entire medium-term decline.
Sure, history doesn’t have to repeat itself to the letter, and the geopolitical and monetary situation now is different than it was back in 2013, but… Fear and greed work in the same way, and when people try to forecast the future by looking at previous price patterns (very few people look at the big picture; most just focus on the last year or so), they ultimately follow a similar emotional process. This leads them to repeat their past behaviors and, as a result, the price patterns continue to be similar.
Actually, the situation regarding monetary policy now supports even a more profound slide than it did back in 2013. Still, due to geopolitics, the decline could be “only” similar to what we saw back then.
There’s very strong support just a bit below $1,400, and the decline to this level (approximately) would be in tune with the size of the 2011-2013 decline.
Can gold really slide that low? Absolutely.
Will it slide there immediately? There’s a good chance we’ll have some sort of correction in the meantime, and one of them might be tradable. The rebound from the 2020 lows seems quite likely at the moment, but I’ll keep monitoring the situation and report to my subscribers accordingly. I’ll also describe which part of the precious metals sector is likely to benefit the most from this decline. At this time, it seems that junior mining stocks are likely to decline the most (as they have so far this year), but this might change as prices move lower.
Either way, the short- and medium-term outlooks for gold are bearish.
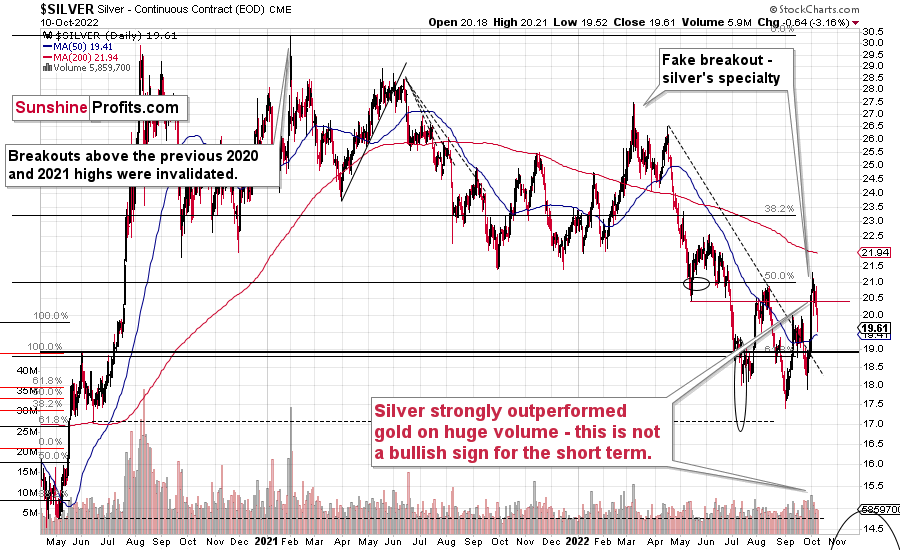
Moving to silver, we can see that it has not only invalidated its fake breakout above the August highs, but it has also invalidated a breakout above its September highs.
I warned you about silver’s “fake” nature when it comes to breakouts, and indeed it was a fake move.
What’s next? Well, what was next after silver failed its April rally? It declined from about $26 to about $18 within a few months.
Can we see a similar crash in the near term?
Yes!
The link to 2013 remains intact, and silver prices declined significantly at that time.
What about mining stocks?

In short, they are likely to decline significantly too.
I previously (in the premium version of the Oct. 5 analysis) commented on the above chart in the following way:
The GDXJ rallied sharply once again yesterday, and it reversed close to its September high. That happened slightly above the 50-day moving average. Both previous attempts to break above this moving average failed, and that’s when declines to new lows started. The same is likely right now.
Indeed, the declines started, and the move above GDXJ’s 50-day moving average was invalidated. It looks like we’re about to see another big move lower.
Let’s keep in mind that, based on the link to 2013, the next big move lower could be really big. In fact, a move to 2020 is definitely in the cards.
Why haven’t miners declined more so far? It’s probably due to the stock market’s performance – people probably still don’t believe that stocks are going to slide, but it seems that they are going to get convinced any day now.
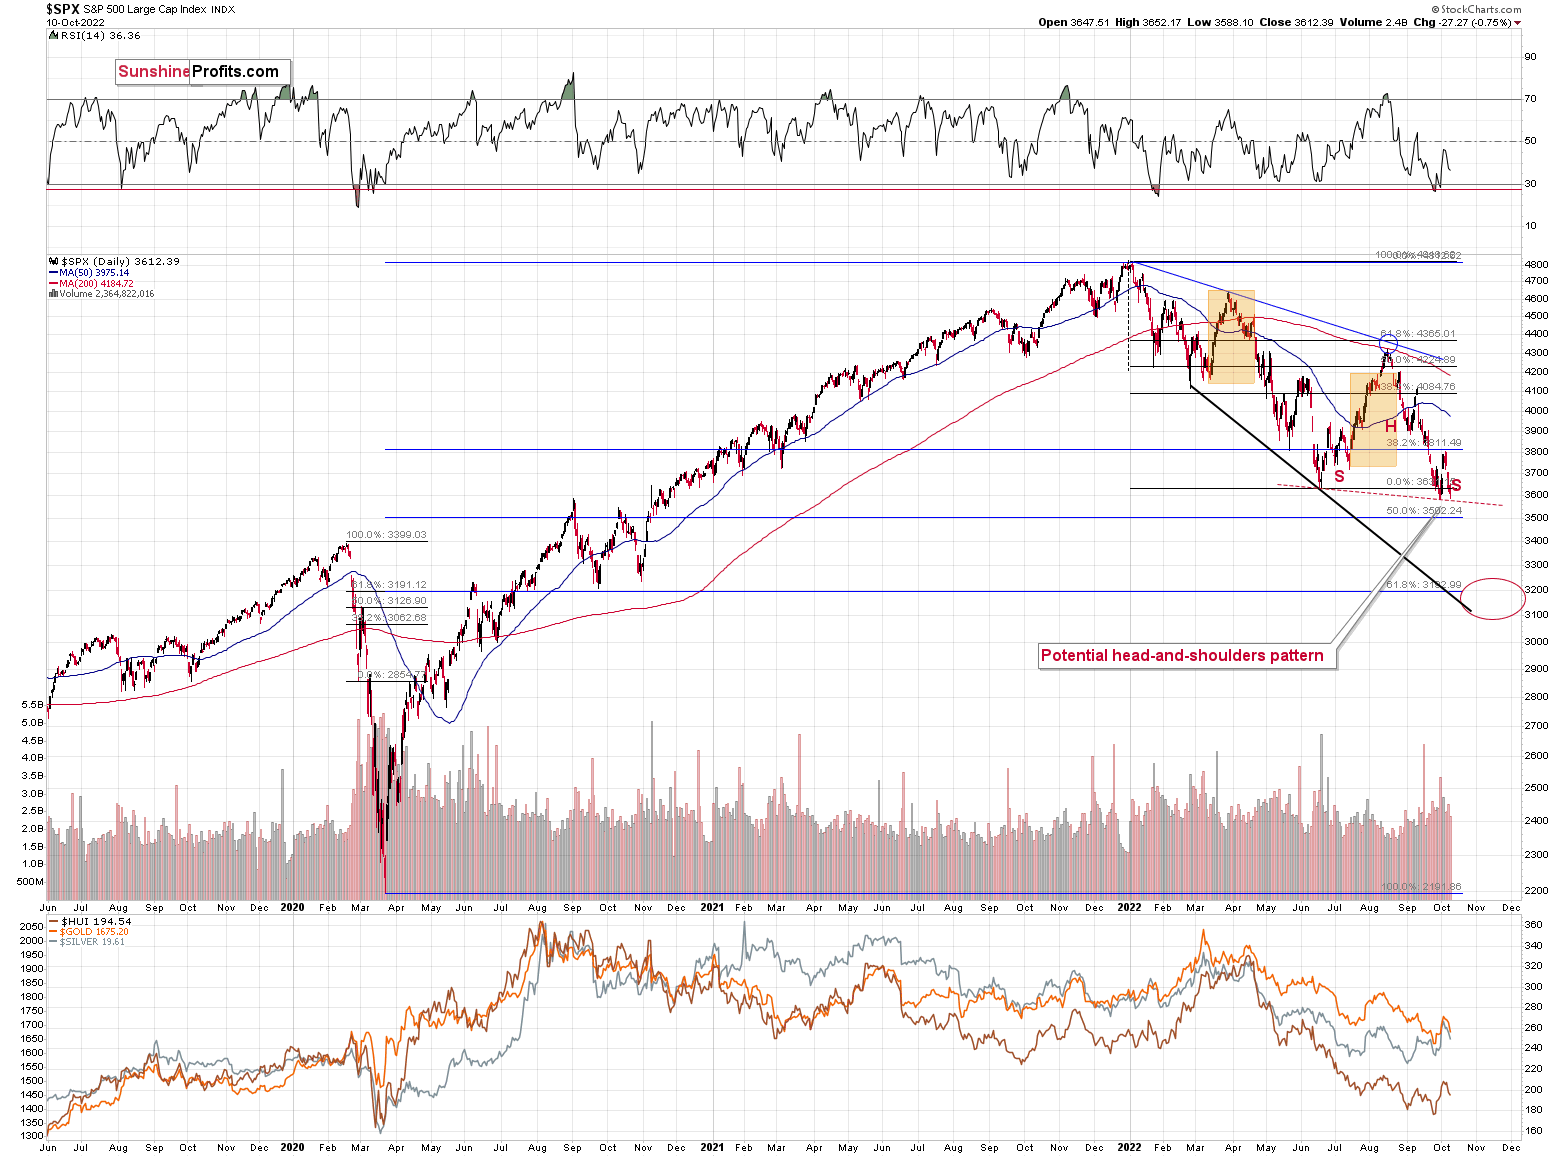
On Friday, I commented on the above chart in the following way:
Stocks rallied on the unfounded expectations of the Fed’s dovish U-turn, but it could be the case that the rally has already run its course.
The upswing was rather small, and if it is followed by another decline (and that’s likely!), it might create a very bearish head-and-shoulders pattern. This pattern would leave the door wide open to declines to the mid-2020 lows at about 3,200.
Such a decline would likely have a devastating effect on the prices of precious metals, especially silver, and mining stocks – and in particular, junior mining stocks.
As interest rates are likely to go up, the stock market is likely to go down – perhaps as low as 3,200 on a short-term basis – and then – after a correction – even lower.
If stocks decline more here, they will break below the neck level of the H&S formation, which will have very bearish effects.
Then, those who bought silver and mining stocks recently (especially juniors) are likely to drop the towel and run for the hills. That’s when the slide will likely accelerate.
As a quick reminder, silver (due to multiple industrial uses) and mining stocks (they are stocks, after all) are more closely related to the performance of the general stock market than gold.
Consequently, the bearish outlook for the precious metals sector remains intact for the coming weeks. It’s bullish in the long run, but it seems that the entire sector will need to slide first.
Thank you for reading our free analysis today. Please note that the above is just a small fraction of the full analyses that our subscribers enjoy on a regular basis. They include multiple premium details such as the interim targets for gold and mining stocks that could be reached in the next few weeks. We invite you to subscribe now and read today’s issue right away.
Sincerely,
Przemyslaw Radomski, CFA
Founder, Editor-in-chief


Gold Investment News
Delivered To Your Inbox
Free Of Charge
Bonus: A week of free access to Gold & Silver StockPickers.
Gold Alerts
More-
Status
New 2024 Lows in Miners, New Highs in The USD Index
January 17, 2024, 12:19 PM -
Status
Soaring USD is SO Unsurprising – And SO Full of Implications
January 16, 2024, 8:40 AM -
Status
Rare Opportunity in Rare Earth Minerals?
January 15, 2024, 2:06 PM

