

Briefly: in our opinion, full (300% of the regular position size) speculative short positions in junior mining stocks are justified from the risk/reward point of view at the moment of publishing this Alert.
Did you see the huge daily rally in silver? Some (inexperienced) traders will say it’s bullish, but based on over a decade of experience with the precious metals sector, I know that it’s rarely bullish when silver soars while gold doesn’t. That’s exactly what we saw yesterday.
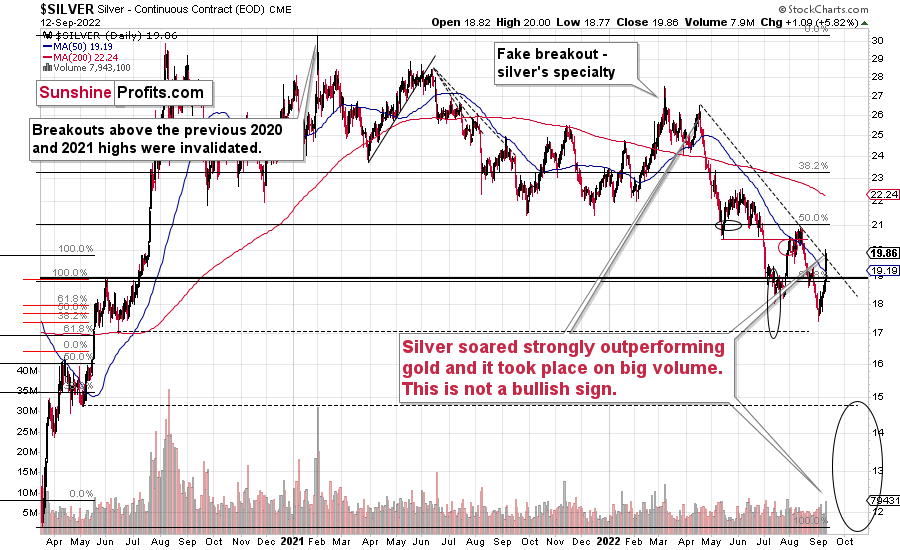
Silver prices jumped by almost 6% during a single session. The volume was one of the biggest that we’ve seen this year, and biggest that we’ve seen since the beginning of August. Silver stopped at its declining, medium-term resistance line, but even if it moved slightly above it, it wouldn’t really matter, as the white metal is known for fake breakouts (“fakeouts”) right before bigger declines.
Since – based on the analogy to what we saw in 2013 – the precious metals market is likely right before a huge slide, the recent price action in silver is even less bullish. In fact, it perfectly fits this extremely bearish medium-term narrative.
Now, huge daily run-ups in silver are suspicious on their own, but it’s particularly so when they are taking place along with a lack of analogous action in gold.
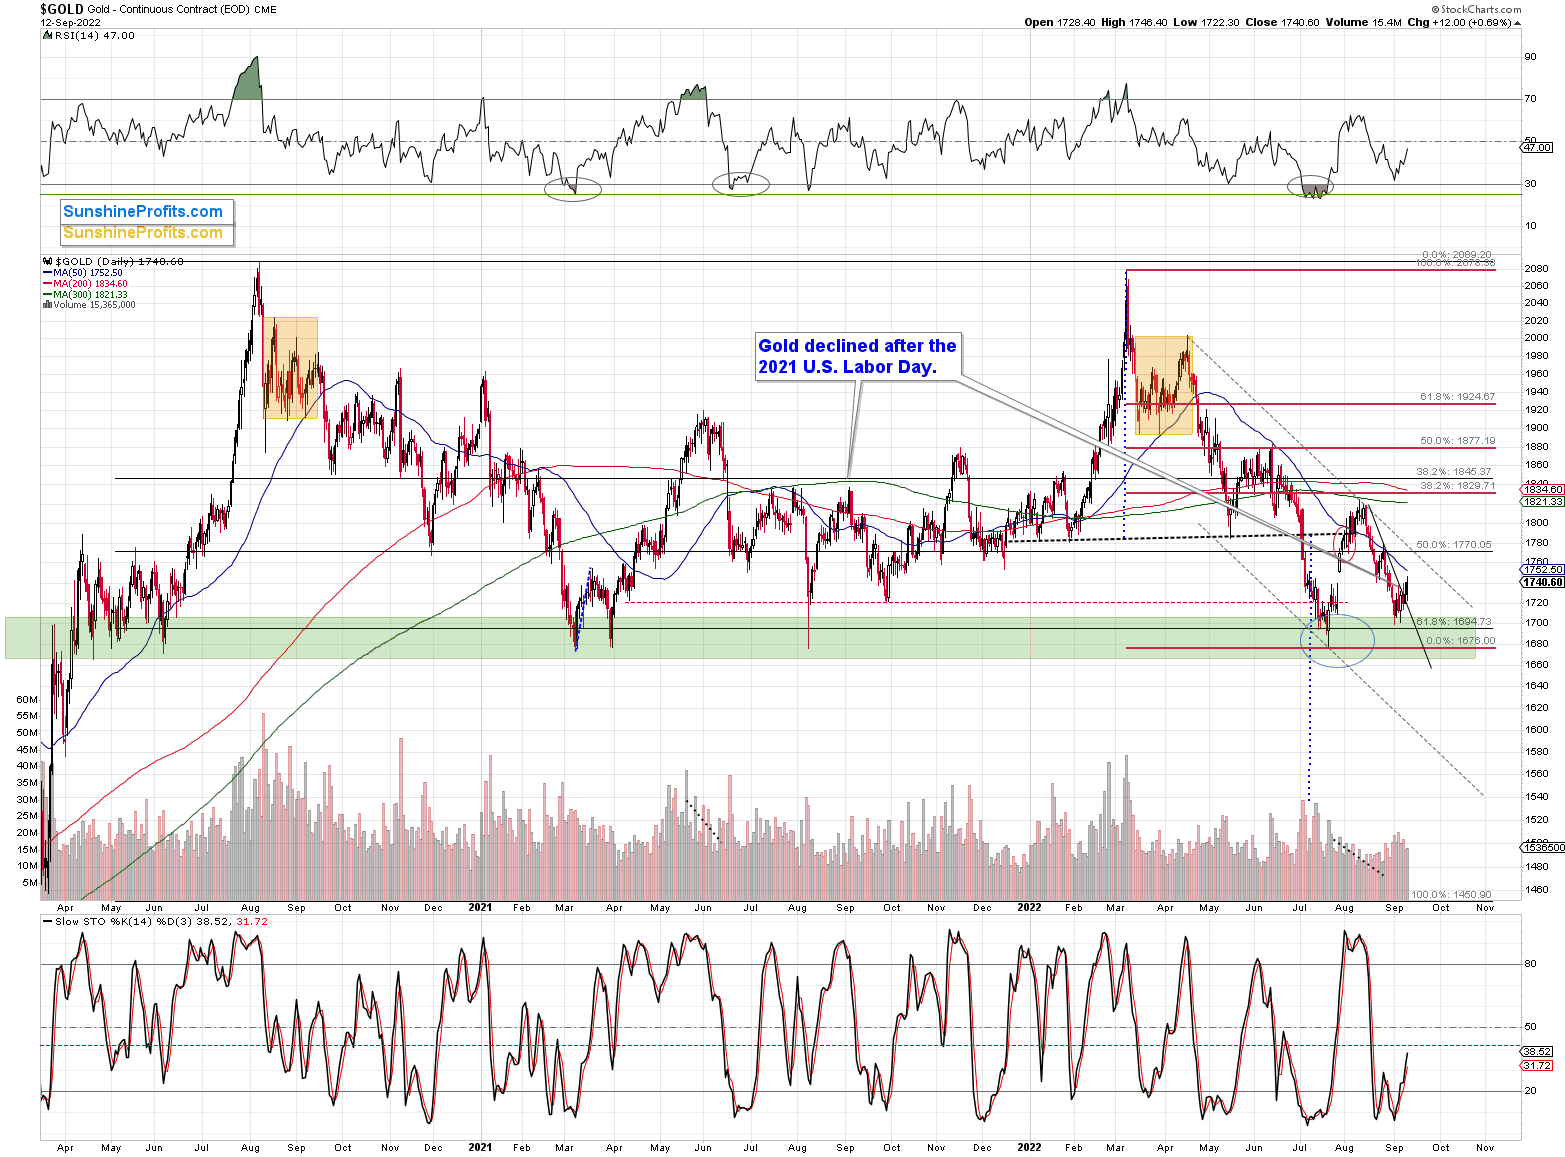
Gold was up by less than 1% yesterday, so it’s clearly the case that silver is outperforming gold on a very short-term basis.
In the case of the flagship precious metal, nothing really changed yesterday. It moved higher by $12 yesterday, but compared to what the USD Index did, it was “small potatoes.”
In yesterday’s analysis, I wrote the following about the USD Index’s short-term performance:
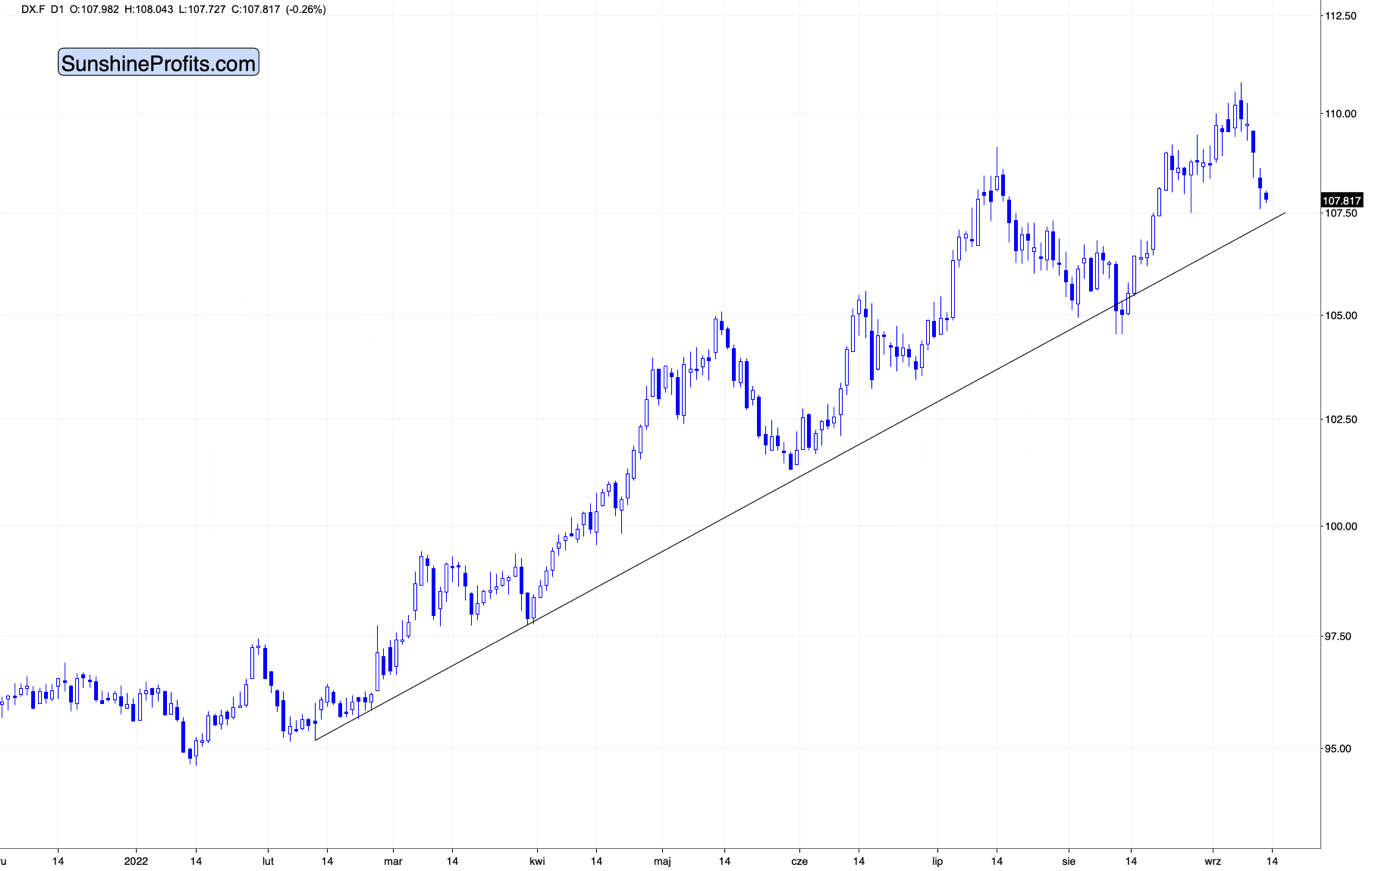
From the short-term point of view, the USD Index declined substantially today (likely the safe-haven demand decline based on the counter-offensive in Ukraine, which suggests that the war might be close to its end, and Russia could be on the losing side thereof), and it’s about to reach its rising support line.
This line kept the declines in check for months, so it’s quite likely that it will stop the declining prices also this time.
While the USD Index declined substantially in today’s pre-market trading (about 1.2%), did gold’s price rally substantially?
No. It’s up by just 0.38% so far today. (And silver’s price is up by over 1.6%, which means that it’s outperforming gold on an immediate-term basis – something that we often see right before bigger declines.)
So, we have a situation where gold doesn’t really want to rally based on the USD’s decline, and that’s bearish for gold, especially since the support for the USD Index appears to be just around the corner.
Also, regardless of the immediate-term effects on forex prices, please consider the following. If the situation in Ukraine stabilizes and things get back to the way they were before, at least in terms of borders (or Ukraine claims Crimea back), it means undoing a lot of what happened based on those changes in the past, right? And gold rallied in response to both events – the invasion of Crimea and the invasion of the rest of Ukraine. So, it could decline as things stabilize – mainly because the safe-haven demand wanes.
While gold prices moved higher after I wrote the above, they didn’t move substantially higher, but silver did . Overall, based on the relative valuations, the indications got more bearish during the session.
What about junior mining stocks?
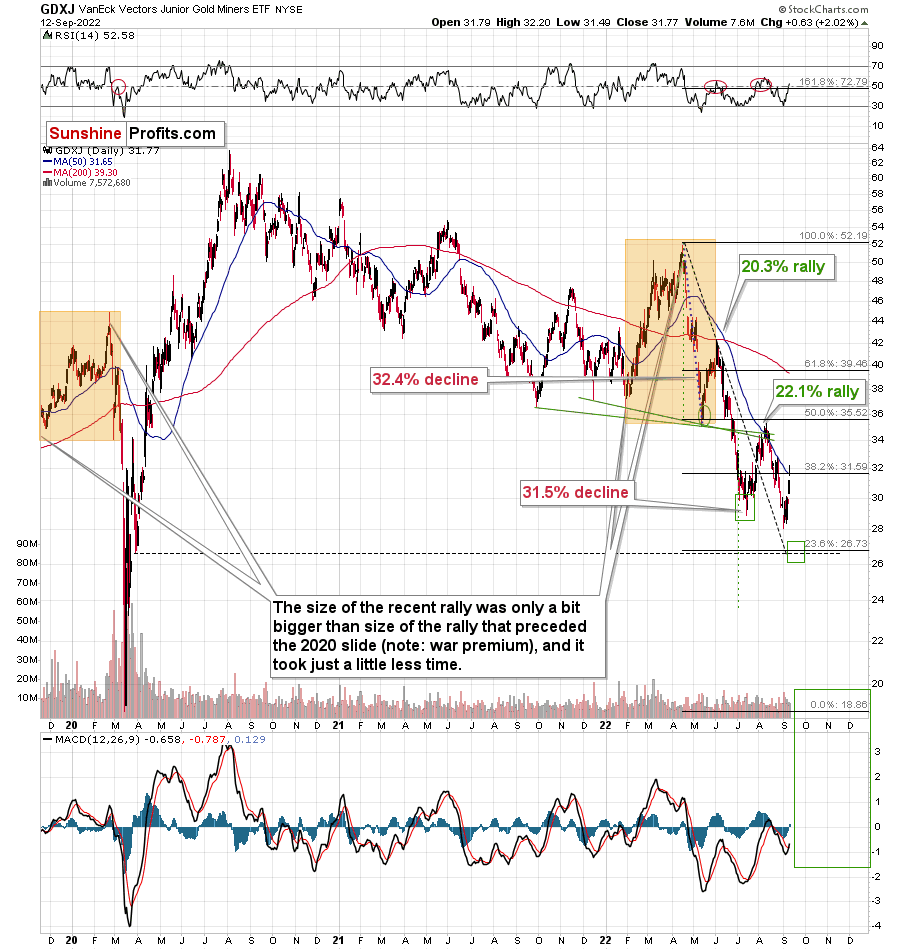
They moved higher as they were practically forced to by rallying gold, but please note that they ended the day only 2% higher, which is very little compared to silver’s almost 6% rally.
Plus, please note that junior miners reversed some of their earlier gains before the end of the session.
Interestingly, the GDXJ just approached its 50-day moving average, which means the end of previous counter-trend rallies ever since the April 2022 top.
This ~$4 rally fits the final counter-trend rally that we saw in 2013.
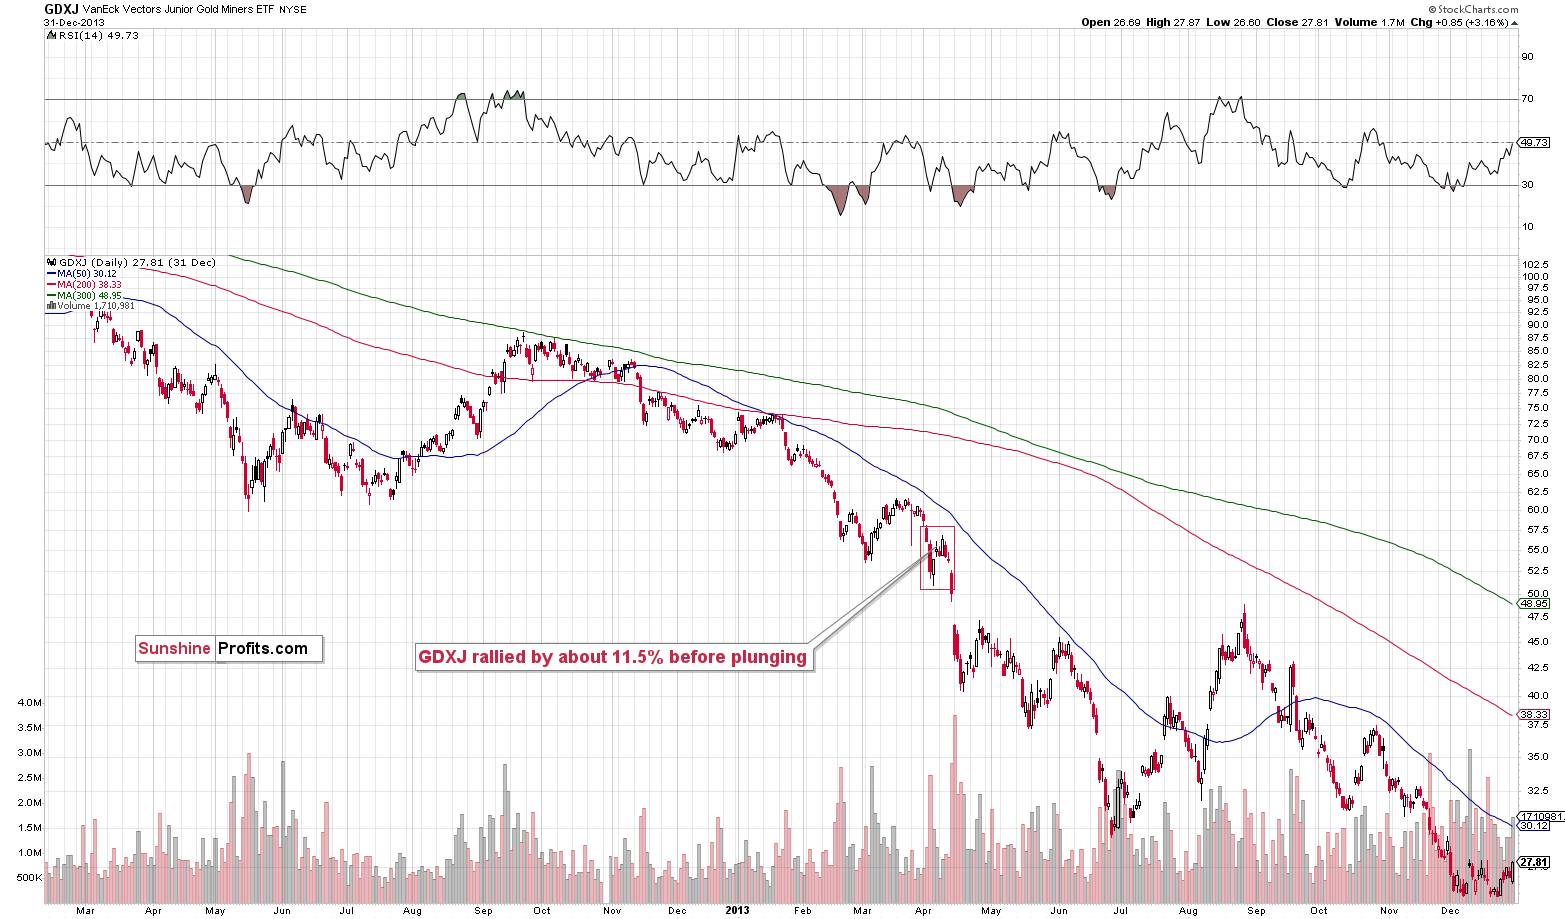
The GDXJ rallied by about 14.7% from its recent low.
Back in 2013, the GDXJ rallied by about 11.5% before plunging.
This time, the corrective rally is bigger, but please note that the decline that we saw beforehand was sharper than what we saw in 2013. Consequently, a bigger bounce is normal.
It’s even more interesting to compare the rally to the previous price movement. In both bases, the GDXJ corrected about half of the preceding short-term rally, and it moved above the most recent short-term low. This is exactly what we saw recently.
This is yet another indication that what we’re seeing right now is a part of a bigger pattern that’s very bearish.
One might focus on the last few days on a stand-alone basis and claim that “the rally is bullish”, but in my opinion, this narrow focus might be very costly.
Having said that, let’s take a look at the markets from a more fundamental point of view.
Realigned Positioning
With risk assets attempting to squeeze their way back to relevancy, the GDXJ ETF and the S&P 500 have exuded optimism in recent days. However, with their uprisings a function of positioning and not fundamentals, the price action confronting gold, silver and mining stocks is much less bullish than it seems.
For example, the prior sell-off culminated with CTAs dumping stocks at a furious rate. In a nutshell: they were unloading positions near the short-term bottom.
Please see below:
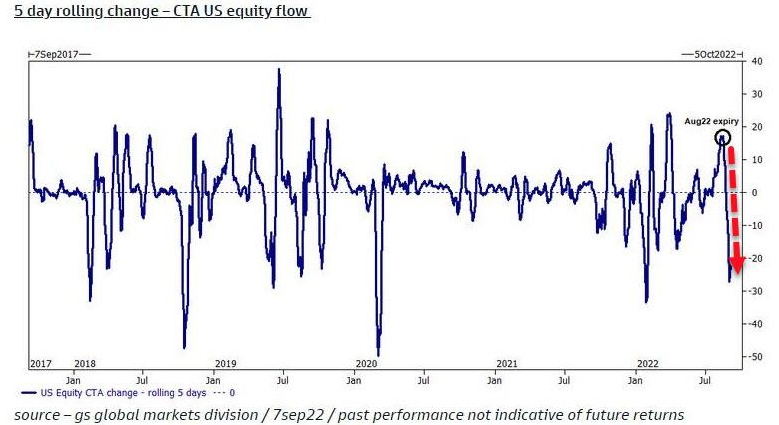
To explain, the blue line above tracks the rolling five-day change in U.S. CTA fund flows. If you analyze the right side of the chart, you can see that flows turned sharply negative in late August/early September as CTAs exited their longs and increased their shorts. As a result, their activity helped accelerate the downside momentum.
However, when sentiment shifted and the momentum turned, the flurry of short-covering helped uplift risk assets like the GDXJ ETF, the S&P 500 and even risk-on currencies like the euro.
Please see below:
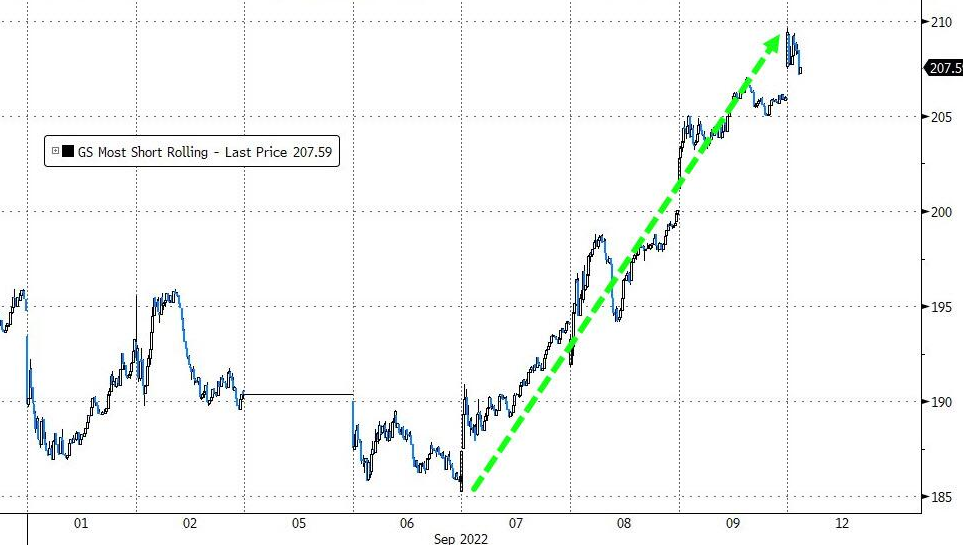 Source: Bloomberg/ZeroHedge
To explain, the blue line above tracks Goldman Sachs’ Most Shorted Basket. If you analyze the sharp move higher in September, it helps explain why the riskiest assets have been the best performers.
More importantly, the squeeze portion of the rally may have already run its course. Charlie McElligott, Head of Cross-Asset Macro Strategy at Nomura, noted on Sep. 12 that much of the positioning imbalance has been reversed. He wrote:
“US Equities Index / ETF Options positioning, which is seeing Puts burned and Calls move ITM, where the ‘fuel for melt-up’ from what had been EXTREME Negative $Delta and Dealer ‘Short Gamma vs. Spot’ of just 3.5 days ago has been absolutely eviscerated, with a TON of Positive $Delta ADDED and SPXSPY and QQQ both back ‘Long Gamma’ territory.”
For clarity, what had been a story of pessimism and put options has turned into one of optimism and call options.
Please see below:
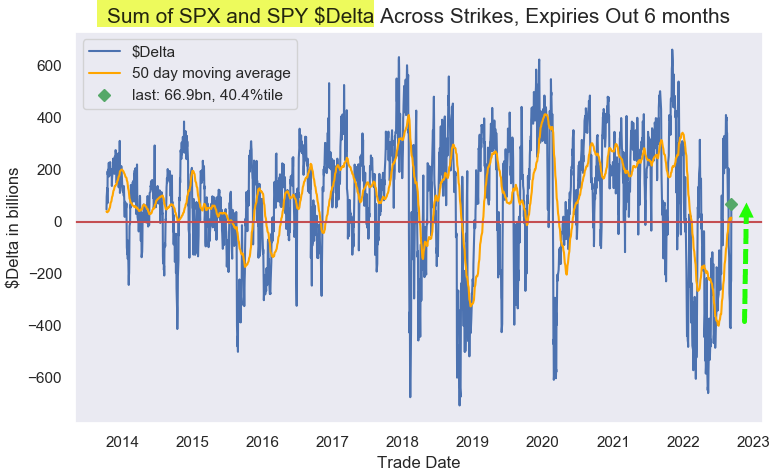 Source: Nomura
To explain, the blue line above tracks the six-month option positioning across the S&P 500 and the SPY ETF. If you analyze the right side of the chart, you can see that Delta was extremely negative, which signals that investors were overwhelmingly short. However, the blue line has shot materially higher and is now in positive territory. Therefore, options traders are positioned for further upside as they continue to chase S&P 500 highs and lows.
As a result, with short covering largely out of the way, further upside has to be driven by long purchases; and with the fundamental outlook continuing to worsen, investors are unlikely to find much comfort in the bearish environment that lies ahead.
To that point, Morgan Stanley noted over the weekend that the interest rate on a 10-year investment-grade corporate bond (BBB) now exceeds the S&P 500’s earnings yield. Moreover, this hasn’t occurred since 2010.
For context, the earnings yield is calculated by dividing the S&P 500’s earnings per share (EPS) by its price per share. In addition, corporate bonds are senior in the capital structure to equities, so obtaining a higher yield with less risk highlights the S&P 500’s fundamental unattractiveness.
Please see below:
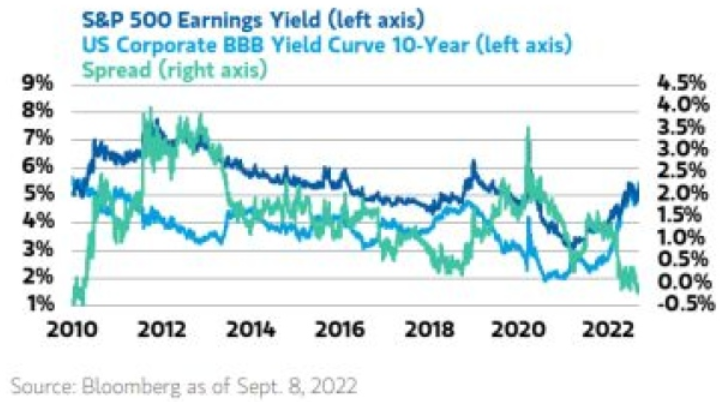
To explain, the dark blue line above tracks the S&P 500’s earnings yield, while the light blue line above tracks the interest rate on a 10-year investment-grade corporate bond. Likewise, the green line above tracks the spread between the two.
If you analyze the right side of the chart, you can see that the green line has turned negative for the first time since 2010. As such, while the bulls attempt to rationalize why higher equity prices are justified, the tradeoff is unattractive when you can earn a higher return with less risk elsewhere.
Furthermore, with the back half of September often notoriously bearish, the recent price action has followed the seasonal trends quite well. For context, I wrote on Sep. 6:
Seasonality also paints an ominous portrait of the back half of the month.
Please see below:
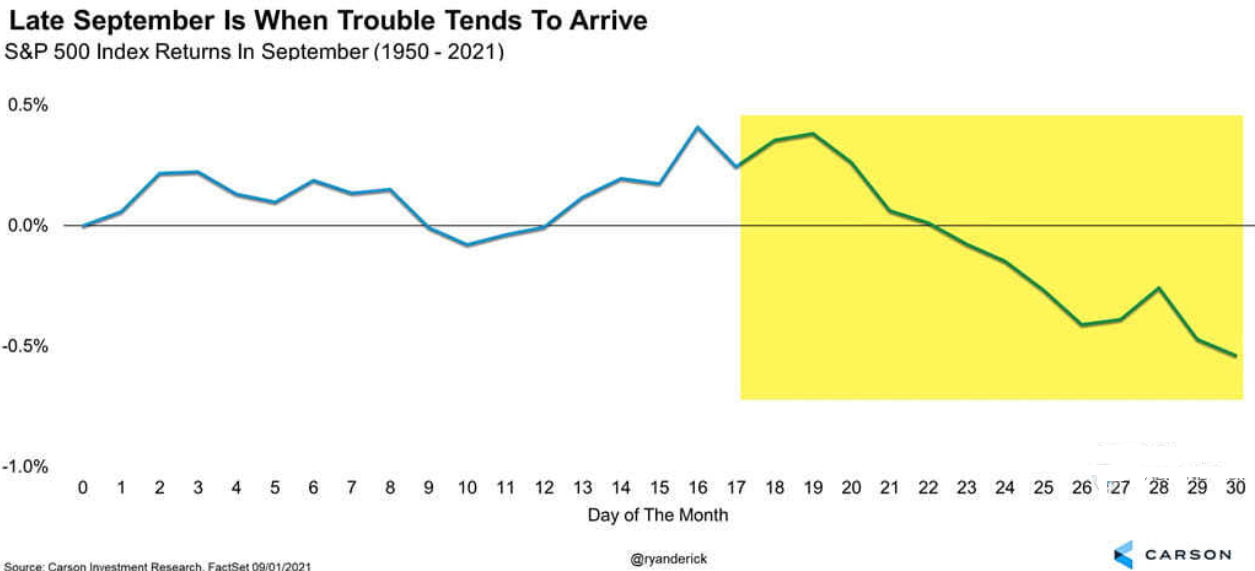
To explain, the blue line above tracks the S&P 500’s seasonality trend in September. If you analyze the left side of the chart, you can see that optimism often peaks at mid-month. Thus, while the bulls may put on brave faces over the next couple of weeks, their optimism should turn to pessimism as the month unfolds.
The Fed’s Bind
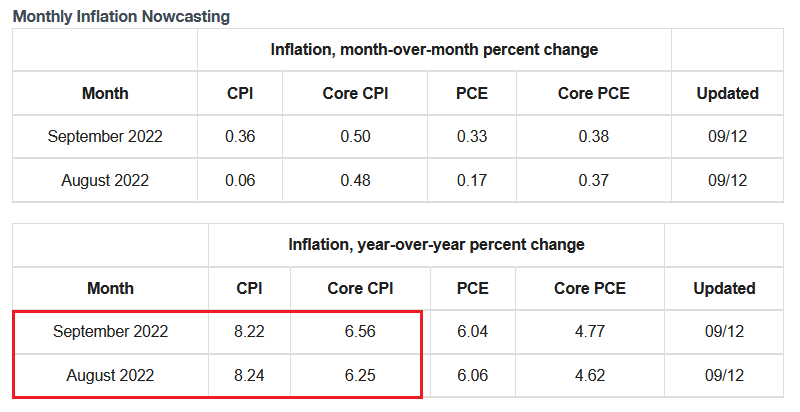
With the Consumer Price Index (CPI) scheduled for release today, another month of relative inactivity should be present. However, while investors assume that “peak inflation” means problem solved, the reality is that normalizing the metric will be much more difficult than the consensus expects.
Please see below:
 Source: Cleveland Fed
To explain, the various figures above represent the Cleveland Fed’s projections for August and September’s inflation data. If you analyze the red box, you can see that the researchers expect the headline and core CPIs to remain above 8% and 6% year-over-year (YoY), respectively.
As such, while energy prices have declined and poor commodity performance has alleviated some of the pricing pressures, the reality is that progress is moving at a snail’s pace. Thus, the consensus underestimates the amount of work the Fed needs to do to achieve material inflation progress.
Speaking of which, Mastercard released its SpendingPulse U.S. retail sales report on Sep. 12. An excerpt read:
“The holiday season builds on the momentum seen this summer, with U.S. retail sales excluding automotive in August up +11.7% YoY and +20.4% compared to 2019. Online sales in August grew +8.9% and +100.2% respectively, compared to the same periods. Experiential sectors in particular – including Restaurants, Airlines and Lodging – saw strong double-digit growth.”
Please see below:
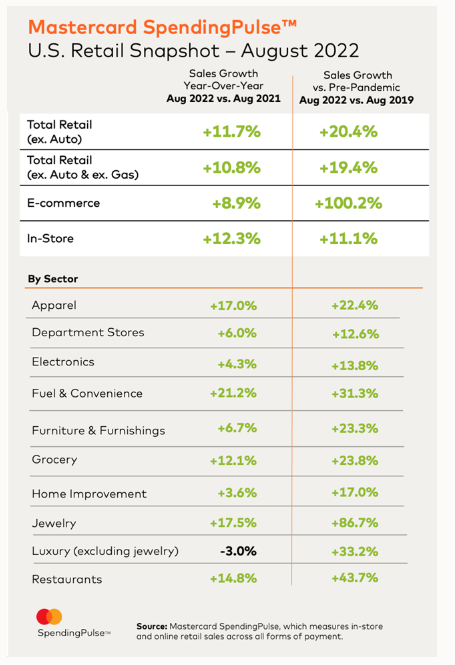
Thus, with U.S. consumers continuing to splurge on their favorite items, we’re nowhere near the demand destruction that would alleviate inflation. Moreover, while I’ve warned repeatedly that investors miscalculated the demand side of the inflation equation, Mastercard’s spending data highlights why the Fed’s fight will be so difficult.
For context, please note that the results depict in-store and online spending “across all forms of payment.” Therefore, it’s not just Americans swiping their credit cards.
On top of that, Mastercard estimates that holiday retail sales will remain resilient.
Please see below:
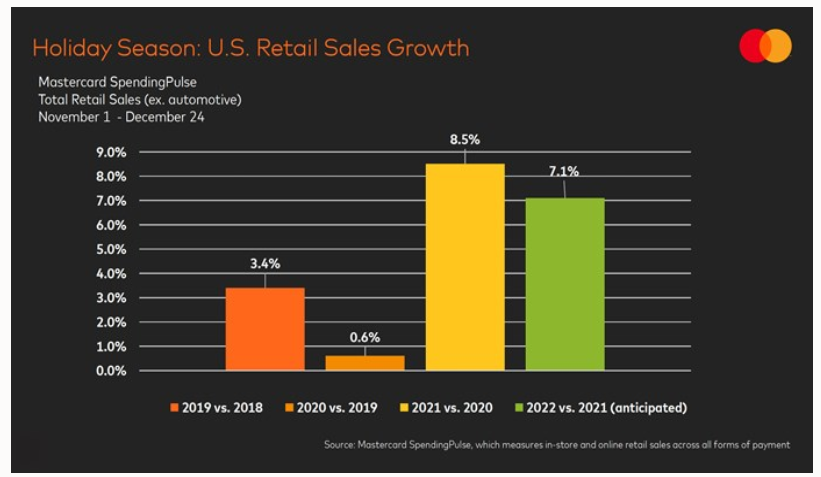
To explain, the green bar above shows that Mastercard expects holiday retail sales to increase by 7.1% YoY in 2022. Moreover, while the estimate is below 2021, it’s still well above the figures realized in 2020 and 2019. As a result, does it seem like the U.S. federal funds rate (FFR) is anywhere near neutral?
To that point, Michelle Meyer, U.S. Chief Economist at the Mastercard Economics Institute, said:
“This holiday season, consumers may find themselves looking for ways to navigate the inflationary environment – from searching for deals to making trade-offs that allow for extra room in their gift-giving budgets. New job creation, rising wages, and lingering savings should have many consumers ready and able to spend.”
As such, while I warned that the Fed’s inflation fight would be one of attrition, the minimal impact of higher interest rates on consumer spending highlights why the FFR needs to move much higher. Furthermore, the Atlanta Fed’s Wage Growth Tracker remains at an all-time high, and as long as Americans have a recurring paycheck, they will continue to spend.
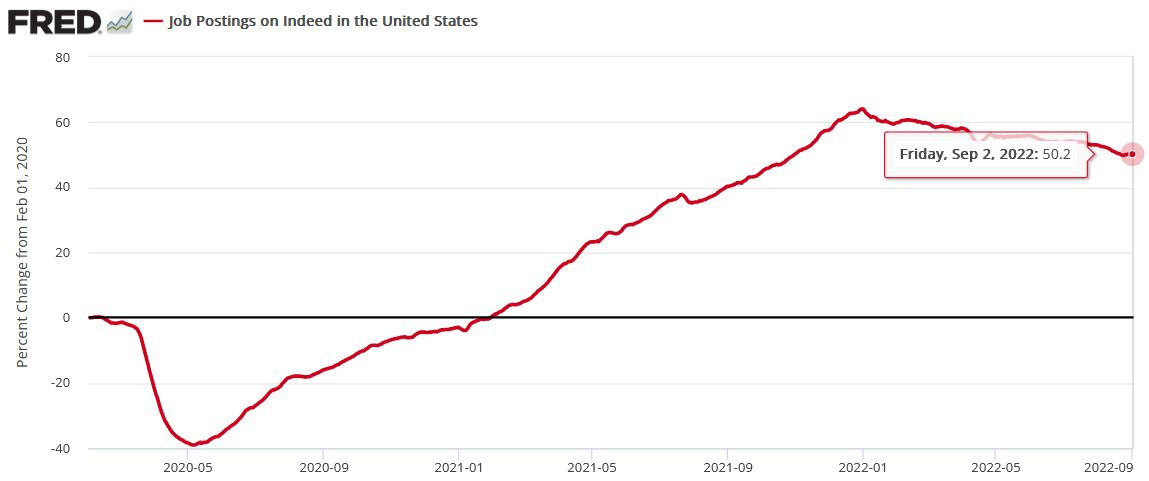
As further evidence, Indeed updated its job postings data on Sep. 12. Moreover, with employment opportunities still 50.2% more abundant than pre-pandemic (as of the week ending Sep. 2), the U.S. labor market has not fallen off a cliff. Therefore, with jobs, wages, and consumer spending still extremely resilient, the Fed’s 2022 rate hikes have done little to derail the primary drivers of inflation.
The Bottom Line
While short squeezes are far from fun, several have occurred throughout 2022, and prior iterations did not stop the GDXJ ETF from hitting new lows. Furthermore, sentiment can only drive the PMs' performances so far. For example, risk assets are like cars, while the technicals and the fundamentals are like gasoline. While sentiment can provide the initial push, the momentum fizzles when the technicals and the fundamentals run dry. Thus, with the pair still resoundingly bearish, the PMs are unlikely to make any real progress until the Fed turns dovish and the long-term charts turn bullish.
In conclusion, the PMs rallied on Sep. 12, as the CTA rebalancing continued. Moreover, while the USD Index pulled back amid the risk frenzy, the U.S. 10-Year real yield hit a new 2022 high of 0.95%. As a result, while it may seem like the bull is back on Wall Street, the reality is that the fundamentals don't support the enthusiasm.
Overview of the Upcoming Part of the Decline
- It seems to me that the corrective upswing is over, and that the next big move lower is already underway. We’re probably seeing the final small corrective upswing right now.
- If we see a situation where miners slide in a meaningful and volatile way while silver doesn’t (it just declines moderately), I plan to – once again – switch from short positions in miners to short positions in silver. At this time, it’s too early to say at what price levels this could take place and if we get this kind of opportunity at all – perhaps with gold prices close to $1,600.
- I plan to exit all remaining short positions once gold shows substantial strength relative to the USD Index while the latter is still rallying. This may be the case with gold prices close to $1,400. I expect silver to fall the hardest in the final part of the move. This moment (when gold performs very strongly against the rallying USD and miners are strong relative to gold after its substantial decline) is likely to be the best entry point for long-term investments, in my view. This can also happen with gold close to $1,400, but at the moment it’s too early to say with certainty.
- The above is based on the information available today, and it might change in the following days/weeks.
You will find my general overview of the outlook for gold on the chart below:
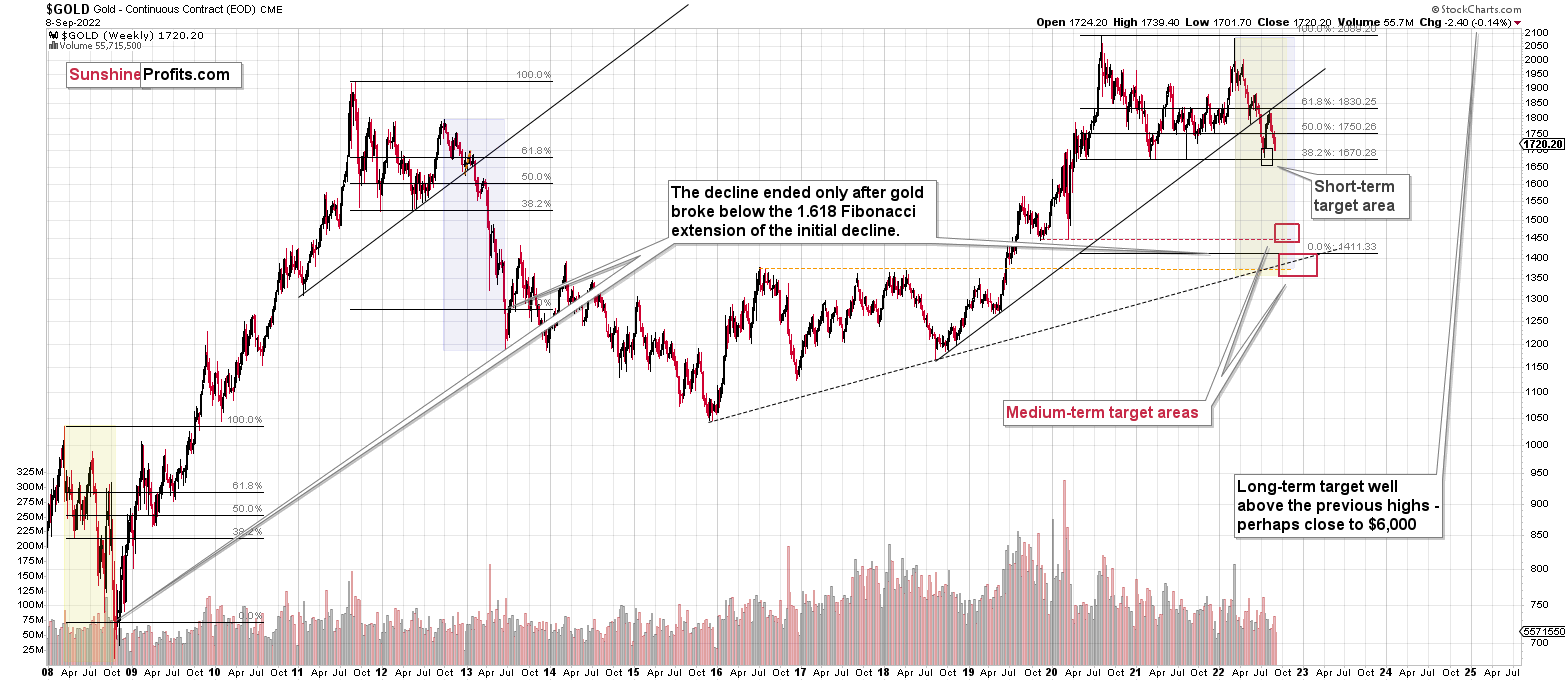
Please note that the above timing details are relatively broad and “for general overview only” – so that you know more or less what I think and how volatile I think the moves are likely to be – on an approximate basis. These time targets are not binding nor clear enough for me to think that they should be used for purchasing options, warrants, or similar instruments.
Summary
Summing up, it seems that the corrective upswing is over or is about to be over, which means that the powerful medium-term downtrend can resume any day now – the current corrective upswing simply appears to be of a very short-term nature. And based on the analogy to 2013, it seems that the next wave down might be really spectacular.
You have been profiting from how this situation develops practically throughout the entire year, and the above indicates (I’m not making any guarantees, of course) that the biggest gains are likely just ahead.
After the final sell-off (that takes gold to about $1,350-$1,500), I expect the precious metals to rally significantly. The final part of the decline might take as little as 1-5 weeks, so it's important to stay alert to any changes.
As always, we'll keep you – our subscribers – informed.
To summarize:
Trading capital (supplementary part of the portfolio; our opinion): Full speculative short positions (300% of the full position) in junior mining stocks are justified from the risk to reward point of view with the following binding exit profit-take price levels:
Mining stocks (price levels for the GDXJ ETF): binding profit-take exit price: $20.32; stop-loss: none (the volatility is too big to justify a stop-loss order in case of this particular trade)
Alternatively, if one seeks leverage, we’re providing the binding profit-take levels for the JDST (2x leveraged). The binding profit-take level for the JDST: $29.87; stop-loss for the JDST: none (the volatility is too big to justify a SL order in case of this particular trade).
For-your-information targets (our opinion; we continue to think that mining stocks are the preferred way of taking advantage of the upcoming price move, but if for whatever reason one wants / has to use silver or gold for this trade, we are providing the details anyway.):
Silver futures downside profit-take exit price: $12.32
SLV profit-take exit price: $11.32
ZSL profit-take exit price: $79.87
Gold futures downside profit-take exit price: $1,504
HGD.TO – alternative (Canadian) 2x inverse leveraged gold stocks ETF – the upside profit-take exit price: $19.87
HZD.TO – alternative (Canadian) 2x inverse leveraged silver ETF – the upside profit-take exit price: $49.87
Long-term capital (core part of the portfolio; our opinion): No positions (in other words: cash)
Insurance capital (core part of the portfolio; our opinion): Full position
Whether you’ve already subscribed or not, we encourage you to find out how to make the most of our alerts and read our replies to the most common alert-and-gold-trading-related-questions.
Please note that we describe the situation for the day that the alert is posted in the trading section. In other words, if we are writing about a speculative position, it means that it is up-to-date on the day it was posted. We are also featuring the initial target prices to decide whether keeping a position on a given day is in tune with your approach (some moves are too small for medium-term traders, and some might appear too big for day-traders).
Additionally, you might want to read why our stop-loss orders are usually relatively far from the current price.
Please note that a full position doesn't mean using all of the capital for a given trade. You will find details on our thoughts on gold portfolio structuring in the Key Insights section on our website.
As a reminder - "initial target price" means exactly that - an "initial" one. It's not a price level at which we suggest closing positions. If this becomes the case (as it did in the previous trade), we will refer to these levels as levels of exit orders (exactly as we've done previously). Stop-loss levels, however, are naturally not "initial", but something that, in our opinion, might be entered as an order.
Since it is impossible to synchronize target prices and stop-loss levels for all the ETFs and ETNs with the main markets that we provide these levels for (gold, silver and mining stocks - the GDX ETF), the stop-loss levels and target prices for other ETNs and ETF (among other: UGL, GLL, AGQ, ZSL, NUGT, DUST, JNUG, JDST) are provided as supplementary, and not as "final". This means that if a stop-loss or a target level is reached for any of the "additional instruments" (GLL for instance), but not for the "main instrument" (gold in this case), we will view positions in both gold and GLL as still open and the stop-loss for GLL would have to be moved lower. On the other hand, if gold moves to a stop-loss level but GLL doesn't, then we will view both positions (in gold and GLL) as closed. In other words, since it's not possible to be 100% certain that each related instrument moves to a given level when the underlying instrument does, we can't provide levels that would be binding. The levels that we do provide are our best estimate of the levels that will correspond to the levels in the underlying assets, but it will be the underlying assets that one will need to focus on regarding the signs pointing to closing a given position or keeping it open. We might adjust the levels in the "additional instruments" without adjusting the levels in the "main instruments", which will simply mean that we have improved our estimation of these levels, not that we changed our outlook on the markets. We are already working on a tool that would update these levels daily for the most popular ETFs, ETNs and individual mining stocks.
Our preferred ways to invest in and to trade gold along with the reasoning can be found in the how to buy gold section. Furthermore, our preferred ETFs and ETNs can be found in our Gold & Silver ETF Ranking.
As a reminder, Gold & Silver Trading Alerts are posted before or on each trading day (we usually post them before the opening bell, but we don't promise doing that each day). If there's anything urgent, we will send you an additional small alert before posting the main one.
Thank you.
Przemyslaw Radomski, CFA
Founder, Editor-in-chief

