

Briefly: in our opinion, full (300% of the regular position size) speculative short positions in junior mining stocks are justified from the risk/reward point of view at the moment of publishing this Alert.
If you read my yesterday’s and/or Friday’s analyses, you know that the markets expect the rates to be increased by at least 0.75% this week. As they are increased by 0.75%, some market participants are likely to be surprised, and the overall implications could be bullish for the stock market and for other markets (including junior miners).
The above could be preceded by a powerful slide. The thing is that this huge slide has not happened so far this week. This means that perhaps the markets want to react in a different way. Please remember that no matter how well-researched a given forecast is, there’s no guarantee that it will be realized. It’s best to keep one’s eyes open and adjust the forecast frequently, based on new information.
In the current situation, the “new information” is that the decline in precious metals and stocks is not materializing this week.
This suggests that the markets might want to react differently than I described them in my recent analyses.
So, I’ve been thinking if there’s a way for the situation to develop in line with 2013 that doesn’t involve immediate decline, but at the same time makes sense in light of the upcoming rate hike.
I found such a scenario.
First of all, history doesn’t have to repeat itself to the letter, but rather it can rhyme. So, while the decline materialized immediately after similar price patterns in 2013, a 1 or 2 week of delay doesn’t change much, if anything, in the case of the analogy.
Second, I think I focused too much on the stock market’s performance in connection with the midterm elections in the US. Voters are most concerned with inflation. Period.
Consequently, instead of some kind of dovish message from the Fed, we could get a hawkish one in order to make people think that the powers that be are pushing hard to fight inflation.
In fact, if the stock market declines now, before the elections, but the powers that be can brag about some inflationary success, it could be framed as a situation in which “the people” are most important and “the wealthy” are made to help “the people.” After all, stocks are mostly owned by the wealthy, and inflation is a concern for everyone (but many research papers point to lower-income families being hit hardest).
So, actually, it might make sense to now hit hard on inflation at the stock market’s expense.
The third and final point here is that the markets sometimes wait before a certain announcement before they get back to their original trends. We’ve seen this numerous times in the precious metals market. In this case, sometimes it doesn’t even matter what the news is – the key thing is that the tension and uncertainty regarding the news is gone once it’s announced.
Combining all the above provides us with a scenario in which not much happens until Wednesday’s rate hike announcement, and then, regardless of the initial reaction, the big decline in the precious metals market continues. And yes, the “initial reaction” could mean that we’d get a 1-2 day (or so) rally.
Let’s check how this fits the GDXJ’s and gold’s charts.
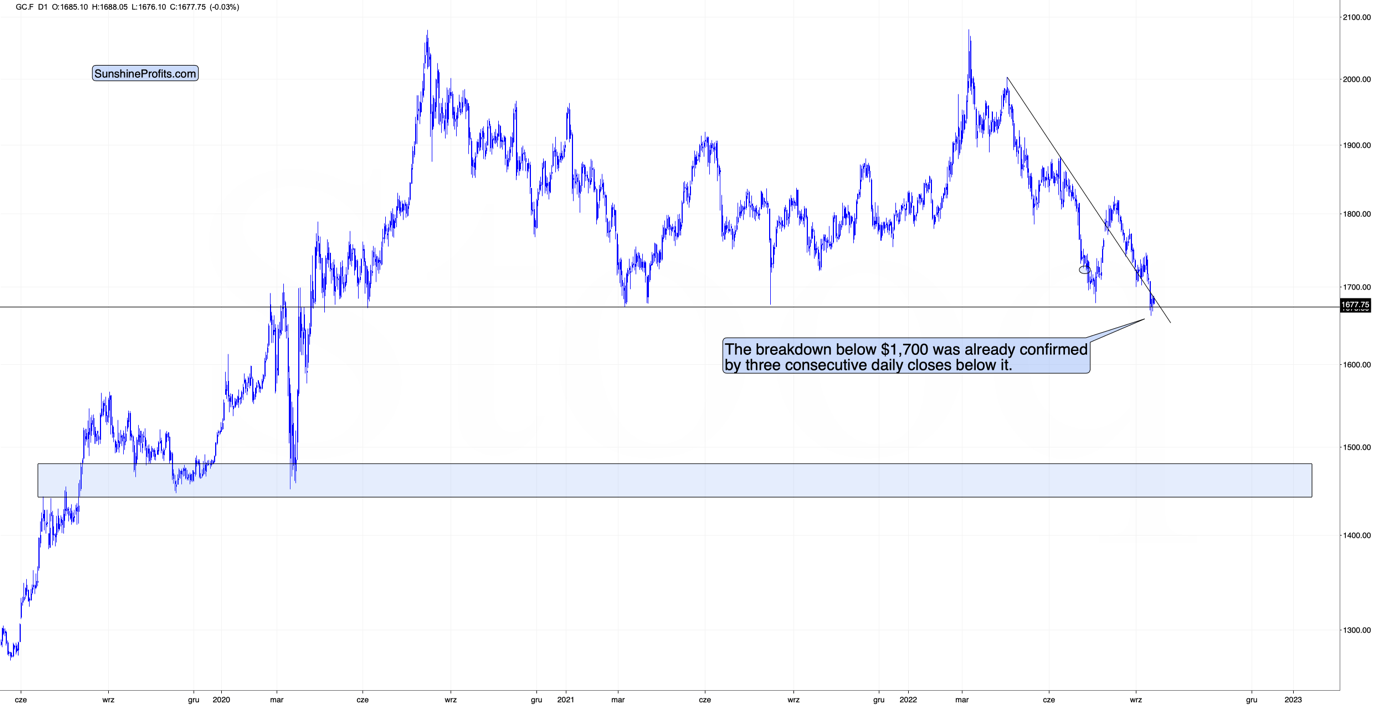
Gold is consolidating below $1,700. It closed below this level for three consecutive trading days, and we saw a weekly close below this level. This has not happened previously. Each attempt to break back below this level (since 2020) was quickly invalidated.
This time is already different.
Technically, this is extremely bearish.
So, why doesn’t gold slide from here? Probably due to the uncertainty surrounding the interest rate hike.
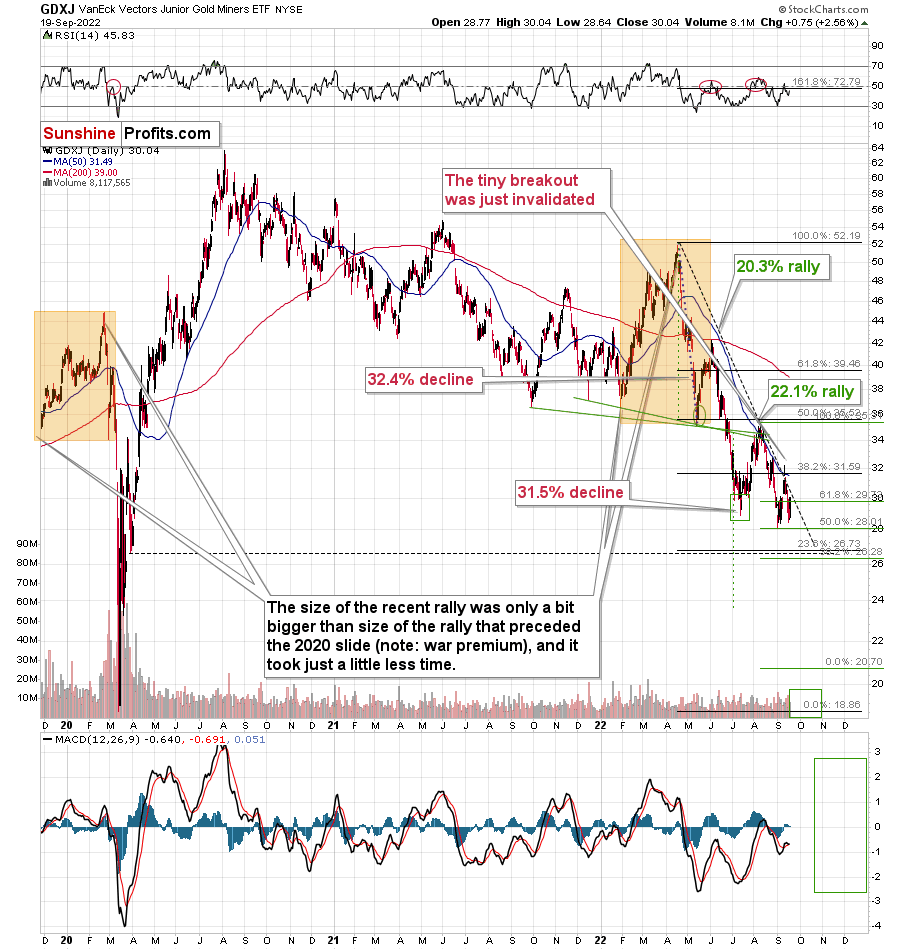
While gold prices are consolidating below their previous lows, the GDXJ is not below the early-September lows, which might appear bullish. However, is it?
The early-September low is not the only reference point out there. The lows through which gold broke are the 2021 lows. The GDXJ ETF is trading many dollars below those analogical lows. It’s not strong relative to gold, even though the last couple of days might indicate this.
The thing is that the GDXJ simply rallied substantially in the first half of September, likely due to the stock market’s rally. Thus, it resumed the decline from a relatively high price level (about $32).
Stocks are not below their early-September low at this moment, so it’s not that odd to see junior miners there as well.
While the stocks-juniors link might have had a positive impact on GDXJ’s prices recently, it’s likely to make them decline more in the future. Remember how stocks plunged in 2008? Or in 2020? And in what manner were they destroyed?
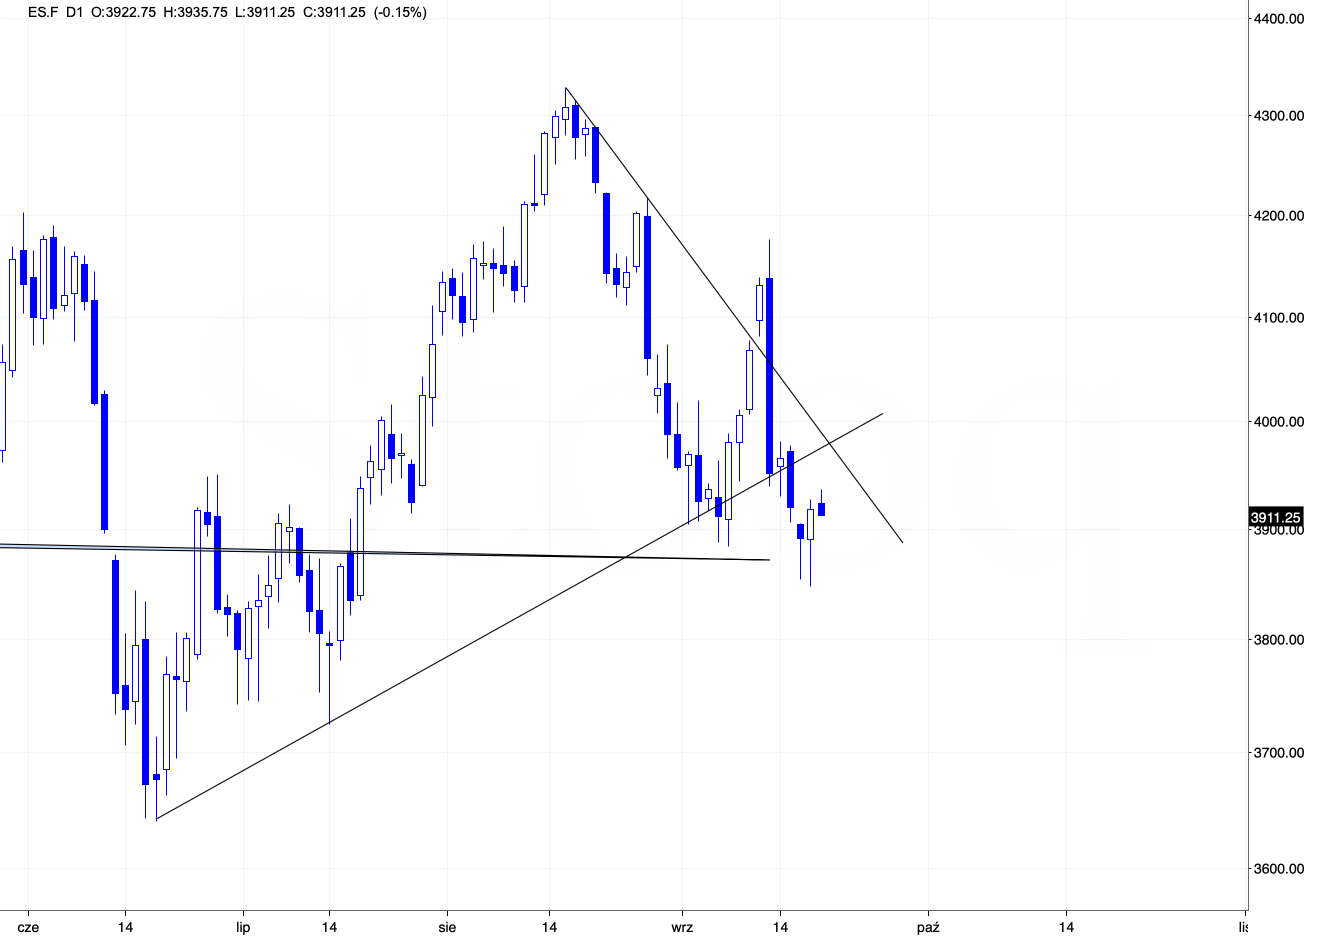
There’s one more interesting thing on the above S&P 500 futures chart. Namely, there’s a triangle-vertex-based reversal scheduled for tomorrow. This perfectly fits the scenario in which stocks move higher today or tomorrow (or they could do pretty much nothing), and then they slide in the following part of the week, after the rates are increased.
The implications for the very near term (next 1-3 days) are unclear, but they are bearish for the coming days.
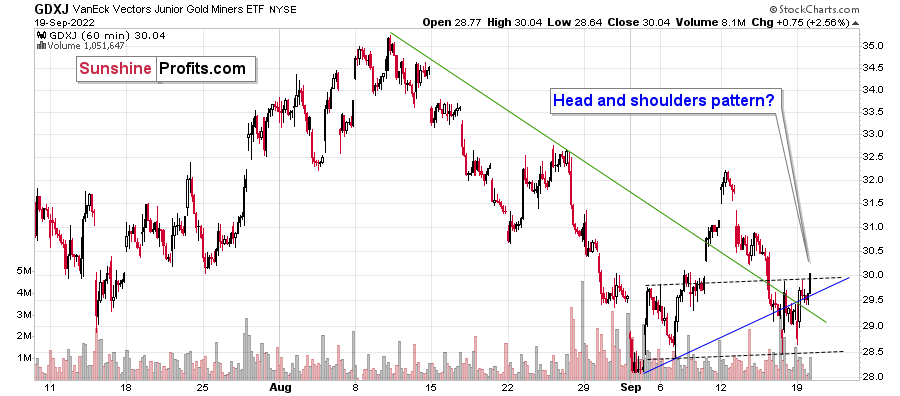
Also, looking at the 1-hour candlestick GDXJ chart, we see that the price might be forming a head-and-shoulders pattern, which is bearish – once it’s completed. In this case, it would take a decline below $28.5 for the formation to be completed, and the price would be likely to decline to at least $25. Based on other charts, the most possible target is about $20.
All in all, I wouldn’t bet the farm on a situation in which the precious metals sector declines immediately, but I continue to think that keeping short positions in the GDXJ at this time is very much justified from the risk to reward point of view. We’re aiming to profit from a huge decline here, not on day-trading – at least that’s my approach. Naturally, you can do with your capital whatever you want, but in my view, the big move provides the greatest risk-to-reward ratio.
Having said that, let’s take a look at the markets from a more fundamental angle.
Worsening Fundamentals
With risk assets opening red and then reversing sharply intraday on Sep. 19, the front run crowd may be hoping for a reprieve after the FOMC meeting on Sep. 21. Moreover, investors often ‘sell the rumor and buy the news,’ which supports a sentiment rally in the days ahead.
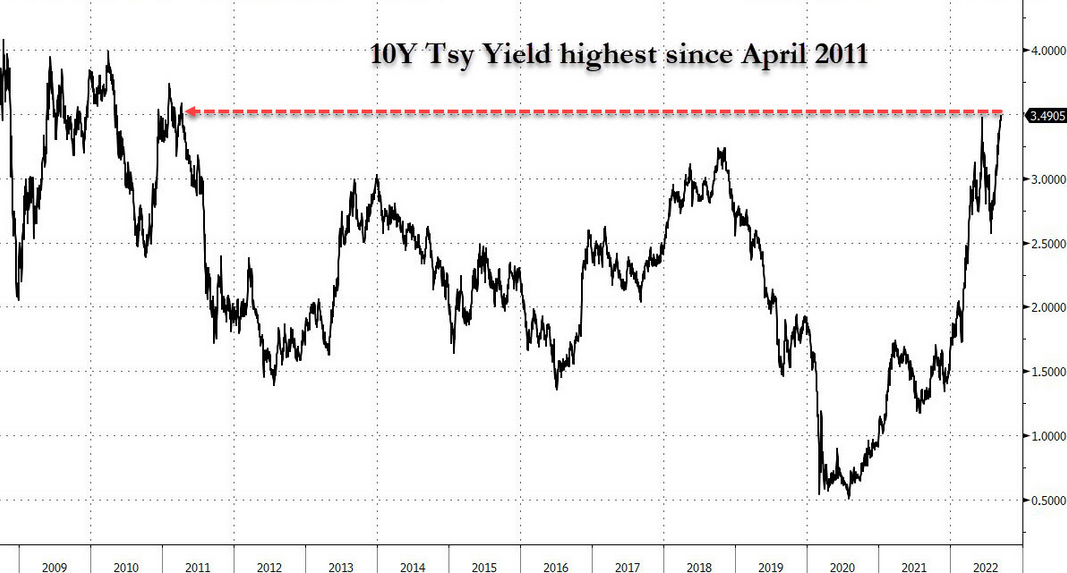
However, while the day traders measure their gains and losses in minutes and hours, gold, silver, mining stocks and the S&P 500’s medium-term fundamental outlooks continue to worsen. For example, nominal and real interest rates have risen sharply over the last month and a half, and the U.S. 10-Year Treasury yield hit its highest level since April 2011 on Sep. 19.
Please see below:
 Source: Bloomberg/ZeroHedge
To explain, the black line above tracks the U.S. 10-Year Treasury yield. If you analyze the right side of the chart, you can see that the benchmark continues to reach new milestones. More importantly, with the U.S. federal funds rate (FFR) poised to hit 4.5% to 5.5% in 2023 (roughly 4.5% is currently priced in), it will take a major inversion of the U.S. yield curve to keep the U.S. 10-Year Treasury yield from surpassing 4%.
As a result, only a significant decline in inflation and a Fed pivot (extremely unlikely) would keep the PMs’ fundamental outlooks from deteriorating in the months ahead.
To that point, financial conditions continue to tighten, and the liquidity drain is profoundly bearish for gold, silver and mining stocks.
Please see below:
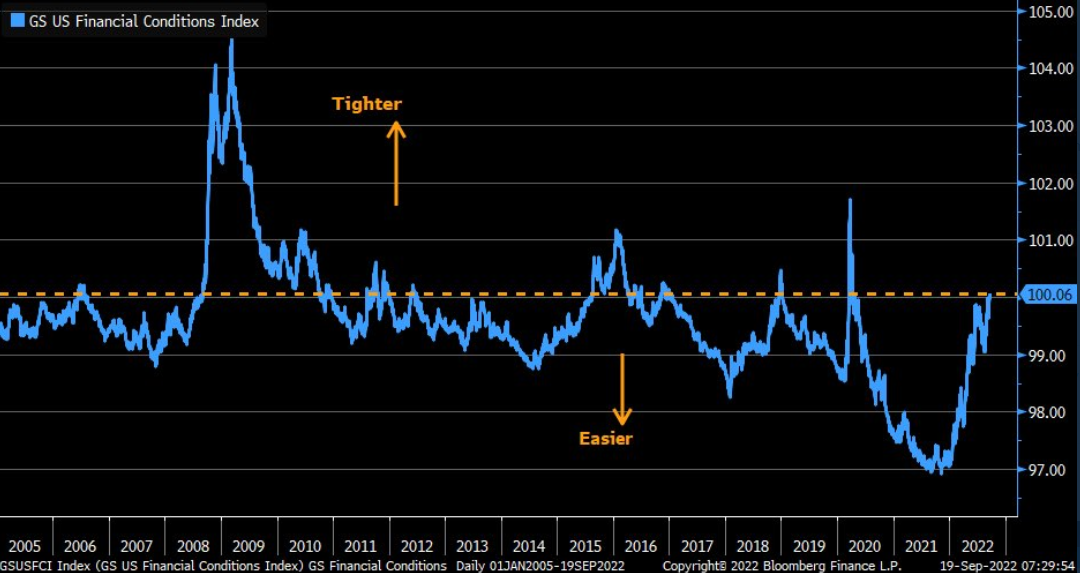
To explain, the blue line above tracks the Goldman Sachs Financial Conditions Index (FCI). If you analyze the right side of the chart, you can see that the metric hit a new 2022 high.
Furthermore, while the FCI remains highly elevated, it’s still well below its modern historical peaks, even though inflation is much higher than any post-2000 period. As such, the FCI should at least surpass the 2018 and 2015 highs given the current inflation outlook, and a realization should pressure risk assets.
So while the buy the dip crowd was out in full force on Sep. 19, the reality is that the fundamentals continue to trend in an ominous direction. In addition, these developments have only had a minor impact on inflation. With Americans realizing substantial wage increases and the U.S. labor market still resilient, we’re far from the demand destruction that would alleviate the pricing pressures.
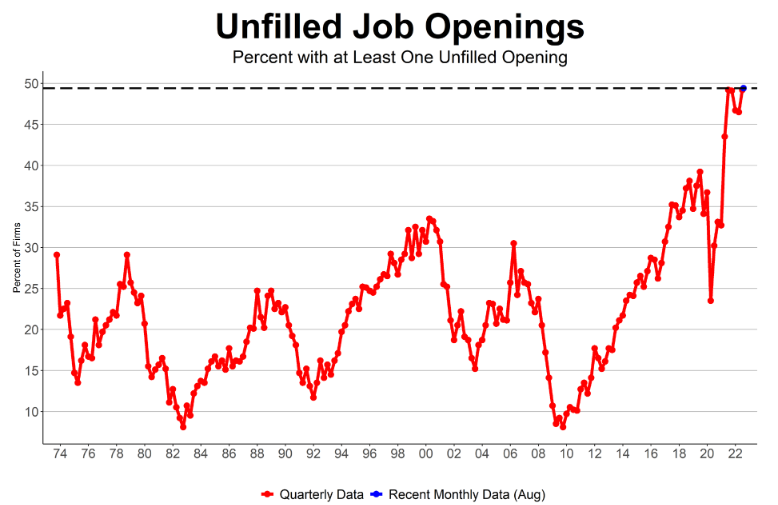
For example, the NFIB released its Small Business Optimism Index on Sep. 13. The headline index increased from 89.9 in July to 91.8 in August. NFIB Chief Economist Bill Dunkelberg said during the earlier released jobs report.
“The labor market continues to be a significant challenge for small business owners. Owners are managing several economic headwinds and continue to make business adjustments to mitigate lost sales opportunities due to staffing shortages. Almost half of owners are raising compensation to attract workers for their open positions.”
The report added:
“Small business owners’ plans to fill open positions remain elevated, with a seasonally adjusted net 21% planning to create new jobs in the next three months, up one point from July.”
Thus, while the crowd hopes the Fed is near the end of its rate hike cycle, U.S. small businesses’ labor demand increased month-over-month (MoM), which is bullish for wage inflation.
Please see below:
 Source: NFIB
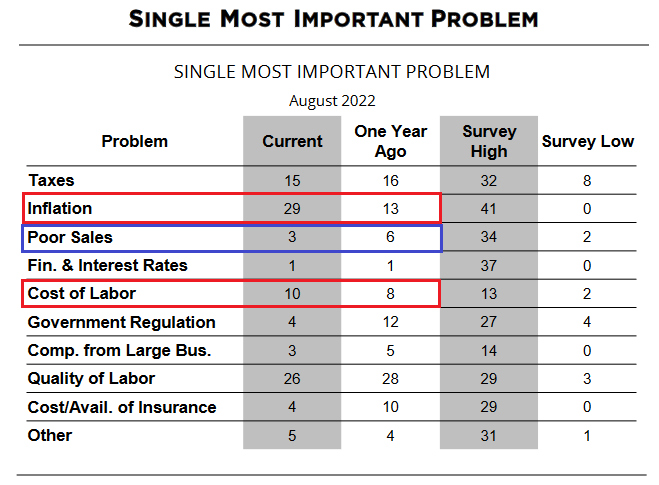
Likewise, it’s essential to separate narratives from fundamental reality; and with U.S. small businesses citing inflation and labor costs as material problems, the FFR needs to rise much further to normalize these issues.
Please see below:
 Source: NFIB
To explain, the red rectangles above highlight how the percentage of respondents citing inflation (29) and the cost of labor (10) as their “single most important problem” have increased versus August 2021.
Conversely, the blue rectangle above shows how the percentage of respondents citing poor sales (3) as their “single most important problem” has decreased versus August 2021. As such, with poor sales less of a problem than it was a year ago, U.S. small businesses are still experiencing resilient demand. In contrast, inflation and the cost of labor have worsened year-over-year (YoY).
Therefore, the data highlights why the FFR, the FCI and real interest rates need to rise to normalize the pricing pressures and stabilize the U.S. economy.
Far From Fair Value
While the S&P 500 staged an intraday comeback on Sep. 19, the U.S. equity benchmark remains in la-la land. For example, with lower-risk assets offering more attractive returns, the TINA (there is no alternative) argument doesn’t hold anymore.
Please see below:
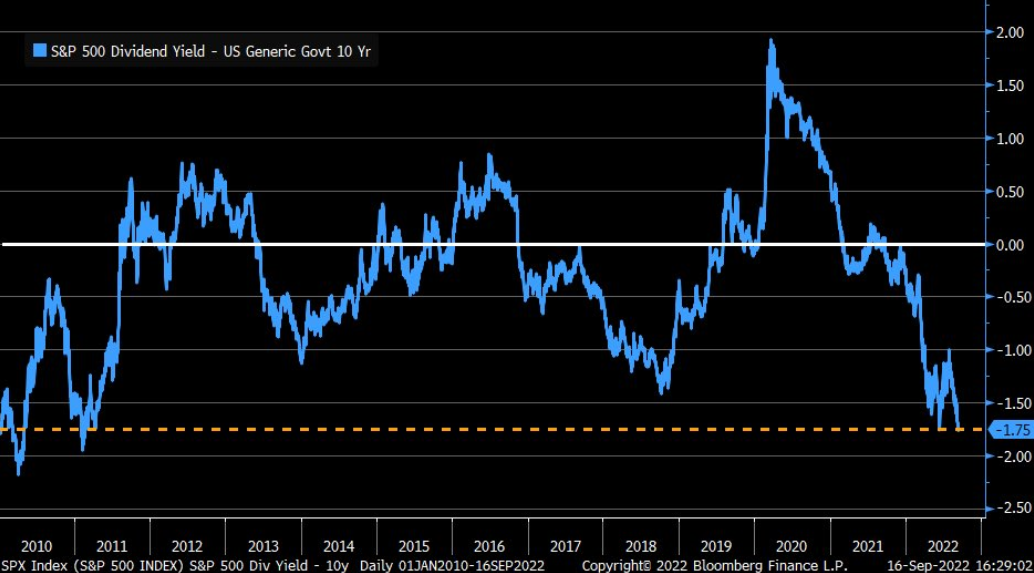
To explain, the blue line above subtracts the U.S. 10-Year Treasury yield from the S&P 500’s dividend yield. When the spread declines, it means that the former is outperforming the latter. Moreover, if you analyze the right side of the chart, you can see that the spread is deeply negative and is at/near multi-year lows.
As a result, the risk-reward of owning the U.S. 10-Year Treasury bond relative to the S&P 500 is much better now than it’s been in many years. Thus, faithful S&P 500 bulls are buying stocks at a time when they can earn a higher yield elsewhere with much less risk.
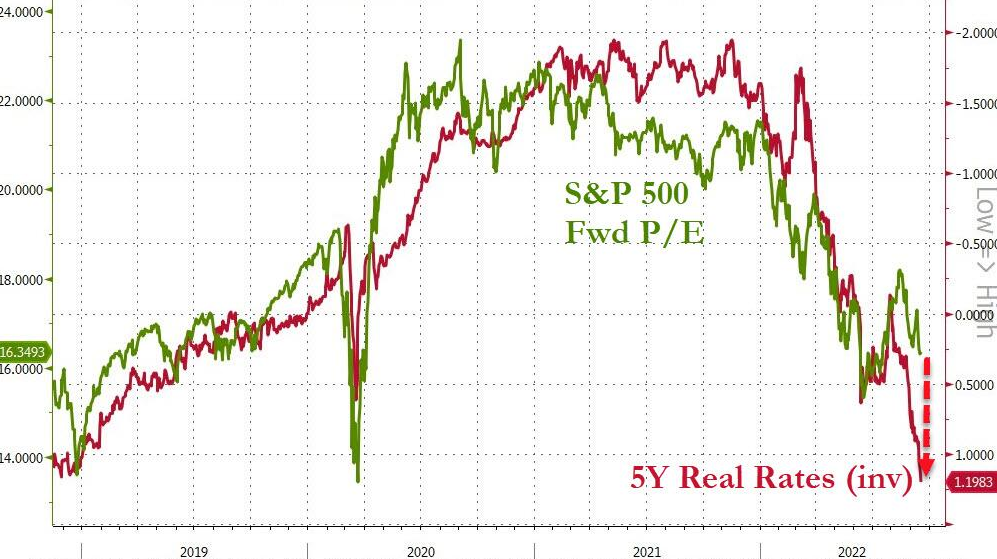
Second, the spike in real interest rates has widened the S&P 500’s valuation gap.
Please see below:
 Source: Bloomberg/ZeroHedge
To explain, the green line above tracks the S&P 500’s forward price-to-earnings (P/E) ratio, while the red line above tracks the inverted (down means up) U.S. 5-Year real yield. If you analyze the relationship, you can see that the pair often move in opposite directions.
More importantly, the material gap on the right side of the chart shows how the U.S. 5-Year real yield’s recent surge has not been accompanied by a lower S&P 500 forward P/E. However, with prior divergences often closing quickly, an S&P 500 forward P/E below 14x implies considerable valuation downside from the current reading of ~16x.
In addition, a ~13% decline would only normalize the S&P 500’s multiple. Yet, with a higher FFR, FCI and real yields poised to upend corporate earnings in the months ahead, there is significant downside if earnings slide materially.
Please see below:
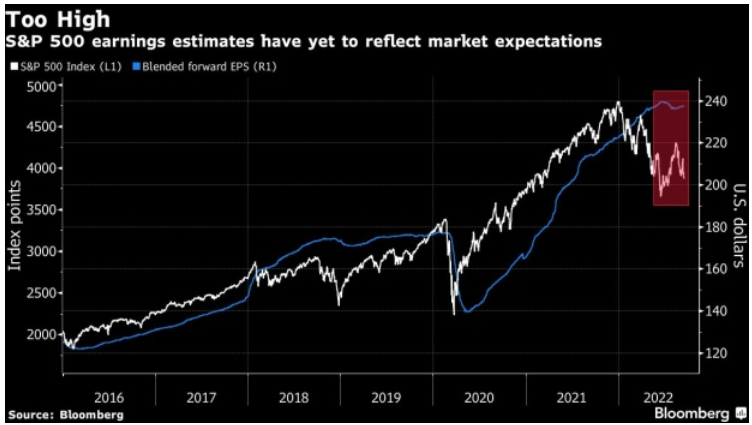
To explain, the white line above tracks the S&P 500, while the blue line above tracks analysts' S&P 500 forward earnings estimates. If you analyze the relationship, you can see that price and earnings often move in lockstep. However, the right side of the chart shows how despite the S&P 500's plight, analysts' S&P 500 forward earnings estimates have increased recently. Thus, the macroeconomic risks are far from priced in.
Also, the sharp drop in the white line in 2018 that occurred alongside a small drop in the blue line culminated with the Fed cutting interest rates. Therefore, while the S&P 500 sank and analysts' forward earnings estimates remained resilient, a dovish pivot saved the day back then. In contrast, the Fed needs a higher FFR, FCI and real yields now, which is the opposite of 2018. As a result, earnings estimates should come under pressure as the Fed continues to suppress demand.
Similarly, global equities will likely face a similar earnings reset in the months ahead.
Please see below:
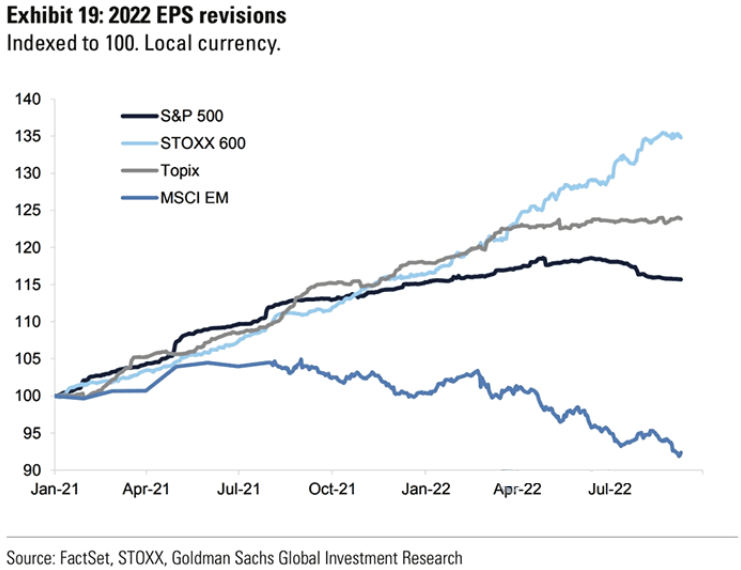
To explain, the royal blue line above (MSCI EM) shows how material earnings cuts have occurred for emerging market equities. However, the black (S&P 500), light blue (STOXX 600) and gray (Topix) lines above show how U.S., European and Japanese corporations have experienced immaterial earnings cuts. Thus, with the latter likely to catch up to the former, equity volatility should weigh heavily on gold, silver and mining stocks over the medium term.
The Bottom Line
While the dip buyers want you to believe that all is well on Wall Street, the fundamentals signal substantial downside for risk assets. With the Fed hawked up and interest rates rising sharply, the prior environment of QE and negative real yields is long gone. Moreover, with the Fed now realizing that its inflation fight will be one of attrition, only a major collapse supports a dovish pivot anytime soon. As such, risk assets remain on shaky ground and the bear market should have plenty of room to run.
In conclusion, the PMs were mixed on Sep. 19, as mining stocks closed in the green. However, while the GDX and GDXJ ETFs rallied alongside the S&P 500, the U.S. 10-Year real yield hit another 2022 high of 1.15%. Therefore, the PMs’ medium-term fundamental outlooks remain profoundly bearish.
Overview of the Upcoming Part of the Decline
- It seems to me that the corrective upswing is over, and that the next big move lower is already underway.
- If we see a situation where miners slide in a meaningful and volatile way while silver doesn’t (it just declines moderately), I plan to – once again – switch from short positions in miners to short positions in silver. At this time, it’s too early to say at what price levels this could take place and if we get this kind of opportunity at all – perhaps with gold prices close to $1,600.
- I plan to switch from the short positions in junior mining stocks or silver (whichever I’ll have at that moment) to long positions in junior mining stocks when gold / mining stocks move to their 2020 lows (approximately). While I’m probably not going to write about it at this stage yet, this is when some investors might consider getting back in with their long-term investing capital (or perhaps 1/3 or 1/2 thereof).
- I plan to return to short positions in junior mining stocks after a rebound – and the rebound could take gold from about $1,450 to about $1,550, and it could take the GDXJ from about $20 to about $24.
- I plan to exit all remaining short positions once gold shows substantial strength relative to the USD Index while the latter is still rallying. This may be the case with gold prices close to $1,400 and GDXJ close to $15 . This moment (when gold performs very strongly against the rallying USD and miners are strong relative to gold after its substantial decline) is likely to be the best entry point for long-term investments, in my view. This can also happen with gold close to $1,400, but at the moment it’s too early to say with certainty.
- The above is based on the information available today, and it might change in the following days/weeks.
You will find my general overview of the outlook for gold on the chart below:
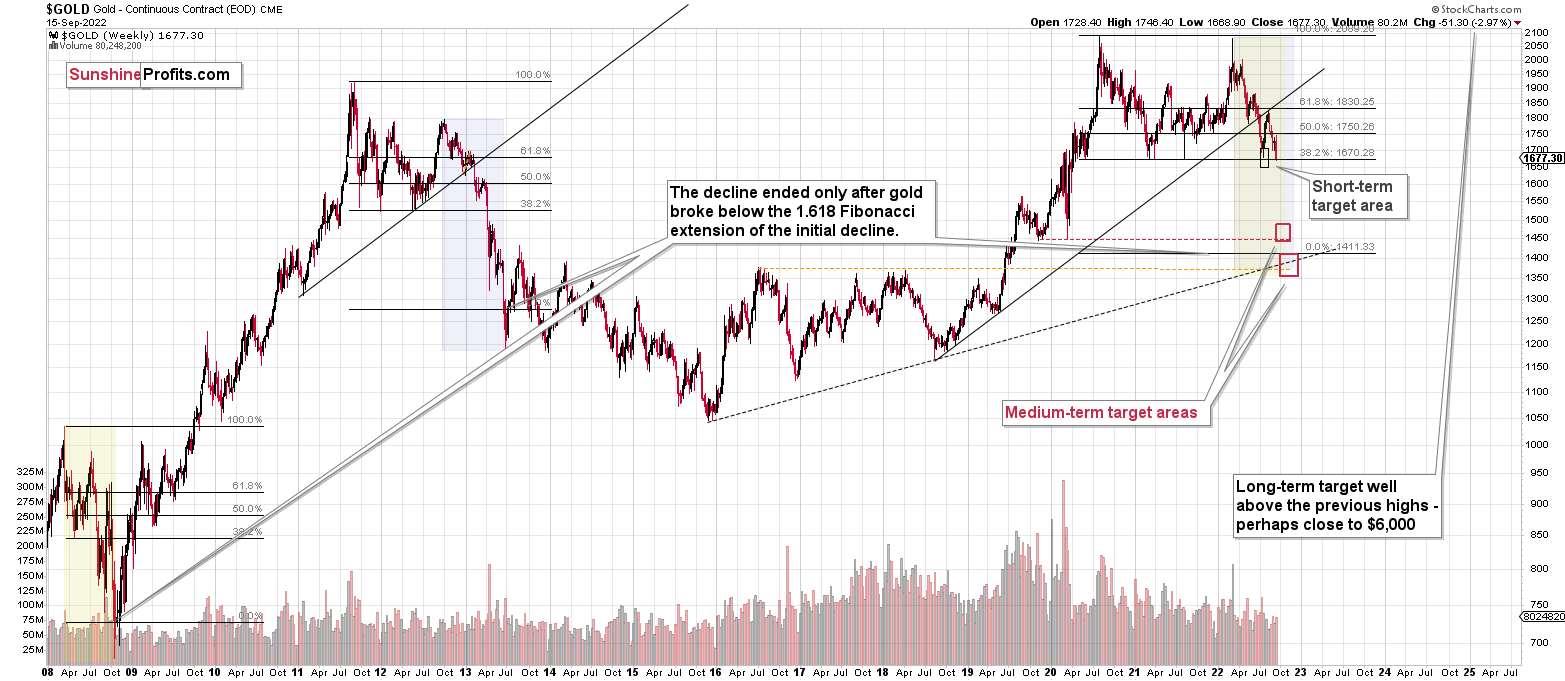
Please note that the above timing details are relatively broad and “for general overview only” – so that you know more or less what I think and how volatile I think the moves are likely to be – on an approximate basis. These time targets are not binding nor clear enough for me to think that they should be used for purchasing options, warrants, or similar instruments.
Summary
Summing up, it seems that the biggest part of the 2013-like decline is taking place right now, and – while I can’t make any promises regarding performance - it seems likely to me that our big profits are about to become huge, and then ridiculously big in the relatively near future.
Things might happen very fast in the coming days, and if I plan to make any adjustments, I’ll keep you informed. Still, if the targets that I’m mentioning in the “Trading” part of the summary are reached, I think that profits should be taken off the table without an additional confirmation from me. I will probably get on the long side of the market at that time, but I’ll send a confirmation if I decide to do so.
After the final sell-off (that takes gold to about $1,350-$1,500), I expect the precious metals to rally significantly. The final part of the decline might take as little as 1-5 weeks, so it's important to stay alert to any changes.
As always, we'll keep you – our subscribers – informed.
To summarize:
Trading capital (supplementary part of the portfolio; our opinion): Full speculative short positions (300% of the full position) in junior mining stocks are justified from the risk to reward point of view with the following binding exit profit-take price levels:
Mining stocks (price levels for the GDXJ ETF): binding profit-take exit price: $20.32; stop-loss: none (the volatility is too big to justify a stop-loss order in case of this particular trade)
Alternatively, if one seeks leverage, we’re providing the binding profit-take levels for the JDST (2x leveraged). The binding profit-take level for the JDST: $29.87; stop-loss for the JDST: none (the volatility is too big to justify a SL order in case of this particular trade).
For-your-information targets (our opinion; we continue to think that mining stocks are the preferred way of taking advantage of the upcoming price move, but if for whatever reason one wants / has to use silver or gold for this trade, we are providing the details anyway.):
Silver futures downside profit-take exit price: $12.32
SLV profit-take exit price: $11.32
ZSL profit-take exit price: $79.87
Gold futures downside profit-take exit price: $1,504
HGD.TO – alternative (Canadian) 2x inverse leveraged gold stocks ETF – the upside profit-take exit price: $19.87
HZD.TO – alternative (Canadian) 2x inverse leveraged silver ETF – the upside profit-take exit price: $49.87
Long-term capital (core part of the portfolio; our opinion): No positions (in other words: cash)
Insurance capital (core part of the portfolio; our opinion): Full position
Whether you’ve already subscribed or not, we encourage you to find out how to make the most of our alerts and read our replies to the most common alert-and-gold-trading-related-questions.
Please note that we describe the situation for the day that the alert is posted in the trading section. In other words, if we are writing about a speculative position, it means that it is up-to-date on the day it was posted. We are also featuring the initial target prices to decide whether keeping a position on a given day is in tune with your approach (some moves are too small for medium-term traders, and some might appear too big for day-traders).
Additionally, you might want to read why our stop-loss orders are usually relatively far from the current price.
Please note that a full position doesn't mean using all of the capital for a given trade. You will find details on our thoughts on gold portfolio structuring in the Key Insights section on our website.
As a reminder - "initial target price" means exactly that - an "initial" one. It's not a price level at which we suggest closing positions. If this becomes the case (as it did in the previous trade), we will refer to these levels as levels of exit orders (exactly as we've done previously). Stop-loss levels, however, are naturally not "initial", but something that, in our opinion, might be entered as an order.
Since it is impossible to synchronize target prices and stop-loss levels for all the ETFs and ETNs with the main markets that we provide these levels for (gold, silver and mining stocks - the GDX ETF), the stop-loss levels and target prices for other ETNs and ETF (among other: UGL, GLL, AGQ, ZSL, NUGT, DUST, JNUG, JDST) are provided as supplementary, and not as "final". This means that if a stop-loss or a target level is reached for any of the "additional instruments" (GLL for instance), but not for the "main instrument" (gold in this case), we will view positions in both gold and GLL as still open and the stop-loss for GLL would have to be moved lower. On the other hand, if gold moves to a stop-loss level but GLL doesn't, then we will view both positions (in gold and GLL) as closed. In other words, since it's not possible to be 100% certain that each related instrument moves to a given level when the underlying instrument does, we can't provide levels that would be binding. The levels that we do provide are our best estimate of the levels that will correspond to the levels in the underlying assets, but it will be the underlying assets that one will need to focus on regarding the signs pointing to closing a given position or keeping it open. We might adjust the levels in the "additional instruments" without adjusting the levels in the "main instruments", which will simply mean that we have improved our estimation of these levels, not that we changed our outlook on the markets. We are already working on a tool that would update these levels daily for the most popular ETFs, ETNs and individual mining stocks.
Our preferred ways to invest in and to trade gold along with the reasoning can be found in the how to buy gold section. Furthermore, our preferred ETFs and ETNs can be found in our Gold & Silver ETF Ranking.
As a reminder, Gold & Silver Trading Alerts are posted before or on each trading day (we usually post them before the opening bell, but we don't promise doing that each day). If there's anything urgent, we will send you an additional small alert before posting the main one.
Thank you.
Przemyslaw Radomski, CFA
Founder, Editor-in-chief

